Transcription
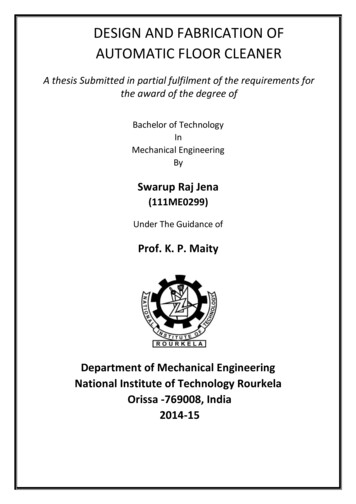
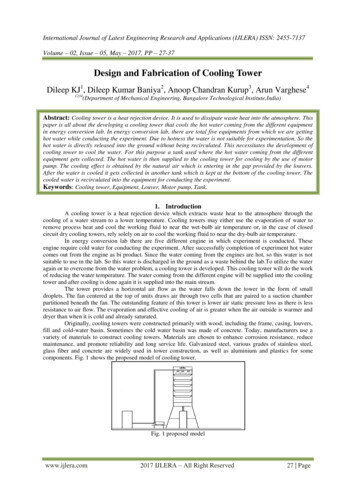
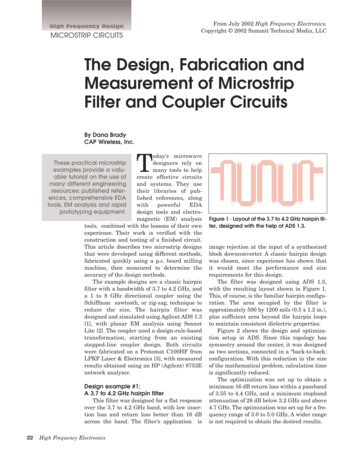
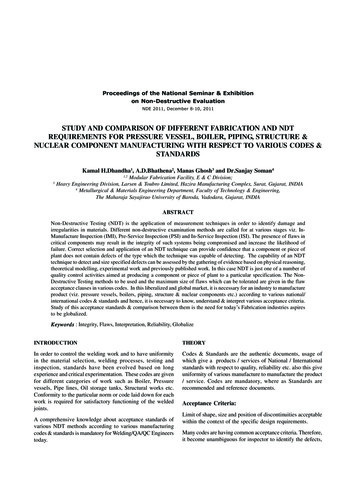
International Journal of Mining, Metallurgy & Mechanical Engineering (IJMMME) Volume 6 Issue 1 (2018) ISSN 2320-4060 (Online)Design, Fabrication and Analysis of aThermo-Acoustic RefrigeratorMoiz Ahmed1, Abdul Rehman1, Sohaib Ahmed1 and Ammad Fareed1 Resonating Tube: It houses all the components and standingwaves resonate inside the tube. Acrylic was chosen as thematerial of the tube mainly due to its low cost, easier availability,and workability. A frequency of 350 Hz and a quarterwavelength resonator design was selected, therefore the lengthof tube (OD 3 cm) is calculated as;Abstract— Thermo-acoustics deals with the conversion of heatenergy into sound energy. Cooling devices based on thethermo-acoustic principal, pump heat using acoustic waves. TheThermo-acoustic refrigerators are simple, have no reciprocatingparts and have no negative effects on the environment. On thecontrary, vapor-compression systems are complex devicesrequiring preventive maintenance, along with having detrimentaleffects on the environment.This paper describes the fabrication and analysis of a simplethermo-acoustic refrigerator. The design of the fabricated model isbased on the software simulation results of our former researchwork which delineate a numerical study and computer simulationscarried out on a couple of software; DELTAEC and ANSYSFluent. 2 new models were also constructed with the aim ofincreasing the effectiveness of the thermo-acoustic effect and allthe 3 models were tested on various frequencies and three differentpower levels. The final experimental results were in line with thepredictions of the software simulations and the new design modelsincreased the effectiveness of the thermo-acoustic effect by amaximum of 93% percent when compared to the initial fabricatedmodel.Keywords— Thermo-acoustic,gradient, frequency.refrigerator,Acoustic Driver: The acoustic driver is a driving source ofheat in a thermo-acoustic refrigerator. An electromagneticspeaker, with the rated power of up to 20W, was chosen mainlydue to its easy availability and cost.Stack: The stack is the portion where heat transfer takes placegenerating a temperature gradient. A spiral sheet stack wasmade with camera film and nylon fishing lines, as it is simple toconstruct while maximizing the surface area for heat transfer.Working Fluid: Air at standard room temperature andpressure.Temperature Data Logging: LM35 sensors connected to anArduino microcontroller were used to record the hot and coldside temperatures of our thermo-acoustic refrigeratortemperature,I. INTRODUCTIONA. Simplified DesignThis is the most simplified model (Figure 1), to demonstratethe thermo-acoustic phenomenon, it uses an electromagneticspeaker coupled at one end of the tube and an aluminum plug onthe other. The stack is placed at a calculated distance (5.2cm)from the tube’s end. The LM35 sensors are placed at theopposing ends of the stack.Apart from Vapor compression cycle, there are several waysto provide cooling and refrigeration. One such techniqueinvolves using sound waves to achieve temperature difference,this phenomenon is known as Thermo-Acoustic Refrigeration.Thermo-acoustic is a science that is concerned with theinteractions between heat (thermal) and pressure oscillations ingases (acoustics). There are two effects; the forward effect andthe backward effect [2]. The forward effect deals with thegeneration of pressure oscillations due to application of heatwhich is used to create heat engines. The other effect producestemperature gradient using sound waves and is used in thedesigning of thermo-acoustic refrigerators. To demonstrate thisphenomenon, we built a prototype refrigerator based on ourprevious simulation results [1].II. FABRICATED MODEL DESIGNSFig. 1: Assembled TAR Rendered ViewFor the physical demonstration of the thermo-acousticphenomenon a basic model with three different designs wereconstructed, comprising of following basic components:B.Stepping Reducer DesignThis design consists of a stepping reducer form to maximizethe transfer of acoustic energy into the resonating tube (Figure2). The reducer diameter and length, at the speaker outlet areMoiz Ahmed1, Abdul Rehman1, Sohaib Ahmed1 and Ammad Fareed1National University of Science and Technology, Pakistan.16
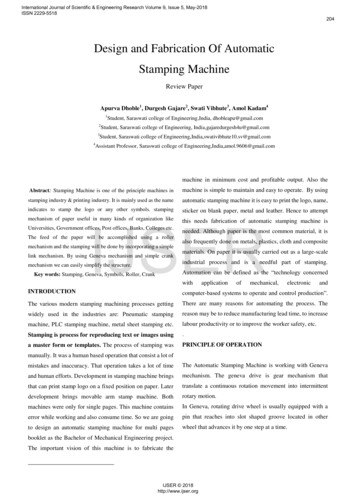
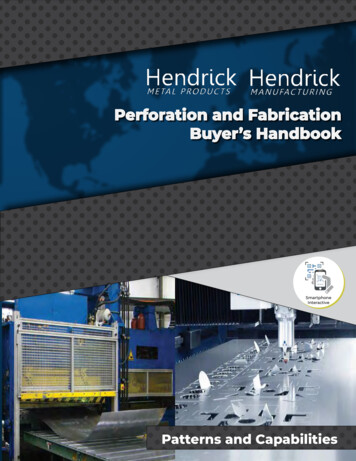
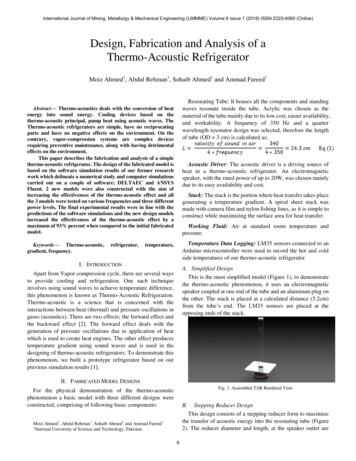
International Journal of Mining, Metallurgy & Mechanical Engineering (IJMMME) Volume 6 Issue 1 (2018) ISSN 2320-4060 (Online)(10.16 cm, 5 cm), followed by (7.62 cm, 9 cm) and finally (5.08cm, 4 cm) at the resonating tube inlet respectively.III. TESTING, RESULTS AND DISCUSSION:A. Simplified DesignThe resonant frequency for this design (Figure 4) was 350 Hzthough the design was tested over 10 different frequencies andthree different power levels.Fig. 2: Assembled Stepping Reducer Rendered ViewC. Tapered Reducer DesignThe tapered reducer (Figure 3) is a funnel that matches thediameter of the speaker at one end (17.8 cm) and tube outerdiameter at the other end (3 cm). The tapered reducer isdesigned to transfer nearly all of the energy into the tube, thoughlosses do occur. Its smooth taper allows the air particles toconverge at the inlet of the tube, hence it is the most effectivedesign amongst all other designs.Fig. 4: Actual Fabricated Simplified Design ModelThe maximum temperature gradient achieved across the stackwas 7 K at 350 Hz at 6.3 Watts of input power (Figure 5),however as the operating frequency crosses 350 Hz thetemperature gradient falls.Fig. 3: Assembled Tapered Reducer Rendered ViewFig. 5: 6.3 Watts Testing CurveThe graph (Figure 5) was analyzed using MATLAB andcurve fitting techniques were used to construct an equation thatcan theoretically determine the behavior of our refrigerator overa range of operating frequencies. (Figure 6). The followingequation (2) was obtained where T is the temperature gradientand f is the operating frequency.7
International Journal of Mining, Metallurgy & Mechanical Engineering (IJMMME) Volume 6 Issue 1 (2018) ISSN 2320-4060 (Online)Fig. 6: MATLAB Curve Fitting Codeother frequency with less than 14% error on 6.3 Watts operatingpower.At 14 Watts operating power, a temperature gradient profilewas generated (Figure 8) with a maximum of 8.6 K achievedaround 350 Hz.Based on equation (2) a predictive graph (Figure 7) is plottedwhich closely resembles the actual graph. The approximationerror in the equation above is within 14% percent of the actualvalues which is quite close, considering the turbulent behaviorof the thermo-acoustic phenomenon. Hence the predictivegraphs can be used to estimate the temperature gradient at anyAt 20.1 Watts a temperature gradient of 12.1 K was achievedacross the stack at 350 Hz (Figure 9)Fig 7: 6.3 Watts Predictive CurveFig 8: 14 Watts Testing Curve8
International Journal of Mining, Metallurgy & Mechanical Engineering (IJMMME) Volume 6 Issue 1 (2018) ISSN 2320-4060 (Online)Fig. 9: Testing at 20.1 Watts, 350 HzAn increase of greater than 50% temperature gradient can beseen which reflects on the effectiveness of this design. Theinstallation of reducers transfers maximum acoustic energy.B. Stepping Reducer DesignThe stepping reducer design (Figure 10) was tested over threedifferent frequencies and various power levels as specified inTABLE 1.Fig. 10: Actual Fabricated Stepping Reducer ModelTABLE I: Stepping Reducer TestingTestingFrequency330Hz340 Hz350 HzInputPower(W)TemperatureGradient (K)Comparison withOriginal Design6.39.842% increase1411.333% increase6.310.347% increase1411.842% increase6.310.854% increase1412.648% increase20.114.216% increaseK was achieved across the stack which is significantly higherwhen compared with the 12 K gradient achieved in the originaldesign. The diameter of the reducer at the inlet matches thediameter of the speaker cone, similarly the outlet of the reduceris same as the outer diameter of the tube therefore it takes mostof the acoustic input from the speaker and concentrates it at theinlet of the resonating tube, thus transferring maximum portionof the acoustic energy.C. Tapered Reducer designThe tapered reducer design (Figure 11) was tested on threedifferent frequencies and various power levels as specified inTABLE 2. For the tapered reducer design the resonantfrequency was 340 Hz. The tapered reducer design was the mosteffective amongst all the designs. A temperature gradient of 16Fig. 11: Assembled Tapered Reducer Model9
International Journal of Mining, Metallurgy & Mechanical Engineering (IJMMME) Volume 6 Issue 1 (2018) ISSN 2320-4060 (Online)TABLE II: Tapered Reducer TestingTesting Frequency330 Hz340 Hz350 HzInput Power (W)Temperature Gradient (K)Comparison with Original Design6.313.393% increase1415.076% increase6.312.883% increase1415.279% increase6.311.260% increase1413.559% increase20.115.829% increaseBe sure that the symbols in your equation have been definedbefore the equation appears or immediately following. Italicizesymbols (T might refer to temperature, but T is the unit tesla).Refer to “(1),” not “Eq. (1)” or “equation (1),” except at thebeginning of a sentence: “Equation (1) is .”temperature gradient of 12K for 18.75 watts of input acousticpower, in actual results we achieved 12.21K for 20.1 watts ofacoustic power. The simulated result is almost identical toactual result. The actual power was only 7% greater ascompared to the simulated power which accounts for the heatlost and gained from the surroundings.IV. CONCLUSION AND DISCUSSIONREFERENCESAfter extensive analysis through 45 tests runs; we achieved atemperature gradient of 12.21K at an input of 20.1 watts aspredicted by our simulation software in our previous researchwork [1]. For analysis we tested our prototype over 10 differentfrequencies and 3 different power levels. We also tested for twoadditional designs; 1) Stepping Reducer Design 2) TaperedReducer Design. For stepping reducer design, we achieved amaximum gradient of 14K for input power of 20.1 watts. Fortapered reducer design we achieved a maximum gradient of 16Kfor an input power of 20.1 watts.In our former research [1], we simulated the thermo-acousticrefrigerator model using ANSYS and DELTAEC to predict a10[1]S. Ahmed, A. Rehman, A. Fareed, S. M. S. ul Haque and A. M. Hadi,"Simulation of a Thermo-Acoustic Refrigerator," International Journalof Mining, Metallurgy & Mechanical Engineering (IJMMME) Volume5, Issue 1, 2017.[2]D. G. Chinn, "The Digital Repository at the University of .umd.edu/bitstream/handle/1903/11283/Chinn umd 0117N 11865.pdf?sequence 1&isAllowed y.
predictions of the software simulations and the new design models increased the effectiveness of the thermo-acoustic effect by a maximum of 93% percent when compared to the initial fabricated model. Keywords— Thermo-acoustic, refrig