Transcription
Ageas' strategy in the UKA G E A S I N V E S T O R D AY6thO F J U N E 2 0 17ILISBON PORTUGAL
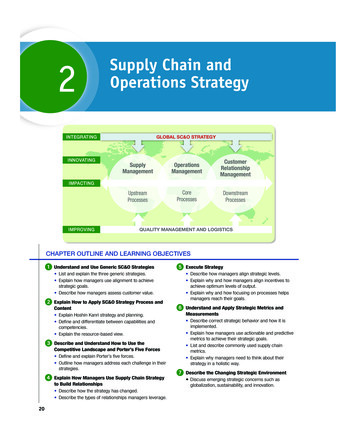
UK Non-Life Insurance MarketAgenda Ageas in the UK 2016 results Our plan ConclusionI2I
UKNon-Life Insurance MarketI3I
2015 GWPin GBP Lloyds0.70.9Admiral1.2XL1.2NFUAgeasLVZurich Wide variation in competitor business models Mixture of personal and commercial lines1.3 Different product mix1.41.5 Various distribution IGI4I0.5NoteBased on PRA return data for 2015Ageas figures exclude Tesco3.34.64.8
utionMotor Knowledgeable, price driven consumers Historically low underwriting profit with established pricing Direct and Aggregators strong Brokers more successful in specialist areasHome Less of an underwriting cycle Results dominated by weather events Relative profitability and competitive pressures means falling Aggregators increasing their presence Brokers having some success in more specialist Focus on a package of products Less price driven, good profitability Less volatile than other markets Broker dominated market Direct propositions still the minority Electronic trading increasingpremiums and margins Claims inflationSmallCommercialI5Icycles Overall profitability can be improved by access to nonunderwriting income streams Prior to Ogden, good premium inflation but underlying claimsinflation and IPT increaseareas
Past/currentUK regulationand legislationI6IInsurance Premium TaxFuture
Ageas in the UKI7I
General Insurancemarket share (2015 data)GWP in EUR bnPartners across fivemarket sectorsEmployees4,0003.3%2,50093,000Ageasin the UKActive brokersKwikFitwhollyunderwrittenby AgeasGroupama acquisition towiden product portfolioEntered intopartnership with Tesco,Toyota and Aioi2,5002,000LaunchedRIAS brand1,500Moved own brands(RIAS and CastleCover) to be whollyunderwritten by AgeasJV with Tesco U/WAge UKpartnership1,000Renewed Age UKpartnership for10 years furtherAcquired CastleCover500Acquired OutRight and Affinity Solutions tostrengthen capabilities in PartnershipsAcquired KwikFitFinancial 1120122013201420152016GPW figures include TescoGeneral Insurance market share based on PRA return data for 2015 Ageas figures excludes Tesco
GWPChannel CharacteristicsBrokerEUR1,331 mioOur routesto market todayPartnersEURTesco UnderwritingEUR483 mio215 mioDirectEUR175 mioI9I Most important channel will remain our dominant route to market Operating models range from entirely High Street based, to large telephone and on-line brand-lead propositions Proven resilience to market development via consolidation, networks, investment in anti-fraud capabilities, but elements still under pressureSuccess in specialist sectors Partners selected for their distribution benefit Need for both parties to make target returns; benefits negativily impacted by growth of aggregator channel Partner portfolio includes: motor manufacturers; Tesco Bank, via 50.1% ownership of Tesco Underwriting;and Age UK (Motor, Household, Travel) Route to market originally via acquired broker businessesOperating models changed from panel to solely AgeasMulti-channel distributionBrand rationalisation, marketing capabilities updated and underwriting footprint expandedMillennial proposition launched ‘Back Me Up’
Ageas mix by GWPOurproductmix rd3 in Private Motor(AIL & TU combined)th 7 in Household Significant change in productmix with growth in Commercialand Householdearly20002016 Motor Household SME OtherI 10 INote:Market shares based on PRA return data for 2015Ageas figures exclude Tesco
Private CarHouseholdin EUR bnin EUR bnGWP2015Gross WrittenPremiumsDirect Line1.3LloydsAviva1.3Direct 0.3Allianz0.2LV0.20.2Covea0.0I 11 IGWP0.300.60.91.21.50.00.20.40.60.81.0Note:Market shares based on PRA return data for 2015Ageas figures exclude Tesco
2016 ResultsI 12 I
Net resultAs reportedin EUR mio201120122013201420152016Gross Written Premiums2,0352,2292,2842,3982,4572,203Operating resultof which Investment result665210678905462592864(130)66Profit Before Tax12114711911435(185)Net profit after tax83959212030(135)Net profit after tax TU4138(2)(0.2)(21)Net profit Ageas 2%Combined ratioI 13 I
Net resultUnderlyingExceptional chargesespecially in 2016Signficant adverse weather cost in 2015 and 2016I 14 Iin EUR mioNet profit Ageas cturing27Ogden discount rate155Non-performing MGA31Capital gain UK Life sale(21)Net result UK Life4Total non recurring charges4Underlying net profit after tax90GBP/EUR impact2302(18)021310810210030577.1(4.8)6.08.97.2
Exceptionalitems in 2016I 15 IRestructuring OrganisationNon-performing MGAOgden Discount Rate Review Closure of Glasgow as part of a broaderstrategy to optimise costs Agreed contract in 2009 with an MGA tosupport growth strategy in broker channel Change in Kwik Fit business model:closed to new business and renewalswholly underwritten by Ageas Three portfolios: Household, Travel andSpecial Risks Reduction of Ogden rate from 2.5%to minus 0.75%, with effect fromth20 March, 2017 Administration now handled in otherAgeas UK locations Cooperation with authorities to supportre-employment of former employees 70% at time of closure Applies to all open and future claims Includes a number of long tail products suchas Warranty and Gap insurance One-off impact on Ageas UK ofEUR 155 mio Termination of contract early 2017, followinglosses, in particular in Special Risks portfolio Industry wide impact of GBP 7 bn (ABIdata) Special Risks products no longer part of ourunderwriting strategy Prices across impacted lines up c.10% Ministry of Justice consulting on newmethodology; industry making case forpragmatic new approach
GWP increased by 1.9% in localcurrency Hardening market in Motorproviding opportunity for rateincreases Continued soft Household ratingGWPanalysisenvironment, but success inwinning new specialist schemes Broker opportunity inin EUR mio Kwik Fit moved from partnership1572174261,106to direct Partnership driven by path toprofitaggregators now laid, with plansto grow direct via this channel in2017 2017 GWP will be impacted bymarket dislocation due to pricingreactions to Ogden rate changeGWP Analysisby channelin EUR mio, %1,905Commercial lines Foundations to compete onI 16 IGWP Analysisby product1,7209922439313%25113%24713%2015 Other Commercial Household Motor21513%17510%87%Standard20161,0041,40774%FY 2015Specialist1,33177%FY 2016 Partnerships Direct BrokerGPW figures exclude Tesco17%Specialist83%Standard
TotalUnderlying CORFY 2015FY 2016COR reported102.0%112.2%Ogden rate change (excl. .2%0.4%Discontinued OperationsCOR underlying-0.8%-2.4%98.3%99.5% 2016 COR significantly impacted byOgden rate change Management action taken todiscontinue non-performing MGAI 17 I
TotalPersonal motorUnderlying CORFY 2015FY 2016COR reported102.0%112.2%Ogden rate change (excl. derlying CORCOR reported-9.6%Ogden Ageas-0.8%WeatherFY 2016104%114.8%-13.5%-0.4%0.4%COR underlyingDiscontinued OperationsCOR underlyingFY 2015-2.4%98.3%99.5% 2016 COR significantly impacted byOgden rate change Management action taken to103.6% 101.3%discontinue non-performing MGAMarket and Ageas improvingprofitability: Hardening market in 2016 Rate increases successfullyimplemented Ogden dislocation anduncertaintyI 18 I
TotalHouseholdUnderlying CORFY 2015FY 2016COR reported102.0%112.2%Ogden rate change (excl. TU)OperatingperformanceWeatherRestructuringCOR reported-4.2%-0.8%FY 201699.5%98.5%-2.4%98.3%COR underlying99.5% 2016 COR significantly impacted by Management action taken toOgden AgeasWeather0.4%Ogden rate changediscontinue non-performing MGA-0.3%-13.9%85.6%98.2%Soft market - Action underway in2017: Action on underperforming I 19 IFY 2015-9.6%Discontinued OperationsCOR underlyingUnderlying CORschemesPricing / rating capabilityimprovementIndemnity spend actions,especially escape of water
TotalCommercialUnderlying CORFY 2015FY 2016COR reported102.0%112.2%Ogden rate change (excl. .8%FY 201692.7%108.1%-2.4%98.3%99.5% 2016 COR significantly impacted by Management action taken toOgden AgeasWeather0.4%Ogden rate changediscontinue non-performing MGAI 20 ICOR reportedFY 2015-9.6%Discontinued OperationsCOR underlyingUnderlying CORCOR underlying-12.1%-7.0%85.6%95.9%Trading margin for growth andmaintaining sub 97% CORunderlying whilst developing theCommercial book
TotalPersonal motorUnderlying CORFY 2015FY 2016COR reported102.0%112.2%Ogden rate change (excl. derlying CORCOR reported-9.6%Ogden Ageas-0.8%WeatherFY 2015FY 2016104%114.8%Discontinued Operations-0.4%Ogden rate changediscontinue non-performing MGA103.6% 101.3%Market and Ageas improvingprofitability: Hardening market in 2016 Rate increases successfullyimplemented Ogden dislocation anduncertaintyI 21 IUnderlying CORFY 2015FY 201699.5%98.5%COR reported-0.3%Ogden AgeasOgden AgeasCOR underlying99.5% 2016 COR significantly impacted by Management action taken toCOR reportedWeather-2.4%98.3%Underlying CORCommercialFY 2015FY 201692.7%108.1%-13.5%0.4%COR underlyingCOR underlyingHouseholdWeather-13.9%85.6%98.2%Soft market - Action underway in2017: Action on underperforming schemesPricing / rating capabilityimprovementIndemnity spend actions,especially escape of waterCOR underlying-12.1%-7.0%85.6%95.9%Trading margin for growth andmaintaining sub 97% CORunderlying whilst developing theCommercial book
Net ExpensesNet Expense Ratioin EUR 14210.6%Expensesexcl.levies202levies23OIC* Expense ratio (incl. levies) Acquisition ratio OIC ratio181-31%140 12%25-35%117I 22 I2016Net Expense Ratio13.1%12.5%Full Time Equivalents4,459*Other income and 6N.B.: 2016 expenses exclude BMU investment spendand Galileo exceptional costsYear on year reduction in expensesdriven by: Cost savings initiatives Creation of single overhead functionsReduction in operating costsrelated to Kwik FitAbsorbing levy increases relatingto Flood ReExpense savings offset reductionin OIC
Investment Yield Analysis2015 - 2016Asset mix Reinvestment Yield 10 year GILT3.00%2.50%Investmentreturns4% 3%1%1%2.00% On constant exchange rateinvestment income improved year onyear Good returns achieved on sale 2015Dec2015Mar2016Jun2016Sep2016in EUR mio646620152016higher yield bonds and investmentsin infrastructure Under performance in other areasand costs associated with propertybond investmentDec201691%Investment IncomeI 23 I Bond portfolio average duration: 3.5 Cash Property Funds Infrastructure High Yield IG Fixed Income Derisking in Q1 '17 through saleof high yield bonds, a mitigationto Ogden solvency impact;consequently realising capital gains
Ogden RateSolvency planOwn FundsQ4 15Q1 16Q2 16Q3 16Q4 16Q1 171,0991,057998912709694in EUR mioSCR Ageas843768745678707636 Steps taken to improve the solvency positionpost Ogden. Specifically: Reinsurance Derisking of investment portfolio Ageas Group capital injection of EUR 77 mioin April (incl. TU)in EUR mioSolvency Ratio (%)130138134135100109 “Adjusted Q1” Solvency Ratio of 121% Retained future profits will further strengthenthe positionI 24 I
Our planI 25 I
Developing our channel mixIn summary Improving the loss ratio Taking decisive action on cost Prioritising the customerI 26 I
Channel MixContinue to support Brokers, stabilising Partnerships and growing DirectKey priority 1Developing channel mixBrokersPartnershipsDirect Maintain ‘Broker Champion’position in Motor market andgrow Household panel shares Optimise partnerships which aredelivering mutual benefit and takeaction on those which are underperforming Grow the aggregator portfolio by transferring the KwikFit panel portfolio to be underwritten by Ageas Increase penetration ofSpecialist market acrossMotor and Household Grow Commercial digitalSME, Open Market andSchemes businessI 27 I Increase directly underwritten aggregator new businessportfolio by widening the target customer footprint Attract customers direct to brand by developing newpropositions
Loss ratio improvementMaintaining underwriting discipline and managing claims inflationKey priority 2Improving claims ratioI 28 I Implementation of insurer hosted pricing capability Investment in underwriting and pricing expertise New Household pricing structures Continued investment in anti-fraud controls Management of claims inflation Action taken to price in Ogden
Net Expense RatioKey priority 3Action on cost Costs are being reduced through digitalenablement increasing the use of onlinetools for consumers and brokersIncreased process automation acrossseveral functions15%11.2%8.6%8.9%9.2%8.8%Increasing acquisition costs are driven byinvestment in growth of the direct channelReducing Other income due to move towriting of own risks10%5%0%-4.2%-3.9%-3.6%-5%2017I 29 I10.1%20182019ratio (%) Expense ratio (incl. levies) Acquisition ratio OIC ratio
Key priority 4Our customerI 30 I Our purpose is to make our customers liveseasier Industry recognition of the quality of productsand services we provide Internal initiatives to reinforce a customer-firstapproach New propositions developed to appeal to awider target customer base New digital tools to improve customers andbrokers interaction
ConclusionI 31 I
now Our rightto competeI 32 I Strong market positions in our core productmarketsStrong and long standing commitment to andpresence in broker channel Proven partnership capabilities with a numberof long term relationships Significant market share in older (andgrowing) age segments Excellence in customer satisfactionin the future Multi product, multi channel Increased market share in core product marketsand growth in Commercial SME Expert in specialist areas Digital propositions, support growth in direct tocustomer and Commercial SME channels Pricing sophistication across product lines withimmediate speed to market Market leader in customer satisfaction Continued simplification of operating model withconsolidated UK structure
Over the long term we remain committed to achievinga combined ratio of 97%I 33 I
Jun 02, 2017 · General Insurance market share (2015 data) 3.3% Employees 4,000 Active brokers 2,500 Partners across five market sectors 9 GPW figures include Tesco General Insurance market share based on PRA return data for