Transcription
Finance Shared Services BenchmarkHighlights2020 ScottMadden and APQC Finance Shared Services Benchmarking StudyOctober 2020Copyright 2020 by ScottMadden, Inc. All rights reserved.
IntroductionAbout the StudyScottMadden and APQC recently completed the fifth cycle of our Finance Shared ServicesBenchmarking Study. Study scope covers four major areas:DeliveryModelScope ofServicesStaffing andPerformanceTechnology25 Metrics43 Qualitative QuestionsCopyright 2020 by ScottMadden, Inc. All rights reserved.1
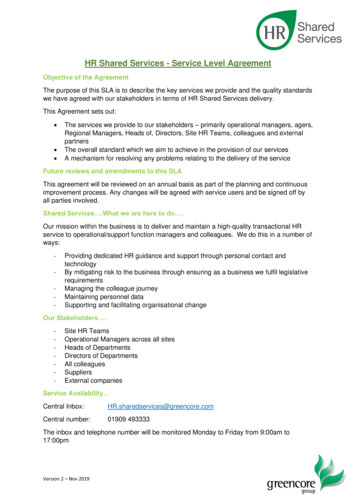
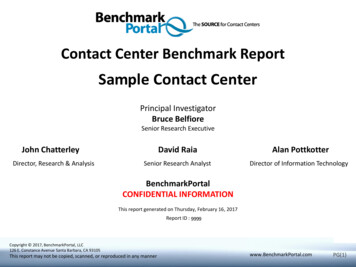
IntroductionParticipant CharacteristicsThe results summarized represent 200 participants from the last two cyclesn All participants are U.S. or Canada basedn 87% of participants have been operating more thanHow long has your shared services center been operating?three years; more than half of participants have beenoperating for more than five years1%Ten or more yearsn Company size is balanced across the revenue13%20%profiles, with median revenue of 11.9 billionAt least five but less than ten yearsAt least three but less than five yearsBusiness Entity Revenue32% 15 billion or greater23%35%At least one but less than three yearsLess than one yearBetween 5 billion and 15 billion30%40%Between 500 million and 5 billion8% 500 million or less0%10%20%30%40%50%Copyright 2020 by ScottMadden, Inc. All rights reserved.2
Study HighlightsGeographic Model and Governancen 53% of study participants reported using a GBS modeln A majority of SSCs report to a finance executiveTo whom does your SSC report?Finance executive65%Multi-function shared services executive24%Matrixed between finance and multi-functionshared services executivesGeographic Model1%1%Non-finance executiveOther10%2%0%Single global center physically located in one space24%Regional centers with global management andintegrationSite/country-specific centers with global managementand integration46%20%9%Regional centers run independentlySite/country-specific centers run locallyN/A - my organization does not have global operationsCopyright 2020 by ScottMadden, Inc. All rights reserved.3
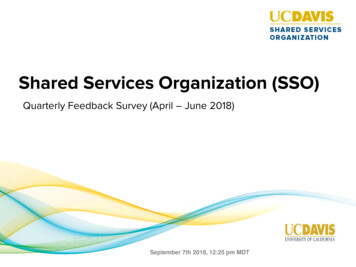
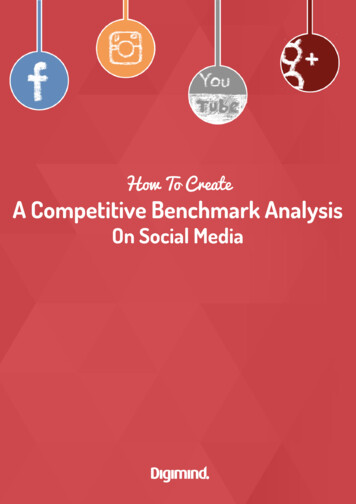
Study HighlightsGlobal LocationsIn which regions are your SSCs located?n 80% of study participants reported having SSCs located inNorth America, followed by 53% in Asia Pacific and 44% inEurope– 69% of study participants reported having SSCs located inmore than one regionn 79% of participants have more than one SSC, and two-thirds ofSSCs serve more than one countryLatinAmerica19%At least 40 countries,11%Five, 8%AsiaPacificMiddleEast/Africa 53%12%One, 21%Four, 11%Three, 24%NorthAmerica80%Europe44%Only one country,34%How manyseparate financerelated SSCs doyou have?At least 10countries, butless than 40countries, 30%How manycountries receiveservices providedby your SSC?Two, 35%At least two countries, butless than 10, 25%Copyright 2020 by ScottMadden, Inc. All rights reserved.4
Study HighlightsScope of Shared ServicesThe most common servicesprovided by the SSCs includeaccounts payable, generalaccounting, collections, andcustomer credit.Which of the following processes are in-scope for your SSC?Process accounts payablePerform general accountingManage and process collectionsProcess customer creditPerform financial reportingInvoice customerProcess accounts receivableProcess payrollProcess expense reimbursementsPerform fixed asset accountingPerform planning/budgeting/forecastingPerform cost accounting and controlProcess taxesManage internal controlsPerform due-diligenceManage cashDevelop tax strategy and planManage in-house bank accountsOrder materials and servicesManage sales ordersMonitor and execute risk and hedging Develop and manage pricingOther front office processes (please describe)Other back office %12%Which of the following processesdoes your SSC or organizationoutsource?Process expense reimbursements, 80%Perform general accounting, 60%Process accounts payable, 58%Process accounts receivable, 51%Manage and process collections, 25% Processing expense reimbursementsand general accounting are the mostcommonly outsourced services11%9%9%8%8%6%High-value services areprovided by some SSCs6%2%0%Copyright 2020 by ScottMadden, Inc. All rights reserved.5
Study HighlightsE2E Process Adoption and TimingMost SSCs have adopted one or more end-to-end (E2E) processn A majority implemented the processes before or during shared service implementationn The most common in-scope E2E processes are procure-to-pay and record-to-reportWhich of the following E2E processes are in-scopefor your shared services center?Did you implement E2E processes before, during,or after shared services DuringAfterCopyright 2020 by ScottMadden, Inc. All rights reserved.6
Study HighlightsRPA and Intelligent Automation Applicationsn 27% of participating SSCs are harnessing the power of RPA, with another 46% piloting or thinking aboutusingn While only 13% have implemented IA applications, 56% reported piloting or thinking about usingTo what extent does your SSC use RPA/intelligent automation applications?RPAIntelligent Automation ApplicationsNot using29%Thinking about using28%Conducting pilot to validate utility18%Some robots in production environment ( 50)31%Thinking about using35%Conducting pilot to validate utility21%20%Enterprise wide RPA robots ( 50) in productionNot sureNot using7%1%ImplementedNot Sure13%1%Copyright 2020 by ScottMadden, Inc. All rights reserved.7
Study HighlightsRPA and Intelligent Automation Applications (Cont’d)n 48% of SSCs indicated their RPA ownership resides in an RPA center of expertise; another 27% have RPAresiding in business unitsn Organizations are most commonly using intelligent automation applications for research/analytics/reportingand call center replacement/augmentationSharedServiceCenter, 10%Other (pleasedescribe), 1%For which purposes are you using intelligentautomation applications?ITDepartment,13%Where does RPA“ownership”reside?RPA Centerof Expertise,48%Research/analytics/reporting23%Call centerreplacement/augmentation22%Predictive forecasting21%Document layout recognitionBusinessUnits, 27%Prescriptive solutions17%2%Copyright 2020 by ScottMadden, Inc. All rights reserved.8
Top-Performer AnalysisWho Are the Top Performers?Top performers generally have:n Greater organization annual revenuen More employeesn Slightly broader global coverageTop-Performer GroupComparison GroupOrganization Revenue 43.8billion in annual revenue 19.6 billion in annual revenueNumber of Employees Served100,000 employees served55,000 employees servedCountries Served70%serve multiple countries64% serve multiple countriesCopyright 2020 by ScottMadden, Inc. All rights reserved.9
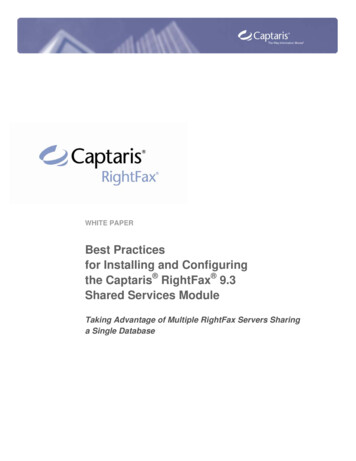
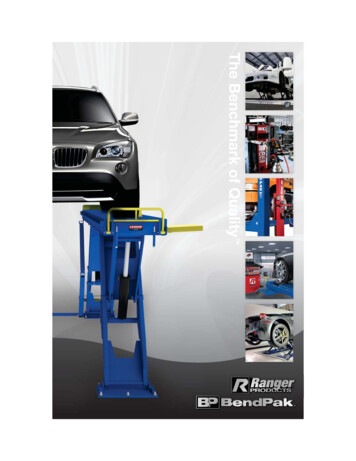
Top-Performer AnalysisStaffing Metrics ComparisonTop-performing finance shared services have significantlybetter staffing ratiosn Two times more efficient overallInvoice customern Nearly three times more efficient in staffing majorfinance processesPerform general accountingMedian number of finance function FTEsacross the entire organization per 1 billion revenue1009080706050403020100Manage treasury operations2.0XProcess accounts payable (AP)42.2Top-Performer GroupManage internal controlsComparison Group11.34.18.03.111.0Manage taxesProcess accounts receivable (AR)86.3Median number of FTEs thatperform the following processesper 1 billion 2.50.60.36.73.85.93.93.83.2Comparison GroupTop-Performer GroupCopyright 2020 by ScottMadden, Inc. All rights reserved.10
Top-Performer AnalysisCost Metrics ComparisonTop-performing organizations operate at a larger cost advantage as well as in their finance sharedservices centers.Median total cost to perform the financefunction per 1,000 revenueMedian total cost to operate the sharedservices center(s) per 1,000 revenue 16 16 14 14 12 12.83 10 101.8X 8 8 6 12 6 6.94 4 4 2 2 0 0Top-Performer GroupComparison Group2.0X 4.21 2.08Top-Performer GroupComparison GroupCopyright 2020 by ScottMadden, Inc. All rights reserved.11
Top-Performer AnalysisCharacteristics of Top Performers: Governance and StructureTop-performing SSCs typically leverage theglobal process owner role for global processgovernance.What governance models does your SSC use inany capacity for global process governance?Top-performing SSCs in our study show moreevidence of being part of multifunction models.To whom does your shared services center report?74%49%60%47%54% 49%56%61%1%Globalprocess ownerProcesscouncilSharedService levelservices or agreementsGBS board of(SLAs)directorsTop-Performer GroupFinance executiveMultifunction shared servicesexecutiveMatrixed between finance andmultifunction shared servicesexecutivesNon-finance executiveOtherComparison Group72%0% 0%Other26%9%18%10%Top-Performer Group Comparison GroupCopyright 2020 by ScottMadden, Inc. All rights reserved.12
Top-Performer AnalysisSummaryn Why strive for top performance?– Significantly better staffing ratios– Larger cost advantage– Higher productivityn While not conclusive, top performers across key metrics show these characteristics:– Are from larger organizations– Show broader global coverage– Are more often part of multifunction shared services organizations– Leverage GPO role and SLAs for global process governance– Have dedicated finance employees to handle inquiries and thus show higher first contact resolutionrates– Have greater E2E process adoption– Deliver high-value services through more centralized models– Use technologies and advanced analytics to further enable SSCsCopyright 2020 by ScottMadden, Inc. All rights reserved.13
Want to Learn More?The benchmarking study is open for participation through December 2020n Access this study through this link to receive a customized participant report from APQC– https://www.apqc.org/SMaddenFMSSO2020If you’d like to learn more about how ScottMadden can help you optimize yourFinance Shared Services delivery model or if you are interested in a custombenchmarking assessment of your organization, please contact us.Copyright 2020 by ScottMadden, Inc. All rights reserved.14
Process accounts payable, 58% Process accounts receivable, 51% Manage and process collections, 25% Which of the following processes . The benchmarking study is open for participation through December