Transcription
QLIKVIEW SCALABILITY OVERVIEWQlikView Technology White Paper SeriesApril 2011www.qlikview.com
Table of ContentsIntroduction3The 4 Dimensions of QlikView Scalability4Size of Data4Number of Users11Number of Applications15Application Design20Why Architecture Matters to Scalability23The QlikView Scalability Center & Best Practices25Conclusion37 Page 2
IntroductionAs the needs increase to deploy a system to larger numbers of users, containing larger volumesof data and larger numbers of applications, often in different geographies, scalability becomesincreasingly important.QlikView’s performancescales uniformly withdata and users.QlikView scales uniformlyas more data is added tothe application and moreusers access the application.Terabytes of data havebeen addressed in QlikViewand many thousands ofconcurrent users havebeen shown to repeatedlyaccess deployments withoutinterruption of service.When planning a QlikView deployment for either the first time or an expansion to an existingdeployment, a key question always arises: what machines do I buy and when? The answer tothis question can be very simple or quite complex depending on a range of considerations, chiefamong them are: The size and nature of source data.The number of concurrent users.The way that data and applications are organized in a QlikView deployment.GUI design and overall application design.These 4 general areas – Size of DataNumber of UsersNumber of ApplicationsApplication Designare the driving dimensions through which we will discuss QlikView’s ability to scale.We will discuss the challenges associated with each dimension, the approach QlikViewrecommends and some real-life examples from our customer community.This paper outlines the technical capabilities, real-world examples and the trade-offs associatedwith understanding the predictable and proportional response of a QlikView deployment to thechallenges associated with scalability.We will define scalability as “the ability to retain performance levels when adding additional data,users, and applications and when changing the applications’ designs.”This paper will examine scalability from an end-user’s perspective (i.e. end-user performance)rather than a server-side data reload perspective.We will also take a look at Scalability Center results that examine whether QlikView scalespredictably under typical usage scenarios and will examine QlikView’s response to commondeployment scalability factors.It is recommended to review the QlikView Architecture and System Resource Usage TechnicalBrief in order to get a fundamental understanding of the various QlikView components and howthey utilize various hardware resources such as RAM and CPU. Page 3
The Four Dimensions of QlikView ScalabilitySIZE OF DATA:It’s a well known fact that the data volumes organizations are generating are increasing at arapid pace. This is no different in Business Intelligence (BI). Even as volumes increase, thereis an increased demand on BI systems to continue to provide end users with a high performingand predictable experience. For traditional query-based solutions, this has resulted in a push forfaster and more expensive database query acceleration technology, with mixed results. For newtechnology solutions that use an in-memory solution like QlikView, it’s particularly important tounderstand the system’s reliance on Random Access Memory (RAM) resources.THE QLIKVIEW APPROACH:Fundamentally, it’s important to note that QlikView’s performance scales uniformly withdata loads. As more data is added to a QlikView application, then a corresponding addition ofa combination of RAM and CPU capacity allows end-user performance to be maintained in apredictable fashion.QlikView relies heavily on RAM due to its in-memory architecture. Please refer to the QlikViewArchitecture and System Resource Usage Tech Brief which takes a close look at the role thatRAM plays in a QlikView deployment.Let’s take a look at the importance of considering adding both RAM and CPU capacity in orderto maintain end-user performance when data sizes increase.As an in-memory based technology, as more data is added to an application it’s pretty obviouswhy more RAM capacity will be needed in order to maintain performance levels. Even thoughQlikView will utilize the operating system’s virtual memory capability (i.e. using the hard driveto ‘act’ as RAM), the performance degradation associated with this option may result in anunacceptable user experience. QlikView takes advantage of the fact that RAM costs arecontinuously being driven lower, so adding more RAM capacity owing to an increase in datavolumes requires a relatively small capital outlay. QlikView also employs a sophisticated datacompression algorithm (as outlined in the QlikView Architecture and System Resource UsageTech Brief) to allow for an extremely efficient usage of available RAM resources for dataanalysis. Compression ratios can range from 20% to 90%, depending on the nature of the databeing compressed.It may be less obvious why CPU capacity must be considered when scaling up data. Asstated in the QlikView Architecture and System Resource Usage Tech Brief, CPU cycles areused whenever a user interacts with a QlikView application. For example, whenever a chart isrecalculated or whenever a new aggregation is requested, CPU cycles are consumed. For anygiven application, the amount of time needed to respond to an end-user request is a functionof the CPU’s ability to process the request, perform a recalculation on the data and redraw theUI. Therefore, as more data is added to an application and in cases where a new aggregation Page 4
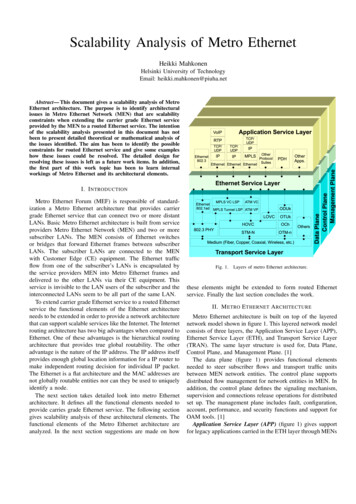
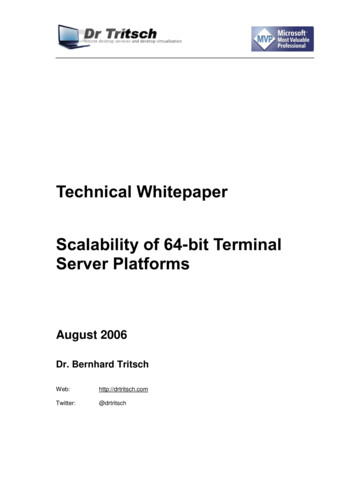
needs to be performed, the CPU will be required to perform recalculations over larger slices ofdata, resulting in more required CPU cycles.Figure 1 below highlights that as more data is added to an application, a uniform increasein both CPU and RAM capacity will ensure that performance levels are maintained to anacceptable level.End User Performance scales uniformlywith CPU capacity and number of usersPEnd User Performance scales uniformlywith RAM and number of usersPCPU#usersRAM#usersFigure 1As will be seen from the section on application design, understanding the performancecharacteristics of any general QlikView application does not follow a simple formulaic approach,and as such one cannot simply state the ‘upper limit’ for the amount of data that QlikView canhandle.However, experience of many deployments has allowed us to provide a rough calculationof the RAM needed for a given source data size and expected usage numbers. Please notethat this calculation should be treated as a generalized, averaged estimation for the purposeof illustration.RAM (RAMuser No. users) RAMinitialWhereRAM〗initial QVWsizedisk FileSizeMultiplier; this is the initial RAM footprint for any applicationRAM〗user 〖RAMinitial userRAMratio; this is the RAM each incremental user consumesQVWsizedisk SourceData (1 - CompressionRatio); this is the size, on disk, of aQlikView fileAssumptions:userRAMratio: range between 1%–10%FileSizeMultiplier: range between 2–10CompressionRatio: range between 20%–90% Page 5
No. users is the number of concurrent users hitting a system, not the total number of supportedusers. ultiplier4userRAMratio5%No. of concurrent users30QVWsizedisk 50GB (1 - 0.9) 5GBRAMinitial 5GB 4 20GBRAMuser 20GB 5% 1GBTherefore, the RAM footprint to support 30 concurrent users in this deployment would be:RAM (1GB 30) 20GB 50GBA more pragmatic approach is to understand the best practices techniques for using the variousQlikView platform components to provide for a very large data size addressing while maintainingvery fast user response characteristics. These techniques are detailed below:LINEAR SCALING FROM A KNOWN DATA MODEL AND UI DESIGN:A best practice approach to understanding how much additional hardware resources maybe needed for any specific deployment when new data (and user numbers) are added toan application is to first measure the performance characteristics from a small deploymentwith a known, stable data model and a production-level User Interface. In most deploymentswhere QlikView applications have expanded to accommodate very large data sets and/or userpopulations, the performance characteristics from the initial, smaller-scale deployment wereexamined as a ‘benchmark’ from which to extrapolate the data to determine the hardwarerequirements for larger deployments. This method has proven to be very successful andaccurate. In every case, these deployments have shown to scale linearly with additional data(and user) loads. At a very simplified level, the steps are outlined below:1.Measure the performance characteristics of a small deployment (i.e. measure end-userresponse times to new aggregation requests or new search paths).2. Record the CPU and RAM usage in this environment.3. Perform a linear extrapolation using the expected additional data and/or user loading onthe application to determine needed additional RAM and CPU capacity. Page 6
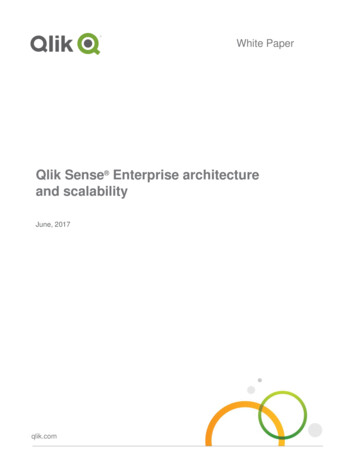
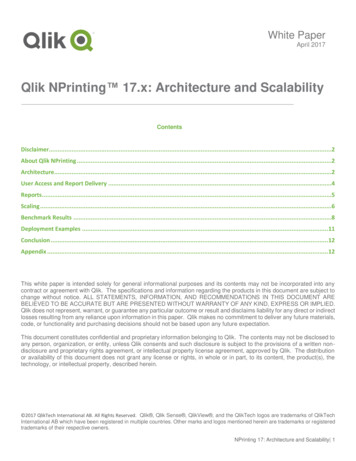
INTELLIGENT DISTRIBUTION OF DATA: HORIZONTAL SCALING:When it comes to handling expanding volumes of data, a best practices approach to breakingup and distributing data is preferable to trying to utilize a single QlikView application to store andanalyze all data. Take the example of worldwide sales data: for a small company it might makesense to use just one QlikView application to analyze and present data from every country itdoes business in. However, for larger organizations this approach is impractical due to largerdata volumes and larger number of users.In these environments the QlikView Publisher product is used to take a source application (e.g.worldwide sales) and break it up into smaller applications (e.g. country-specific applications)which contain smaller data footprints. These ‘reduced’ applications are then accessed usingclients via a QlikView Server.Horizontal scaling refers to adding more server resources, either virtually or physically, to adeployment. QlikView Server deployments scale horizontally in a straightforward manner byadding new server machines and implementing a clustering and load balancing strategy. Inthe scenario depicted below in figure 2, one might have a single QlikView Server dedicated toeach department, and each containing the relevant business applications pertinent to all groupswithin that department.Using a horizontal scaling strategy in this way, end-user performance can be maintained orimproved while scaling up to very large data needed for analysis.AjaxQlikView Access PointQVS: OperationsQVS: FinanceFin ops.qvw300MM rowsFin AP.qvw30MM rowsOPS sales.qvw50MM rowsOPS mktg.qvw120MM rowsOPS Spend.qvw100MM rowsOPS Inventory.qvw80MM rowsFront EndBack EndQlikViewDeveloperCompanyData.qvw680MM rowsQlikView PublisherFigure 2 Page 7
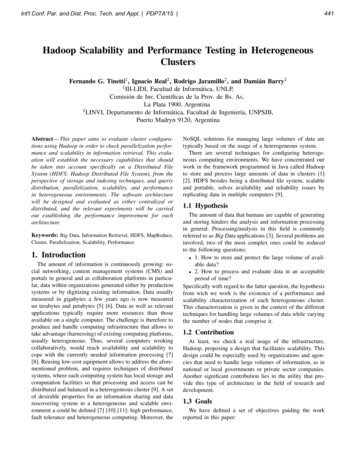
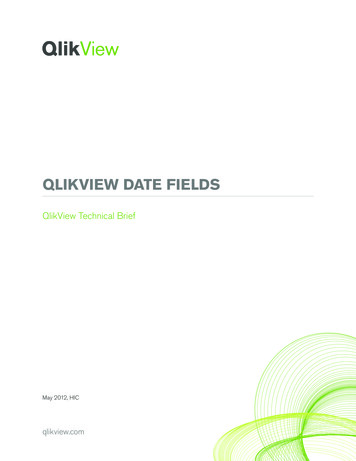
In addition, QlikView deployments support the notion of a multi-staged data architectureapproach. This approach, when coupled with a horizontal scaling strategy is an effective meansby which to scale up to many billions of rows of data, and beyond, while maintaining acceptableend user performance characteristics.Extract LayerERPQlikview applications thatextract and (optionally)denormalize source tablesinto Qlikview QVD files.QVD Files- QlikView data filelayer. QVDs can be one-to-onematch with source tables ordenormalized “views” ofseveral source tables.QVD GeneratorQVD FilesPresentation LayerDATABASEDataWarehouseDatabases and otherdata sourcesQVD LayerSource LayerFigure 3 shows an example of a staged data architecture in QlikView. When combined, thetotal data being addressed by QlikView in this scenario might run into many billions of rows ofdata, however by employing a ‘staged’ approach to handling the data, and coupling it with ahorizontal scaling approach, reliable end-user performance can be maintained.Production applications builtfrom QVDs in the layer above.No direct database queriesare needed in these applicationsand re-use of common QVDsis promoted. Some understandingof data is still required tooptimize application performance.QVD GeneratorQVD FilesQVD GeneratorQVD GeneratorQVD FilesQVD FilesAnalysis AppAnalysis AppDashboardDashboardFigure 3SCALING ‘UP’: VERTICAL SCALING:Vertical scaling refers to the approach whereby more hardware resources (i.e. CPU and RAM)are added to the same machine to accommodate an increase in data and users.Vertical scaling is a relatively more straightforward task than horizontal scaling (this documentis not intended as a discussion of the merits of both), however QlikView deployments can takeadvantage of a vertical scaling of RAM and CPU capacity in a single machine to accommodatelarger volumes of data. Again, this is a linear and predictable relationship: as more data is Page 8
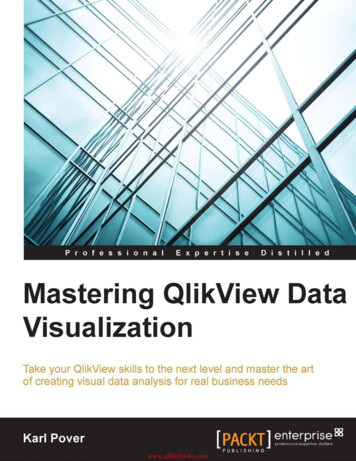
added to an application, end user performance is maintained by the linear addition of RAM andCPU capacity to the machine.INTELLIGENT LOADING OF DATA: INCREMENTAL RELOADS:An effective strategy for dealing with increasing volumes of data is to employ incrementalreloads. While this topic is more pertinent for a discussion on data modeling strategies ratherthan end-user scalability, it’s worth mentioning here briefly as it highlights an importantcharacteristic of actual deployed QlikView applications.Incremental loads are when QlikView will only load - from source data - the newest data orlatest transactions. These can be performed as part of the regularly scheduled reload processand are used as part of a multi-staged data environment that utilizes QVD files. The benefit ofusing incremental reloads is that data can be added to any given application far more quickly,limiting the amount of time needed for data refresh, thus providing end users with much quickeraccess to the latest data.Incremental data loading250MB200MB500MBT 0T 1T 2All data loaded (500MB)All data loaded: 200MBAll data loaded: 250MBData Analyzed: 500MBData Analyzed: 700MBData Analyzed: 950MBFigure 4TECHNICAL CASE STUDY: LARGE APPAREL RETAILER, 70GB OF DATA:When a large apparel retailer in the US Midwest needed a high performing, scalable businessdiscovery platform, they selected QlikView. As a multi-channel retailer involved in bothdesigning and selling men’s and women’s apparel, this company serves markets in multiplecountries around the world, generating revenues in the many billions of dollars. Like manysimilar organizations, this company was challenged with their existing traditional businessintelligence tools, growing frustrated with the lack of flexibility and the slow time-to-responsefrom the business user’s requests for new reports and fresh analysis.The company chose QlikView to empower over 200 concurrent business users in inventoryplanning and forecasting to gain access to the over 500 million rows of data that simplifies theirdecision-making process. Page 9
Using a multi-tiered approach to their deployment architecture, QlikView Publisher resideswithin a secure back end and is responsible for taking 15 source qvw files to perform nightlyreloads of data, total size of 70GB, from a variety of source databases including DB/2,Microsoft Excel and Oracle. Average nightly reload time is 4 hours. This is the beginning of the‘staged data’ environment, where 5 qvd files of sizes varying 250MB to 60GB are created asintermediate data file stores. These files include data broken down by functional area and actas secure binary repositories from which the end user documents within the presentation layerextract data. The presentation layer is where the QlikView Servers reside. In this deployment,4 QVS’s were deployed in a clustered environment on 4 machines, 3 with 64 CPU cores and256GB of RAM, and one with 32 CPU cores and 128GB of RAM, each running WindowsServer 2003.This company also engineered the capability to interface the mainframe scheduler into theQlikView Publisher so that in effect the mainframe scheduler triggered QlikView tasks based onfile availability on the mainframe.64 Core, 256GB RAM; Win 200364 Core, 256GB RAM; Win 200332 Core, 128GB RAM; Win 200364 Core, 128GB RAM; Win ermediate datafile store (QVD Layer)Source and rdReportDashboard5 QVD’sTotal 60GB15 QVW’sTotal 70GBQlikView Publisher4 hours, nightlyFigure 5 Page 10
Number of UsersAs companies grow, the demands on all IT infrastructure assets increase as a result of morepeople needing access to IT applications and resources. QlikView applications are no different.Not only have we seen increased user demand on deployed applications because of companygrowth, we’ve also seen significant demand increases as adoption of a QlikView solution takeshold within an organization.IT departments are tasked with understanding the scaling characteristics of their applicationsand need to know that their vendors’ solutions will respond predictably and proportionally toincreases in hardware resources to accommodate the new demand.THE QLIKVIEW APPROACH:Fundamentally, it’s important to note that QlikView’s performance scales uniformly withuser loads.As has been seen with all deployments, as new users are added to an existing system, theperformance impact is predicable and proportional and can be addressed by the additionof more resources such as CPU capacity and RAM.As was stated in the preceding section on data scaling, it’s important to understand the impactthat adding both CPU capacity and RAM will have in order to maintain optimal end-userperformance as more concurrent users stress the system.Again, QlikView utilizes an in-memory data store in which all data that is analyzed in any givenQlikView session will reside. As noted in the QlikView Architecture and System Resource UsageTech Brief and in the RAM calculator in the Size of Data section in this paper, when the firstend user opens a QlikView document, the amount of RAM needed is usually between 2x – 10xthe size of the application on disk. This is to accommodate overhead such as indexes, dataassociations and so on. The addition of concurrent users causes more RAM to be allocated. Eventhough core aggregations are shared across all users by means of a central cache, each individualuser requires his/her own session state, which requires additional RAM to be allocated.As was seen in the QlikView Architecture and System Resource Usage Tech Brief and in theRAM calculator in the Size of Data section in this paper, a general rule of thumb can be usedfor estimating the per-user additional overhead associated with new concurrent users (i.e. add1-10% of RAM above that used by the first user).For example: A 1GB .qvw document uses around 4GB in RAM for the first user(based on a multiplier factor of 4). User number two may increase this by around10% as their calculations get cached, resulting in a required RAM footprint of4.4GB. User number 3 requires a further 10%, increasing the footprint to 4.8GB,and so on. Page 11
As is discussed in the QlikView Architecture and System Resource Usage Tech Brief andalso in the later section on Application Design in this paper, it’s important to note thatthe density of the data and the data model structure, along with the UI design contributesignificantly in the determination of the overall RAM footprintIn summary, a properly designed QlikView application will not take up more than 1% to 10%of the RAM usage for each additional user after the first.CPU capacity needs to also be considered when expecting an increase is concurrent userloading. As stated previously in the QlikView Architecture and System Resource Usage TechBrief, CPU cycles are used whenever a user makes a request in the application for a newaggregation, new drill-down path, redraw of the UI based on
sense to use just one QlikView application to analyze and present data from every country it does business in. However, for larger organizations this approach is impractical due to larger data volumes and larger number of users. In these