Transcription
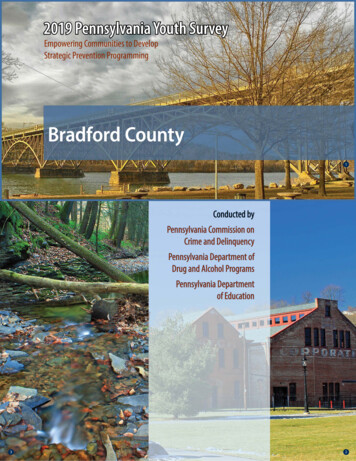
2019 Pennsylvania Youth SurveyEmpowering Communities to DevelopStrategic Prevention ProgrammingBradford County1Conducted byPennsylvania Commission onCrime and DelinquencyPennsylvania Department ofDrug and Alcohol ProgramsPennsylvania Departmentof Education32
Funding provided byAbout the cover photographs:1. Strawberry Mansion Bridge in Philadelphia.Credit: Smallbones / CC02. Talleyrand Park (Revisited) (8). Borough of Bellefonte, Centre CountyCredit: Nicholas A. Tonelli3. Glade Run (Revisited) (2). State Game Land 325, Northumberland CountyCredit: Nicholas A. Tonelli
ACKNOWLEDGMENTSThe Pennsylvania Commission on Crime and Delinquency (PCCD), the Pennsylvania Department of Drug andAlcohol Programs (DDAP), and the Pennsylvania Department of Education (PDE) would like to thank BachHarrison, L.L.C. and Dr. Rose Baker of the Prevention Research Center at The Pennsylvania State University fortheir contributions and guidance during the administration of the 2019 Pennsylvania Youth Survey (PAYS).Additionally, a great deal of thanks for the leadership of this survey needs to go to the PCCD PreventionSubcommittee, who provided guidance and oversight to this effort.The administration of the survey would not have been a success without the contributions of PAYS AdvisoryGroup (PAYSAG), whose tireless efforts and ideas helped make this year’s PAYS the most widely administeredsurvey since Pennsylvania has been administering the tool. The 2019 PAYSAG members included:Meghan Blevins, EPISCenterMichelle Nutter, Office of the Pennsylvania Attorney GeneralKelly Brown, Family Services of Montgomery CountyKathy Peffer, Lower Dauphin CTCChristy Unger, Healthy Communities PartnershipStephen Muccioli, DOHJeff Hanley, Commonwealth Prevention AllianceStephanie Roy, CPSEL (Center for the Promotion of SocialEmotional Learning)Justine Hinckley, DHS – BJJSGrace Kindt, DDAPTom Stark, Pennsylvania Association of County Drug andAlcohol AdministratorsGeoff Kolchin, PCCD – OJJDPLisa Sviben Miller, PASAP/Derry Township School DistrictPhyllis Law, EPISCenterPerri Rosen, DHS – OMHSASJoe Loccisano, PDE – Office of Safe SchoolsTammy Taylor, Washington County D&ASharron Michels, Adams County Collaborating for YouthChristy Unger, Healthy Communities Partnership of FranklinCountyZoe Miner, PCCDVanessa Wilder, DDAPThe success of the 2019 PAYS could not have been achieved without the support and participation of schoolsuperintendents, administrators, principals, prevention coordinators, and teachers throughout the state. Weextend our appreciation to the students who responded to the survey. Their thoughtful participation resultedin a wealth of information that can be used to improve the circumstances in which they live and learn.Please note that this report does not contain data from all survey questions. To access and analyze countyor state level data from the entire survey dataset, please visit www.bach-harrison.com/PAYSWebTool. Formore information about PAYS, and to see aggregate reporting of responses provided by Pennsylvania youth,please visit www.pays.pa.gov. This site contains links to materials developed for the 2019 administration, aswell as materials from prior survey administrations. Results from earlier PAYS administrations (e.g. reportsfrom 2017 and earlier) can be found by consulting the links to past years’ reports.
TABLE OF CONTENTSAcknowledgments3PAYS: Goals and Overview1. Demographics582. ATOD Use and Access10High prevalence/early initiation drugs 12Prescription and over-the-counter drugs and medicationsOther drugs 22Risky substance use-related behaviors 27Access and willingness to use 293. Antisocial Behavior1835Gambling 36Other antisocial behavior394. Community and School Climate and Safety41Commitment to school 42Involvement in pro-social activities 45Violence/drugs on school property 47Bullying and Internet safety 495. Social and Emotional Health58Mental health concerns and suicide risk 59Depression and substance use 62Bullying and depression/suicide 63Transitions and mobility, sleep, grief, and other stressful events6. Systemic Factors68Perception of risk 69Perception of parental disapproval 71Perception of peer disapproval 73Attitudes toward peer use 75Community risk associated with availabilityRules and antisocial behavior 80Favorable attitudes toward drug use 827. Risk and Protective Factors7784Risk and protective scales defined 86Understanding cut-points 93Overall risk and protective scores 95Risk and protective factors by grade 978. The Social Development Strategy 1071108APPENDIX A. Drug Free Communities Data 1091APPENDIX B. Survey Methodology1101APPENDIX C. For More Information 1121APPENDIX D. Schools and Districts in this report 114411111364
PAYS: GOALS AND OVERVIEWSince 1989, The Commonwealth of Pennsylvania has conducted a biennial survey of youth in the 6th, 8th,10th, and 12th grades to gather information about their knowledge, attitudes, and behaviors towardsalcohol, tobacco, and other drug use to help communities address root causes of antisocial behavior.The “Pennsylvania Youth Survey” or “PAYS” is conduct- to assist students. The questions also helped every other year, in the fall of odd-numbered years. determine where potential problems may existBeginning with the 2013 administration, PAYS was offered outside of school that can have an impact on aat no charge to any school or district (public, private, student’s readiness to learn when they arrive atcharter, and parochial) courtesy of funding provided by their school each morning. This includes questhe Pennsylvania Commission on Crime and Delinquency tions on food security, housing instability, and(PCCD), the Pennsylvania Department of Drug and Alcohol the loss of a close family member or friend.Programs (DDAP), and the Pennsylvania Department ofEducation (PDE).PAYS is administered in each participatingschool using either paper/pencil or an onlineThe 2019 PAYS was the fifteenth biennial administration tool. The survey is voluntary – youth are able to(1989-2019). Comparisons in this report were made skip any questions they do not wish to answerbetween the results of the 2015, 2017, and 2019 surveys, as or to opt out of the survey entirely. Additionally,well as comparisons to youth nationwide.students are made aware that their responseswill remain anonymous and confidential. NoOver the last several survey administrations, PAYS has individual student-level data can be obtainedadded additional questions about problem behaviors based from the data set, and the results are reportedon areas of interest to state and local leaders. These include in aggregate at the local, county, and state levels.questions on illegal prescription drug use, vaping ande-cigarette use, gambling, depression and suicidal ideation, PAYS is a primary tool in Pennsylvania’sviolence on school property, causes and effects of bullying prevention approach of using data to driveand abuse (physical and online), Internet safety, transitions decision making. By looking not just at rates ofand mobility, and involvement in after-school activities in the problem behaviors but also at the root causescommunity or workplace. After each survey administration, of those behaviors, PAYS allows schools andPennsylvania stakeholders review the survey instrument to communities to address reasons (such as a lackdetermine if there are additional areas of importance that of commitment to school) rather than onlyshould be included in the next cycle or if some items have looking at the symptoms after the fact (likeoutlived their value and should be removed.poor grades). This approach has been repeatedly shown in national research studies to beQuestions are asked across four domains (community, the most effective in helping youth develop intoschool, family, and peer/individual) to help determine where healthy, productive members of their society.5the strengths of a community are, which can be promoted
PAYS 2019 PAYS: Goals and OverviewThis means that the 2,052 valid surveysThe 2019 PAYS was administered during the fall of 2019 submitted from this county resulted in ato youth in grades 6, 8, 10, and 12, resulting in 279,945 modified participation rate of 72.6% (as seenvalid surveys. Community-level summary reports were in the second table).issued to more than 400 school districts and counties.Statewide, the 1,890 schools eligible to particThere were 1,135 schools that chose to participate in the ipate in the 2019 PAYS had an estimated2019 PAYS (out of 1,890 eligible). Estimated enrollment enrollment of 516,562 public school studentsfigures for the 2018-19 school year show that participat- in grades 6, 8, 10, and 12. The 279,945 validing schools had 377,469 students enrolled in grades 6, 8, surveys submitted resulted in a modified10, and 12 who were eligible to participate in the survey. participation rate of 54.2% statewide.Participation by Pennsylvania youthAn attempt was made to survey all eligible Pennsylvaniastudents, resulting in 279,945 valid participants in Sample Confidence Intervalsgrades 6, 8, 10, and 12 (a participation rate of 74.2%), When reviewing survey results people oftenrepresented evenly across the state.ask, “What is the margin of error?” This isCounty 2019State 2019referred to as the “confidence interval,” and itEnrolled inEnrolled ects the precision of a statistical estimate.GradeFor example, the overall statewide ,69493,42584.2interval for drug use with a prevalence rate1049457086.771,61999,11272.3of 50.0% is 0.8 points, meaning that there 79,945377,46974.2a 95% chance that the true score is between* Enrollment in the this table refers to the number of students enrolled in participating schools.In this county, 12 out of 16 schools (in 6 of 7 districts) 49.2% and 50.8%.participated in the 2019 PAYS. 2018-19 enrollmentshow that of the 2,494 students in grades 6, 8, 10, and12 enrolled in participating schools, 2,052 valid surveyswere submitted (a participation rate of 82.3%).County 2019Enrolled inall schools(s)**SurveysState 2019Modifiedparticipationrate**SurveysEnrolled inall 0StatewideSample †Enrollment forStatewide Sample †ConfidenceIntervalGrade67,75781012Total111,573 1.68,780111,192 1.57,506114,705 1.66,629111,659 1.730,672449,129 0.8† Information on the design of statewide sample can be found in the 2017 and 2019 PAYS Statereports.Note that these confidence intervals are forprevalence rates of 50%. For less prevalentTotal2,0522,82872.6279,945516,56254.2** Enrollment in the second table refers to the number of students enrolled in all schools in the district, county orbehaviors, such as heroin use and bringingcommunity that were eligible to participate in 2019 PAYS, even if they did not participate.Enrollment figures for all 16 schools in this county a weapon to school, the confidence intervalshow that 2,828 students in grades 6, 8, 10, and 12 were narrows substantially.eligible to participate in the 2019 PAYS 8463.558,863126,17546.74 30 2020
PAYS 2019 PAYS: Goals and OverviewValidity of PAYS dataPAYS analysisIn order to ensure the highest level of confidence inthe survey results, measures are implemented to retainonly those surveys that are deemed to be most honestand to remove surveys determined to contain possibledishonest or exaggerated responses. Dishonest surveyswere identified using five validity checks:The analysis of survey results for students ingrades 6, 8, 10, and 12 provides critical information regarding (a) the changes in patternsof the use and abuse of harmful substancesand behaviors; and, (b) risk factors that arerelated to these behaviors and the protectivefactors that help guard against them. Usingthe results, school administrators, state agencydirectors, legislators, and other communityleaders can direct prevention resources toareas where they are likely to have the greatestimpact. PAYS data are used to inform parents,school districts, and agencies serving youthon development of protective factors andare aligned with evidenced-based programs,which may support youth during transitiontimes in their development. DDAP has usedcounty-level PAYS data to identify areas ofhigher need for prevention initiatives and tofund proposals responding to DDAP grantfunding announcements.1. the student indicated that they had used a fictitiousdrug (statewide, 3,497 surveys were identified asdishonest with this check)2. the student reported an improbably high level ofmultiple drug use (2,524 surveys statewide)3. the student indicated past-month use rates thatwere higher than lifetime use rates (1,654 surveys)4. the student reported an age that was inconsistentwith their grade or the grades served by theirschool (1,622 surveys)5. the student reported an age for joining a gang thatwas older than their reported age (468 surveys)PAYS survey instrument and reporting weredesigned to further the mission and vision ofPCCD. The mission is to enhance the qualityof criminal and juvenile justice systems,facilitate the delivery of services to victimsof crime, and assist communities to developand implement strategies to reduce crime andThe results within this county report are based on 2,052 victimization. The vision of the PCCD is to bea state and national leader by providing innohonest responses (out of 2,097 surveys submitted).vative services and programs that promotejustice for all citizens and communities ofPennsylvania.Dishonest and incomplete surveys were eliminatedfrom the data and are not included in the final analyses.Of the 288,450 survey questionnaires from grades 6, 8,10, and 12 completed and returned to Bach Harrisonfor analysis, 6,818 (2.3%) were eliminated for meetingone or more of the above criteria.7
1. DEMOGRAPHICS48.7% of participants were female, and 51.3% were male. 10th graders were the bestrepresented, with an estimated 86.7% participation rate based on most recent enrollment.Overall, 84.3% of students surveyed in this county were white or Caucasian, 3.8% of students weremulti-racial, and the remainder were a combination of the remaining categories. 5.0% of students identified as being of Hispanic, Latino, or Spanish origin.Grade-level data are only displayed in this report when there were a minimum of 25 valid participants.“All Grades” represents the combined responses of all participating students from grades 6, 8, 10, and 12.Please note the distribution of participants in “All Grades” data for this county and keep this in mind whencomparing local data to state data. State-level “All Grades” data are most useful when the county data areavailable for all four grades, meet the minimum cutoff for the total number of participants, and have asimilar distribution of participants to the state.County 2015NumberPercentCounty 2017NumberPercentCounty 2019NumberPercentState 2019NumberPercentSurvey 648.7136,96149.8Survey respondents by gradeSurvey respondents by genderSurvey respondents by ethnicityYes, of Hispanic, Latino, or Spanish 1,95095.0239,31685.5Black, African American391.7261.4311.526,1849.4American Indian723.2392.1703.44,3031.5Asian/Pacific 9706.1Race Unmarked763.4713.91105.420,7547.4No, not of Hispanic, Latino, or Spanish originSurvey respondents by raceWhite, CaucasianPlease note that this county does not meet the minimum cutoff for all four grades surveyed (6, 8, 10, and 12).It is important to exercise discretion when comparing “All Grades” data from Bradford County to state-level“All Grades” data.84 30 2020
PAYS 2019 DemographicsPAYS 2019 category:Demographic questionsPAYS 2019 question text:How old are you?10 / 11 / 12 / 13 / 14 / 15 / 16 / 17 / 18 / 19 or olderWhat grade are you in?6th / 7th / 8th / 9th / 10th / 11th / 12thAre you of Hispanic, Latino, or Spanish origin?No, not of Hispanic, Latino, or Spanish originYes, Mexican, Mexican Am., ChicanoYes, Puerto RicanYes, CubanYes, another Hispanic, Latino, or Spanish origin (for example,Argentinean, Columbian, Dominican, Nicaraguan, Salvadoran,Spaniard, etc.)What is your race? (Select all that apply)White, CaucasianBlack, African AmericanAmerican Indian or Alaska NativeAsian Indian, Japanese, Native Hawaiian, Chinese, Korean,Guamanian or Chamorro, Filipino, Vietnamese, Samoan, OtherAsian, Other Pacific IslanderAre you male or female?Think of where you live most of the time. Which of thefollowing people live there with you? (Choose all that apply)Mother / Stepmother / Foster mother / Grandmother / Aunt/ Father / Stepfather / Foster father / Grandfather / Uncle /Other adults / Older Brother(s) / Younger Brother(s) / OlderStepbrother(s) / Younger Stepbrother(s) / Older Sister(s) /Younger Sister(s) / Older Stepsister(s) / Younger Stepsister(s) /Other childrenWhat is the language you use most often at home?EnglishSpanishAnother language9
2. ATOD USE AND ACCESSMonitoring Alcohol, Tobacco, and Other Drug (ATOD) Trends in Pennsylvania YouthMeasurementAlcohol, tobacco, and other drug (ATOD) use andaccess is measured in PAYS by a set of 32 questions. Thequestions are similar to those used in the Monitoring theFuture study, a nationwide study of drug use by middleand high school students. Consequently, national dataas well as data from other similar surveys can easily becompared to data from PAYS.Prevalence–of–use tables and graphs show the percentages of students who reported using ATODs. Theseresults are presented for both lifetime and past 30-dayprevalence of use periods. Past 30-day prevalence of use(whether the student has used the drug within the lastmonth) is a good measure of current use. In addition tothe standard lifetime and past 30-day prevalence ratesfor alcohol use, binge drinking behavior (defined asconsuming five or more drinks in a row within the pasttwo weeks) is also measured.stimulants. Questions were added in 2015 toassess recreational use of over-the-counterdrugs and to assess the use of electronicvaping products such as e-cigarettes, e-cigars,e-pipes, vape pipes, vaping pens, e-hookahs,or hookah pens.Lifetime UseLifetime use is a measure of the percentage ofstudents who tried the particular substanceat least once in their lifetime and is used toshow the percentage of students who havehad experience with a particular substance.Lifetime prevalence of use (whether thestudent has ever used the drug) is a goodmeasure of student experimentation with agiven substance.30-Day UseThe survey also includes six questions designed tomeasure non-medical use of prescription drugs. The 30-day use (whether the student has recentlyquestions cover three general categories of non-medical used the drug) is a more sensitive measure ofprescription drug use: pain relievers, tranquilizers, and current activities.10
PAYS 2019 ATOD Use and AccessComparisons to National ResultsComparing and contrasting findings from a county– orschool–district–level survey to relevant data from anational survey provides a valuable perspective on localdata. In this report, national comparisons for ATOD usewill be made to the 2018 Monitoring the Future studyand to the 2018 Bach–Harrison Norm.contributions more in line with the nation’sstudent population. Bach Harrison analyststhen calculated rates for antisocial behavior,students at risk, and students with protection. The results appear on
Je Hanley, Commonwealth Prevention Alliance Justine Hinckley, DHS BJJS Grace Kindt, DDAP Geo Kolchin, PCCD OJJDP Phyllis Law, EPISCenter Joe Loccisano, PDE O ce of Safe Schools Sharron Michels, Adams County Collaborating for Youth Zoe Miner, PCCD Michelle Nutter, O ce of the Pen