Transcription
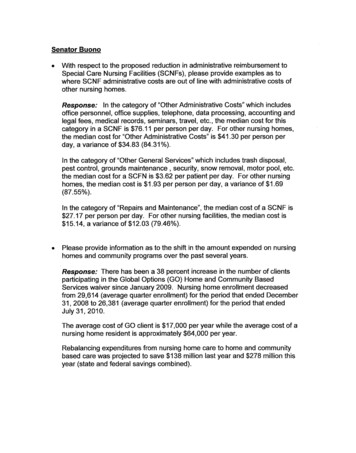
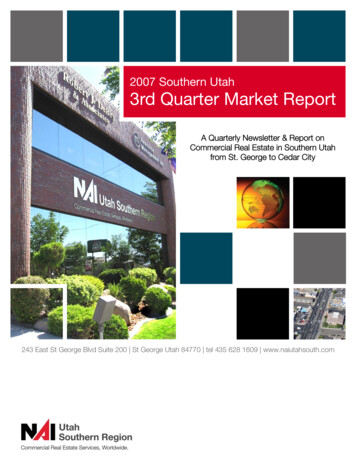
University ReportPRESIDENT ASTRID S. TUMINEZFEBRUARY 6, 2020
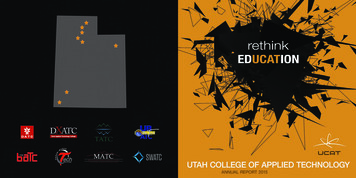
Dual-Mission Institutions
Dual-MissionUniversities in Utah UVU, WSU, DSU educatenearly 50% of all Utahnsenrolled in USHE In 2017-18, USHE’s dualmission universities awarded: 47.4% of all associate degrees 38.5% of all bachelor’s degrees
Impact of FY20 New FundsSTUDENT GROWTH: 1.7 MILLION14 Full-time Faculty InformationTechnologyComputer ScienceEnglishDigital MediaAviation ScienceCommunications pStatisticsPERFORMANCE BASED: 4.9 MILLIONCompletion/First-Year Advising Center—1Director and 7 Academic AdvisorsInstructional Support for Completion—7 fulltime faculty, 1 librarianNursing/Health Professions ProgramExpansion—4 full-time facultyDigital Transformation—5 staff, softwarelicensing, cybersecuritySafety, Compliance, Employee Development—5 staff, online training software
CelebratingSuccess:UVU meetseducational andworkforce needs inour service region.
Growth: UVU’s Great Opportunity 65% of UVU students are from UVU’sservice region — Utah, Summit, andWasatch counties. K-12 growth fuels UVU’s growth (20092018) By 2030, one in three new Utah residentsand one in four new jobs in Utah areprojected to be in UVU’s service region.
“COME AS YOU ARE. UVU HAS A PLACEFOR YOU!”
UVU maintains personalized instructionand provides many options for a diversestudent-body. 42,030 fall 2019 headcount23 student average class size11,637 concurrent enrollments11,542 online enrollments30 online programs5,342 hybrid enrollment
UVU Graduation Rate History(IPEDS—first-time, full-time, bachelor’s degree-seekingstudents completing within 6 years)UVU’s graduationrate has increased by7 percentage pointsin the most 32008-20142009-20152010-20162011-20172012-2018
dvising &SupportStackableCredentials ctices
8-Year Outcome Measure GraduationRate for All Students(Includes all degrees, part-time, transfer)38%40%37%36%Outcome Measure Rate32%30%OutcomeMeasure History20%10%45%0%2007-082008-092009-102010-11Full Year Entering CohortNote: Due to a change in IPEDS methodology, 2007 and 2008 cohorts reported in the IPEDS DataCenter are not comparable to the 2009-10 cohort. The 2007 and 2008 cohorts shown here havebeen recomputed using the 2009-10 cohort methodology.Goal by 2025
Meeting Workforce NeedsIn 2017-18, UVU saw an increase of 984 more awards in 4- and 5-starhigh market demand occupations417 certificates and associate’sdegrees in career/technicaleducationCTE grees,Certificates(compared to 2012-13)Workforce Needs
3.6 Million inGrants for STEM
AlpineWasatchNeboSouthSummitNorthSummitProvoPark City
DegreeArticulationsMaster of Science: CybersecurityBA Information Technology: Network Admin.AAS Information Technology TrackCertificate of Completion: Network AdministrationCertificate of Proficiency: Information TechnologyLADDERS TO SUCCESS
Transition from High School to UVU:K-16 Alliance Priorities1.By 2025, 90% of 3rd grade students will achieve grade-level proficiency inliteracy2.75% of students entering UVU from the service region will be collegemath ready3.Seamless transitions along K-16 pathway through increased counselorcommunication and K-16 educational road maps4.Establish and market a robust Career Pathways plan that includesstackable credentials developed in coordination with business andindustry5.90% of graduating seniors will apply to at least one college or universityand 80% of graduating seniors will apply for some form of financial aid.
ARTICULATIONSPROGRAMS1
“The commitment from both institutionsallows faculty to align program curriculumbetween the institutions, creating aseamless pathway for students. Thearticulated pathways enable students toachieve technical competencies at MTECHand then transfer to UVU without losingany time or credit toward their end degree.The articulated pathways serve our areaemployers by focusing on in-demand skillsand professional disciplines.”
Students with skills: SKILLS USA
UVU Vision 2030STRATEGY #1 – Enhancestudent success and acceleratecompletion of meaningfulcredentialsSTRATEGY #2 – Improveaccessibility, flexibility, andaffordability for all current andfuture UVU studentsSTRATEGY #3 – Strengthenpartnerships forcommunity, workforce, andeconomic development
Financial Aid VerificationPhase 1: College toAdmissionPhase 2: Admissionto End of First Year Payment Deadlines Transfer CreditsPhase 3: SecondYear to Graduation& BeyondStudent LifecycleELIMINATING BARRIERSTO STUDENT SUCCESS
CoordinatedAccess toResources &Education (CARE)www.uvu.edu/studentcare/
Since 2016: 11,344 students contacted 2,269 re-enrolled (Spring 2019) 409 credentials awarded 418,561 student aid awardedSOME COLLEGE,NO DEGREE
UndergradBaseFace ,0299,864Persistence77%76%70%81%25% mixed modality students in Fall 2019; 37% in Spring 2020.Digital Transformation is CriticalStudent Success
Enhanced Online Strategy7 New OnlineDegree Programs“Top 25” Focus
DIVERSITY ANDINCLUSION: LATINOSTUDENT INITIATIVE UVU has 4,911 Latinostudents Headcount growth of361% since 2007 Completion increaseof 372% since 2007 80% are firstgeneration
RACIAL/ETHNIC DIVERSITYClosing theOpportunity GapUtah County PopulationUVU Students20.0%18.2%18.0%18.0%16.0%15.8%From 2008 to 2018, UVU had a180% increase in students of colorwith a 224% increase in Hispanicstudents. Not only did enrollmentincrease, but UVU graduated 362%more students of 2018
AffordabilityandStewardshipAccountability toStudents, Taxpayers,and the Legislature
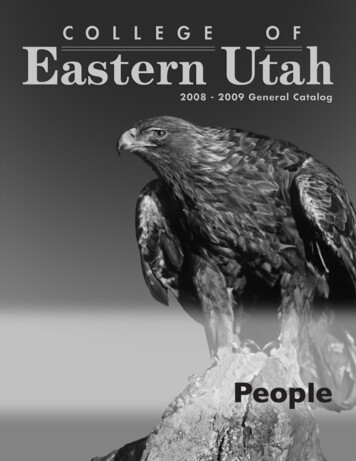
UVU Undergraduate Students Receiving Grant,Scholarship, or Reduced Tuition Rate, 2016-17AffordabilityNo grant,institutionalscholarship, orreduced tuitionrate, 32%Tuition sticker price is not the actual priceour students pay 46% of our students receive some form offinancial aid that does not need to berepaid Concurrent Enrollment students pay asteeply discounted tuition of only 5 percredit Based on this data, UVU’s estimateddiscounted tuition rate is 1,672(meaning average out-of-pocket tuitionpaid by UVU students)Concurrentenrollmentreduced tuitionrate ( 5 percredit), 22%Source: IPEDS and UVU Enrollment DataGrant orinstitutionalscholarship,46%
Debt at GraduationNationally, only 33% of students graduatewith 0 student debt.At UVU, 54% of Bachelor’s degreegraduates and 70% of Associate’s Degreegraduates leave with 0 student debt.
Value ofLocation(Affordabilityby anothername)Utah students tend toattend the institutionnearest them.76% of Utah Countynative students enrolledat a USHE institution,attend UVU (24,177students)Utah County UVUstudents want to live athome or nearby,reducing cost ofattendance beyondtuition (room andboard).Utah County’s vibranteconomy providesemploymentopportunities forstudents at all stages oflife, particularlyimportant for 24 percentof UVU students who are25 and older.Source: USHE Data Book and IPEDS
Literacies and CompositionTextbook Cost ReductionEnrollment ManagementServices Reallocation
Partnershipwith UTA10-year agreement providingfree UTA transit passes to allUVU students, employees,and their dependents,reducing the cost of travel torecipients and alleviatingparking constraints and coststo UVU.
UVU BudgetRequestWe need YOURhelp!
Compensation and Benefit Increases:BudgetPriorities 2.5% performance-based compensation 5% health premium increasesGrowth Funding (USHE 3.9M/UVU 2.3M): Faculty and staff to support enrollment growth Legislative action to formalize the growth-funding modelPerformance-Funding Priorities (USHE 34.9M/UVU 5.4M): Retention and completion analytics and interventions Flexible educational offerings for timely completion Engineering tech, information tech, and computer scienceprogram expansions Cybersecurity infrastructure
Faculty & Staff toSupport EnrollmentGrowth: 3,476,000Utah Resident FTE Student Growth 2018-19126205(combined Performance Funds &Growth)Faculty and staff to supportexpanded capacity in highdemand courses and programsto ensure students can beginand complete their programs ofstudy. In 2018-19, UVU servedover 50% of Utah ResidentStudent FTE growth.2351,077321UVUInclude Achieve45SUUWSUUSUUUDSU
Retention andCompletion Analyticsand Interventions: 1,226,300Outcomes Measure—Awards Granted WithinEight Years of Enrollment50%40%35%Remove barriers to persistenceand completion, leverage dataanalytics, and provide studentsupport interventions.Supports achievement of UVU’s2025 Outcomes Measure 10%5%0%2007-20152017-2025 Goal
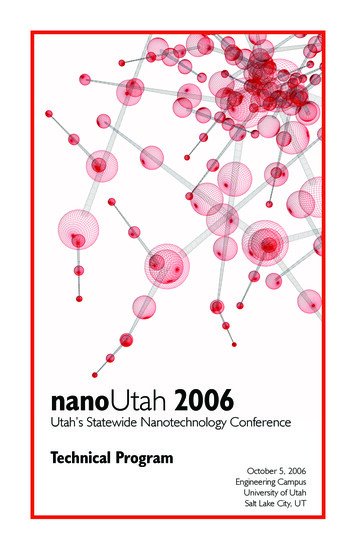
Flexible EducationalOfferings for TimelyCompletion: 1,195,000Fall Headcount by Instructional Modalities,2009 compared to 201845,00040,00010,51135,00030,000Provide courses to students whenthey need them. Significantly morestudents are enrolledsimultaneously in online and faceto-face courses, and they retain andcomplete better.WE HAVE AN ONLINE STRATEGYTHAT WE WILL ,00010,00017,30314,4985,000020092018Classroom OnlyMixed ModalityOnline OnlyConcurrent Enrollment
Engineering Technology,Information Technology &Computer ScienceProgram Expansions: 919,000Implement an additionalElectrical Automation/RoboticsTechnology cohort; hire facultyto expand courses in dataanalytics, machine learning, andartificial intelligence to meetworkforce demands in the 21stcentury.
CybersecurityInfrastructure: 753,000Provide ongoing resources toprotect UVU and its students,faculty, and staff fromaggressive global cybersecuritythreats.
Our eyes are on COMPLETION!I T ’S EV ERYO NE’SRESPONSIBILITY
Our eyes are onCELEBRATION!(Utahna Warren)
credit ased on this data, UVU’s estimated discounted tuition rate is 1,672 (meaning average out-of-pocket tuition paid by UVU students) Grant or institutional scholarship, 46% Concurrent enrollment reduced tuition rate ( 5 per credit), 22% No grant