Transcription
Salaries inThe Oklahoma State System of H igher Ed u cation2016-2017Faculty and SelectedA dministrative PositionsOklahoma State Regents for Higher EducationResearch Park, Oklahoma CitySeptember 2017
OKLAHOMA S TATE REGEN TSF OR HIGHER ED U CATIOND r. Ro n a ld H. Wh it eCh a i rm a nOk la h o m a City , Ok la h o m aJ a y He lmVic e Ch a irm a nTu ls aAn d re w W. “An d y ” Le s te rEd m o n dJ o s e p h L. P a rk e r, J rS e c re ta ryTu ls a.J o h n Ma s s e yD u ra n tAn n Ho llo w a yAs s is ta n t S e c re ta ryArd m o reGe n e ra l To n e y S tric k linLa w to nJ e ffre y W. Hic k m a nF a irv ie wMic h a e l C. Tu rp e nOk la h o m a CityGle n D . J o h n s o nCh a n c e llo rTh e Okla h om a St a t e Regen ts for H igh er E duca t ion , in com plia nce wit h Tit les VI a n d VII of t he Civil Righ t s Act of 1964, E xecu t ive Or der 11236 a s a m en ded, Title IX oft h e E duca t ion Am en dm en t s of 1972, Am er ica n s wit h Disa bilit ies Act of 1990 an d oth er feder a l la ws, do not discr im in a te on t he ba sis of r a ce, color , n a t ion a l or igin , sex,a ge, r eligion, h a n dica p or st a t u s a s a vet er a n in a n y of it s policies, pr a ct ices, or pr ocedur es. Th is in clu des, bu t is not lim it ed to, a dm ission s, em ploym en t, fin a n cia l a id a n dedu ca t ion a l ser vices.Th is pu blica t ion , du plica ted by t h e St a t e Regen t s’ cen tr a l ser vices , is issu ed by t h e Okla hom a St at e Regen t s for H igher E du ca t ion a s a u t h or ized by 70 O.S. 2001, Sect ion3206. Copies h ave been pr epar ed a n d dist r ibu ted in t er n a lly. Copies h a ve been deposit ed wit h t he P u blica t ion s Clear in ghou se of the Okla hom a Depa r t m en t of Libra r ies.
Lis t o f Ta ble s a n d F ig u re sTa ble s :1. Aver a ge Sa la r ies P a id All F u ll-Tim e F a cu lt y, 2016-2017 . 32. Aver a ge Sa la r ies P a id All F u ll-Tim e F a cu lt y, 2014-2015 t h r ough 2016-2017 . 73. Aver a ge Sa la r ies P a id All F u ll-Tim e F a cu lt y, 25 Okla h om a St a t e Collegesa n d Un iver sit ies, 2014-2015 t h r ou gh 2016-2017 . 104. Aver a ge Sa la r ies P a id 9-10 Mon t h F u ll-Tim e F a cu lt y, 2016-2017 . 125. Aver a ge St a ff Ben efit s P a id 9-10 Mon t h F u ll-Tim e F a cu lt y, 2016-2017 . 166. Aver a ge Sa la r ies P a id 11-12 Mon t h F ull-Tim e F a cu lt y, 2016-2017 . 197. Aver a ge St a ff Ben efit s P a id 11-12 Mon t h F u ll-Tim e F a cu lt y, 2016-2017 . 238. Aver a ge Tot a l Com pen sa t ion P a id 9-10 a n d 11-12 Mon t h F ull-Tim e F a cu lt y, 2016-2017 . 269. Ra n ge of Sa la r ies P a id 9-10 a n d 11-12 Mon t h Aca dem ic Dea n s a n d F u ll-Tim e F a cu lt y, 2016-2017 . 2910. Addit iona l In com e fr om E xt r a Tea ch in g Assign m en t s a n d Appr ovedNon -in st it u t iona l E m ploym en t , 2016-2017 a n d 2016-2017 . 3211. 11-12 Mon t h Aver a ge Sa la r ies of Select ed Adm in ist r a t ive P osit ion s, 2016 -2017 . 3512. Un iver sit y of Okla h om a H ea lt h Scien ces Cen t er Aver a ge Sa la r ies P a id AllF ull-Tim e F a cu lt y, 11-12 Mon t h Sa la r ies for 2016-2017 . 4113. Aver a ge Sa la r ies P a id All F ull-Tim e F a cu lt y, All Ot h er Con st it u en t Agen cies, 2016-2017 . 4214. Aver a ge F r in ge Ben efit s P a id 9-10 Mont h a n d 11-12 Mon t h F u ll-Tim e F a cu lt y,All Con st it u en t Agen cies, 2016-2017 . 4415. New F a cu lt y Hir es, 2016-2017 . 4616. F a cu lt y Ter m in a t ion s, 2016-2017 . 4717. Aver a ge Sa la r ies P a id F ull-Tim e F a cu lt y, by Ra n k, by Tier , Okla h om a Com pa r ed t oNa t iona l P u blic Inst it u t ion s, 2006-07 t o 2016-2017 . 49
Lis t o f Ta ble s a n d F ig u re sF ig u re s :1. Ch a n ge in Nu m ber of F u ll-Tim e F a cu lt y, 2015-2016 t o 2016-2017 . 42. Ch a n ge in Sa la r ies of F u ll-Tim e F a cu lt y, 2015-2016 t o 2016-2017. 53. Ch a n ge in Nu m ber of 9-10 Mon t h F u ll-Tim e F a cu lt y, 12-13 t o 2016-2017 . 134. Ch a n ge in Sa la r ies of 9-10 Mon t h F u ll-Tim e F a cu lt y, 12-13 t o 2016-2017 . 145. Ch a n ge In Aver a ge Ben efit s P a id t o 9-10 Mon t h F u ll-Tim e F a cu lt y, All In st it u t ion s, 15-16 t o 16-17 . 176. Ch a n ge in Nu m ber of 11-12 Mon t h F ull-Tim e F a cu lt y, 2015-2016 t o 2016-2017 . 207. Ch a n ge in Sa la r ies of 11-12 Mon t h F ull-Tim e F a cu lt y, 2015-2016 t o 2016-2017 . 218. Ch a n ge in Aver a ge Ben efit s P a id t o 11 -12 Mon t h F u ll-Tim e F a cu lt y, 2015-2016 t o 2016-2017 . 249. Aver a ge Tot a l Com pen sa t ion P a id 9-10 Mon t h a n d 11-12 Mon t h F u ll-Tim eF a cu lt y, 2015-2016 Com pa r ed t o 2016-2017 . 2710. Addit ion a l In com e fr om E xt r a Tea ch ing Assign m en t s a n d Appr ovedNon -in st it u t ion a l E m ploym en t , 2015-2016 t o 2016-2017 . 3311. P r esiden t s’ Sa la r ies & Ben efit s, H igh & Aver a ge Sa la r y Com pa r ison s, F Y16 t o F Y17 . 3912. An n u a l P er cen t a ge Incr ea ses in F a cu lt y Sa la r ies, Okla h om a Com pa r ed t oNa t ion a l P u blic In st it u t ion s, by Tier . 5013. An n u a l P er cen t a ge Incr ea ses in F a cu lt y Sa la r ies, Okla h om a Com p a r ed t oNa t ion a l P u blic In st it u t ion s, by Ra n k . 51
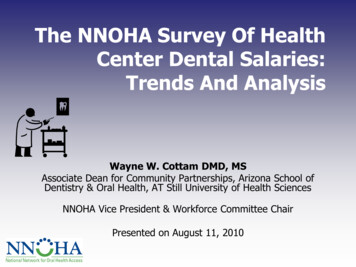
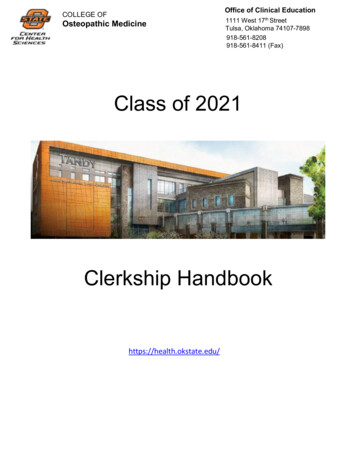
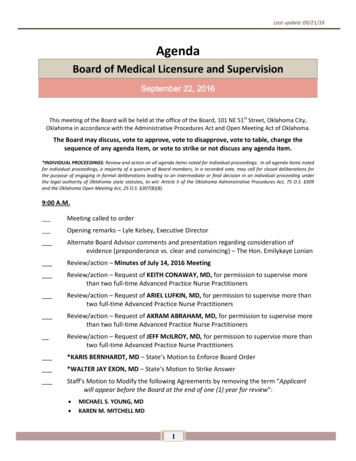
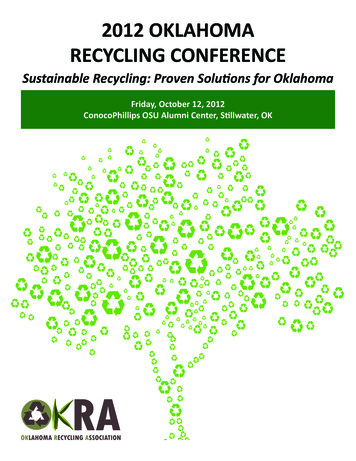
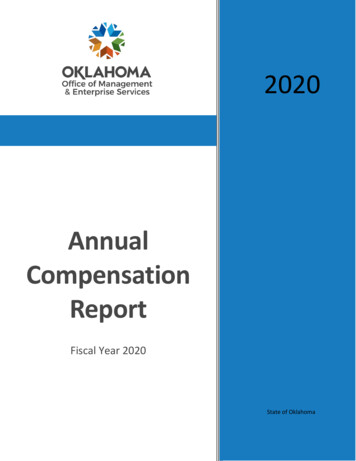
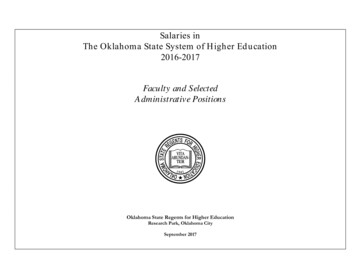
total number of faculty when the constituent agencies are addedis 6,709 a decrease of 55 or 0.8 percent.HIGHLIGHTSFor the purposes of this report, the term “research universities”includes OU and OSU; the term “four-year universities”includes the eleven regional universities (UCO, ECU, NSU,SEOSU, SWOSU, Cameron, Langston, NWOSU, Panhandle,RSU and USAO). “Constituent agencies” refer to the OUHealth Sciences Center, the OU Law Center, the OSUAgriculture Experiment Station, the OSU Cooperative ExtensionService, the OSU College of Veterinary Medicine, the OSUCenter for Health Sciences, OSU-Tulsa, OSU Technical Branchat Okmulgee and OSU Oklahoma City.Salary Range: Full-time salaries on a 9-10 month basis in the 25institutions in 2016-2017 range from a minimum of 11,760,compared to 15,302 as a low in 2015-2016, to a maximum of 303,867, compared to 303,867 in 2015-2016 (Table 9). On an11-12 month basis, full-time salaries range from a minimum of 4,725, the same low in 2015-2016, to a maximum of 425,004,the same high salary as in 2015-2016. These data excludesalaries for deans and other administrative personnel.Increase in Benefits: The average fringe benefits paid forfaculty on a 9-10 month contract basis for 2016-2017 are 23,061, a slight decrease over 2015-2016 of 667, or 2.8percent (Table 5); for faculty on an 11-12 month contract basis,average benefits total 33,453, a decrease of 2,604 or 8.4percent (Table 7).Average Salary: The average salary for all full-time facultyequated to a 9-10 month basis in Oklahoma state-supportedcolleges and universities, excluding the constituent agencies, is 68,464 for the year 2016-2017 (Table 1). This is an increase of 645 or 1.0 percent above 2015-2016.Oklahoma Average Salaries Compared to National: Researchuniversities’ average salary is 92.71 percent of the nationalaverage, compared to 89.01 percent in 2015-2016. In all ranksthe average rate for Oklahoma has increased, by 0.5 percent,from the 2015-2016 average to 86.52 percent. (Table 17)Increase/Decrease by Type of Institution: Average salariesincreased 87 at the research universities, increased by 356 atthe four-year universities, and a decrease of 297 at the two-yearcolleges. These salaries represent changes of 0.1 percent-research, 0.6 percent—four-year, and -0.6 percent—two-year,over 2015-2016.Increase/Decrease by Rank: Among the three categories ofinstitutions, the rank of Assistant Professor showed the greatestdollar increase over 2015-2016-- 1,395 or 2.2 percent. All otherpercent changes in salaries range from increase of 172 or 0.4percent for Instructors, to an increase of 1,013 or 1.4 percentfor Associate Professors. (see Figure 2).NOTE: The changes in average salaries are only partially related to salaryactions by governing boards. Other factors, such as resignations andretirements, can have an impact as well, particularly if new junior faculty arehired at lower salaries to replace departing senior faculty.Total Faculty: Total full-time faculty in 2016-2017 is 5,096 andecrease of 10 or -0.2 percent over 2015-2016 (Figure 1). The1
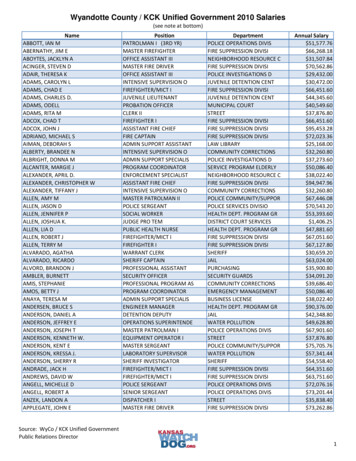
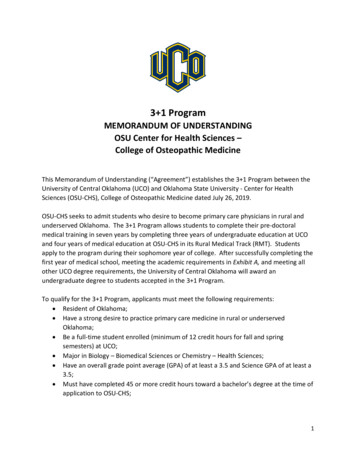
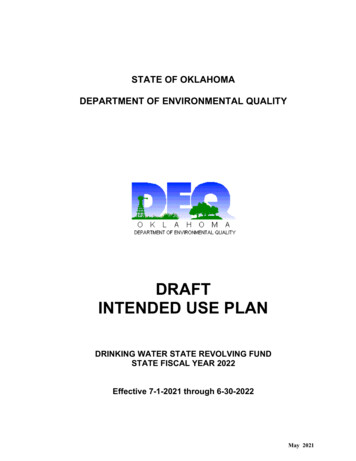
TABLE 1Faculty distribution by rank may influence the salary averages ofthe various faculty ranks within an institution. Table 1 shows asmaller proportion of faculty in the upper two ranks (professorand associate professor) at four-year universities than at theresearch universities. The research universities’ average salaryfor all ranks is 30.3 percent higher than the average salary of allranks for four-year universities. By rank, the researchuniversities’ average salary exceeds the four-year universities’average salary in the rank of professor by 33.0 percent, associateprofessor by 23.8 percent, and assistant professor by 27.5percent. However, in the rank of instructor, the two-yearuniversities’ average salary exceeds the system average salary by9.5 percent.Table 1 presents the 2016-2017 average salaries paid all fulltime faculty by rank and by all 25 colleges and universities inThe Oklahoma State System of Higher Education. These datainclude salaries of full-time faculty employed on a 9-10 monthcontract basis and full-time faculty employed on an 11-12 monthcontract basis with salaries equated to 9-10 months. Table 1 alsoincludes the number of full-time faculty by rank and byinstitution.The average salary equated to a 9-10 month basis paid in the 25institutions in 2016-2017 is 68,464. This represents an increaseover 2015-2016 of 645 or 1.0 percent (see Figure 2). Theaverage for research universities is 85,497, for four-yearuniversities, 59,581, and for two-year colleges, 48,988. Thesesalaries represent increases over 2015-2016 of 0.1 percent and0.6 percent and a decrease of 0.6 percent, respectively, for theresearch, regional universities, and two-year colleges. The 20162017 median of all institutions’ average salaries is 49,601.The total number of full-time faculty reported in the 25institutions in 2016-2017 is 5,096—2,243 at researchuniversities, 1,885 at four-year universities, and 968 at two-yearcolleges. These figures compare to a total of 5,106; 2,173; 1,922;and 1,011 at the research, four-year and two-year tiers,respectively in 2016.Average salaries for instructors are highest at the two-yearcolleges, and lowest at the four-year regional universities.2
TABLE 1AVERAGE SALARIES PAID ALL FULL-TIME FACULTY2016-2017Academic RankInstitutionProfessorNumberAmountUniversity of OklahomaOklahoma State UniversityResearch UniversitiesResearch Tier Salaries Greater than 4-Yr Tier:424284708 University of Central OklahomaEast Central UniversityNortheastern State UniversityNorthwestern Oklahoma State UniversitySoutheastern Oklahoma State UniversitySouthwestern Oklahoma State UniversityCameron UniversityLangston UniversityOklahoma Panhandle State UniversityRogers State UniversityUniversity of Science & ArtsRegional Four-Year Universities4-Yr Tier Salaries Greater than Research Tier:193327823533739752317507 Carl Albert State CollegeConnors State CollegeEastern Oklahoma State CollegeMurray State CollegeNortheastern Oklahoma A&M CollegeNorthern Oklahoma CollegeOklahoma City Community CollegeRedlands Community CollegeRose State CollegeSeminole State CollegeTulsa Community CollegeWestern Oklahoma State CollegeTwo-Year Colleges2-Yr Tier Salaries Greater than System Avg:All Colleges and Universities- 1,215 Associate 72 - 926100,338 Assistant 7 - - 73,2271,118 9 5043385356100143261054028727968 - 64,8951,837 FY2017 Median Salary:NOTE: Includes all full-time faculty salaries on a 9-10 month basis. All 11-12 month salaries have been equated to 9-10 month salaries by multiplying the 11-12 month salaries by 9/11.Average, All RanksNumberAmount43,92751,20447,4671,2001,0432,243 5599501,885 0143261054028727968 ,26741,07457,00244,11048,9885,096 68,464 49,601 08561,92155,65253,49040,43949,60151,49059,581
FIGURE 1CHANGE IN NUMBER OF FULL-TIME FACULTY2015-2016 TO 2016-20172,5002,500Research Universities2,000Four-Year 338507540377 rofessorInstructorAll rease)-33(6.1%Decrease)Two-Year ctorAll RanksAll Colleges & 21(2.2%Decrease)1,5001,0111,2145009685001,215947 6 ociateProfessorAssistantProfessorInstructorAll Ranks
FIGURE 2CHANGE IN SALARIES OF FULL-TIME FACULTY2015-2016 TO 2016-2017 120,000 AssociateProfessorAssistantProfessorInstructorAll RanksProfessorAssistantProfessor 59,225 59,581 43,357InstructorAll RanksAll Colleges & Universities 48,988 49,285 20,000 10,000 1,395(2.2%Increase) 47,152 1,013(1.4%Increase) 40,000 40,000 46,980 50,000 68,464 67,819 172(0.4%Increase) 64,895 309(0.3%Increase) 63,500 60,000 60,000 73,227 70,000 72,214 80,000- 297(0.6%Decrease) 80,000 100,338 90,000 100,029 100,000 100,000 20,000AssociateProfessor 120,000Two-Year Colleges 110,000 30,000 54,787 77,994 Professor 120,000 77,024 85,410 85,497 20,000 1,977(4.2% Increase) 355(0.6%Increase) 31(0.1%Increase) 43,326 20,000 40,000 200(0.4%Increase) 54,587 912(1.2%Increase) 60,000- 332(0.5%Decrease) 63,114 1,4251.8%Increase) 40,000 970(1.3%Increase) 80,000 87(0.1%Increase) 47,467 60,000 45,490- 76(0.1%Decrease) 75,566 81,008 82,433 80,000 74,654 100,000Four-Year Universities 62,781Research Universities 116,339 100,000 116,415 120,000 644(1.0%Increase) Professor stantProfessorInstructorAll Ranks
3,843; the increase for assistant professor was 4,555; and therank of instructor showed an increase of 6,608. At theUniversity of Oklahoma, comparable figures were changes of 439; 4,453; 1,309 and 1,272 for professors, associateprofessors, assistant professors and instructors, respectively.Such differences may result from factors suggested above orcould also result from salary administration policy and facultyqualifications as well as the number of positions represented ineach rank. Although Table 2 does not provide specific reasonsfor observed salary averages and comparisons, the three-yeartrend of institutions’ average salaries by rank may providehelpful data.TABLE 2Table 2 presents the 9-10 month average salaries of all full-timefaculty members for the three years, 2014-2015 through 20162017, from which salary trends by institution and by rank maybe analyzed.Certain factors may influence salary averages so that they do notaccurately indicate long-term salary trends. For example: asenior full professor receiving a top salary could retire and at thesame time an associate professor be promoted to full professor atthe bottom of the salary scale for full professors. The net result,with respect to individual faculty still employed, would be that atleast one person would be receiving more salary than in theprevious year. Yet, the effect upon the average salary for fullprofessors at the institution would show a decline. The averagesalary for an entire institution could be affected in the samemanner. Another factor causing the same effect could occur as aresult of hiring new faculty to meet the demands of expandingenrollment; new faculty members would normally be hired at asalary level below the institution’s salary average. Several of thestate system institutions are showing a decline in salary due tothe aforementioned factors.Analyses of the data contained in Table 2 may be made in avariety of meaningful ways. No attempt is made here to providean exhaustive analysis; however, certain observations are noted.The dollar increases in average salaries are not the same betweendifferent ranks in the same institution. For example, changes for2014-2015 to 2016-2017 show the University of Oklahomadecreased the average of all ranks 15 or 0.0 percent, whileOklahoma State University increased 1,668 or 2.0 percent. AtOklahoma State University, the salary for the rank of professordecreased by 3,503; the increase for associate professors was6
TABLE 2AVERAGE SALARIES PAID ALL FULL-TIME FACULTY2014-2015 THROUGH 2016-2017InstitutionUniversity of OklahomaOklahoma State UniversityUniversity of Central OklahomaEast Central UniversityNortheastern State UniversityNorthwestern Oklahoma State UniversitySoutheastern Oklahoma State UniversitySouthwestern Oklahoma State UniversityCameron UniversityLangston UniversityOklahoma Panhandle State UniversityRogers State UniversityUniversity of Science & Arts of OklahomaPeriod2014-20152015-20162016-2017 Chg, 15-2017% Chg, 15-20172014-20152015-20162016-2017 Chg, 15-2017% Chg, 15-20172014-20152015-20162016-2017 Chg, 15-2017% Chg, 15-20172014-20152015-20162016-2017 Chg, 15-2017% Chg, 15-20172014-20152015-20162016-2017 Chg, 15-2017% Chg, 15-20172014-20
Rose State College Seminole State College Tulsa Community College Western Oklahoma State College ----- ----- ----- 50 43 38 53 56 100 143 26 105 40 287 27 -9.5% 39,100 43,637 42,072 44,151 45,779 4