Transcription
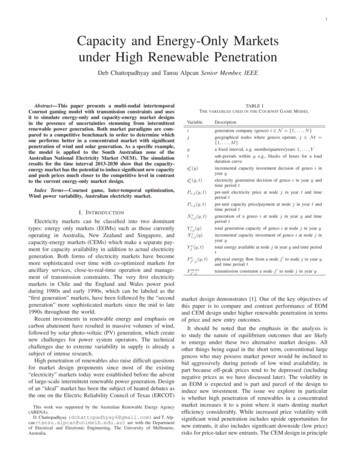
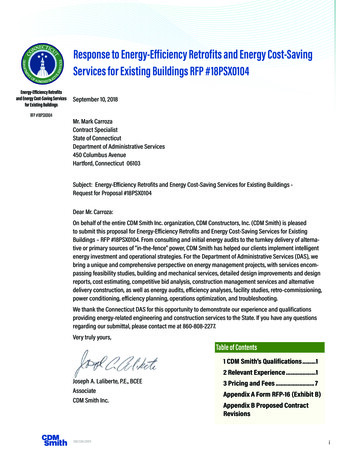
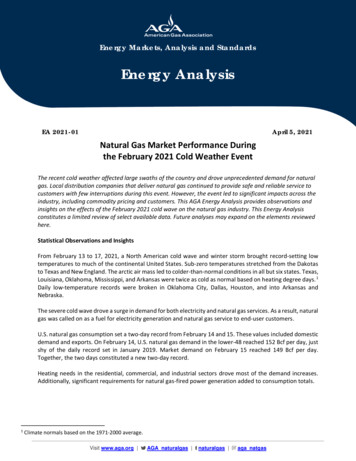
Energy Markets, Analysis and StandardsEnergy AnalysisEA 2021-01April 5, 2021Natural Gas Market Performance Duringthe February 2021 Cold Weather EventThe recent cold weather affected large swaths of the country and drove unprecedented demand for naturalgas. Local distribution companies that deliver natural gas continued to provide safe and reliable service tocustomers with few interruptions during this event. However, the event led to significant impacts across theindustry, including commodity pricing and customers. This AGA Energy Analysis provides observations andinsights on the effects of the February 2021 cold wave on the natural gas industry. This Energy Analysisconstitutes a limited review of select available data. Future analyses may expand on the elements reviewedhere.Statistical Observations and InsightsFrom February 13 to 17, 2021, a North American cold wave and winter storm brought record-setting lowtemperatures to much of the continental United States. Sub-zero temperatures stretched from the Dakotasto Texas and New England. The arctic air mass led to colder-than-normal conditions in all but six states. Texas,Louisiana, Oklahoma, Mississippi, and Arkansas were twice as cold as normal based on heating degree days. 1Daily low-temperature records were broken in Oklahoma City, Dallas, Houston, and into Arkansas andNebraska.The severe cold wave drove a surge in demand for both electricity and natural gas services. As a result, naturalgas was called on as a fuel for electricity generation and natural gas service to end-user customers.U.S. natural gas consumption set a two-day record from February 14 and 15. These values included domesticdemand and exports. On February 14, U.S. natural gas demand in the lower-48 reached 152 Bcf per day, justshy of the daily record set in January 2019. Market demand on February 15 reached 149 Bcf per day.Together, the two days constituted a new two-day record.Heating needs in the residential, commercial, and industrial sectors drove most of the demand increases.Additionally, significant requirements for natural gas-fired power generation added to consumption totals.1Climate normals based on the 1971-2000 average.Visit www.aga.org AGA naturalgas naturalgas aga natgas
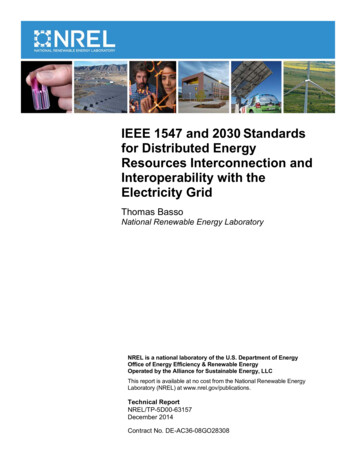
Residential and commercial demand for natural gas service averaged 70 Bcf per day over February 14 and 15and represented 46 percent of national natural gas demand. Gas flows to the power sector posted a newwinter high of over 39 Bcf per day on February 15. In part driven by weather-sensitive energy loads, volumesdelivered to industrial customers increased to 28 Bcf per day.Figure 1: U.S. Natural Gas Demand, Billion Cubic Feet per DayU.S. Natural Gas Demand(Bcf/d)160Record high: 155 Bcf/dWinter 20-21 high: 152 n5-Feb12-Feb19-Feb26-FebAGA graph created with data sourced from S&P Global Platts AnalyticsThe cold event also led to disruptions to some supply sources. Freeze-offs at the wellhead and declines innatural gas processing capacity reduced nationwide supply by about 20%. Interruptions to electric power inTexas and other areas also constrained supplies in instances where electricity was needed to operate naturalgas production and processing infrastructure.Visit www.aga.org AGA naturalgas naturalgas aga natgas
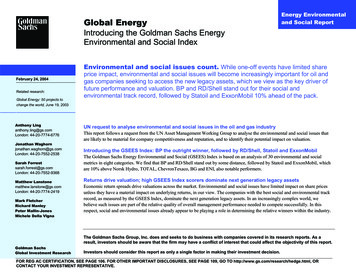
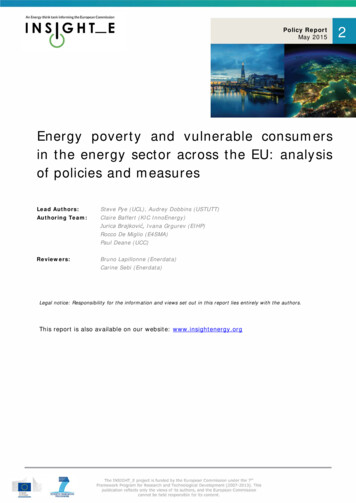
Figure 2: Total U.S. Dry Gas Production, Billion Cubic Feet per DayTotal U.S. Dry Gas Production (Bcf/d)2019/20202020/202114 Day c8-Dec1-Dec74AGA graph created with data sourced from S&P Global Platts AnalyticsThe cold event's effects also affected U.S. pipeline exports to Mexico, which fell from a high of 6.1 Bcf perday on February 10 to 3.8 Bcf per day on February 16. The majority of the declines occurred in the SouthTexas corridor, with reductions up to 20 percent as temperatures plummeted.The cold temperatures had the opposite effect on imports from Canada. Following high monthly imports of8.4 Bcf per day right after the peak of the cold weather. As temperatures ease, imports fell to 3.6 Bcf per dayas cold temperatures receded by February 26.Feedgas deliveries to US LNG export facilities also experienced sharp declines. Daily gas deliveries frompipelines connected to US LNG export facilities reached the lowest volumes on February 16, falling 78 percentfrom less than one week prior.Natural gas storage played a critical role in meeting natural gas demand during the cold wave. The EIAreported that withdrawals from underground storage totaled 338 Bcf for the week ending February 19, 2021,representing the second-largest weekly withdrawal ever. Withdrawals in the U.S. South Central region, whichserves Texas and surrounding markets, increased by 184 percent from two weeks earlier, for a record amountwithdrawal of 156 Bcf from storage.Visit www.aga.org AGA naturalgas naturalgas aga natgas
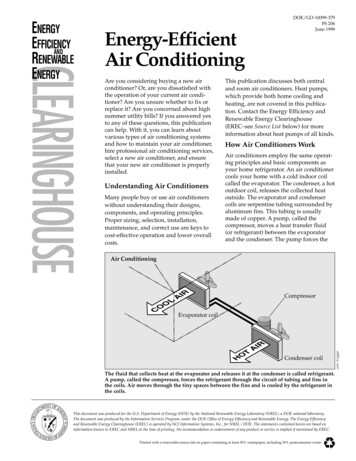
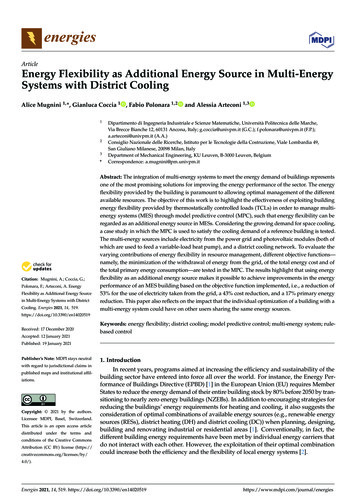
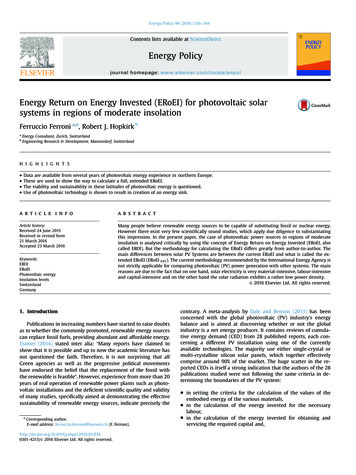
Figure 3: Range of Weekly Natural Gas Storage net changes, Lower-48 states (2010-2021)Source: U.S. Energy Information Administration, Weekly Natural Gas Storage ReportThe ramp-up of gas storage withdrawals was significant. U.S. gas withdrawals during the week of February19 increased 43% from the week prior and nearly 100% from two weeks earlier.Figure 4: Daily Henry Hub Natural Gas Spot Prices (Jan 1997-Mar 2021), Dollars per Million BritishThermal Units (MMBtu)Source: U.S. Energy Information Administration, Henry Hub natural gas spot priceConditions led to a significant increase in the spot price of natural gas in many areas. Daily natural gas spotprices at Henry Hub reached nearly 24 per MMBtu on February 17, 2021. Other areas saw more significantincrease in prices. For example, the OGT price marker in Oklahoma posted prices nearing 1,200 per MMBtuon February 15, up from just 9 one week prior.Visit www.aga.org AGA naturalgas naturalgas aga natgas
Figure 5: Natural Gas Prices Prompt-Month Future at Henry HubData Source: U.S. Energy Information AdministrationDespite the sharp increases in daily cash prices, futures contracts faced only moderate pressure. The promptmonth futures price at Henry Hub reached a high of 3.22 per MMBtu on February 16. For April delivery,natural gas contract prices saw a temporary increase, peaking at 3.06 per MMBtu on February 18.Natural gas performance in Southern USRecord sub-freezing temperatures and windchills across Texas lasting more than eight days drove significantelectricity demand increases. The Texas grid operator ERCOT (Electric Reliability Council of Texas) represents90 percent of Texas electric load. Peak forecasted demand in ERCOT reached 76.8 GW on February 15,exceeding ERCOT's planning of 67.2 GW for an extreme winter weather scenario. Controlled electricaloutages were implemented to prevent a statewide blackout.Electric generators were affected by mechanical issues, constrained gas supplies, lower than normal solargeneration due to cloud cover, and limited wind generation, reportedly resulting in nearly 48.6 percent ofelectricity capacity generation being forced out during the height of the event. 2 ERCOT's operatorsimplemented controlled outages to avoid a system-wide blackout, which led to millions without electricityduring the event's coldest days. As temperatures eased, more generation was brought back online, andelectricity demand requirements dropped.Overall, Texas set a new record for natural gas consumption even with the severe challenges associated withthe electric power outages. The cold drove a substantial increase in natural gas use for power generation,industrial consumption, and residential and commercial demand.On February 15, Texas consumed a record 23.7 Bcf per day, according to S&P Global Platts Analytics. Frompre-event levels, Texas daily gas flows to power generation increased 183%; residential and commercial gasdemand combined increased by 238%, and industrial demand increased by 47%.2http://www.ercot.com/content/wcm/key documents lists/225373/2.2 REVISED ERCOT Presentation.pdfVisit www.aga.org AGA naturalgas naturalgas aga natgas
Figure 6: Texas Natural Gas Demand, Billion Cubic FeetAGA graph created with data sourced from S&P Global Platts AnalyticsFigure 7: Texas Natural Gas Demand, Feb 3 – 22, 2021 (Bcf)AGA graph created with data sourced from S&P Global Platts AnalyticsVisit www.aga.org AGA naturalgas naturalgas aga natgas
According to modeled estimates from S&P Global Platts Analytics, onshore natural gas production in Texasfell by 7 Bcf per day or 29%. Production declines began on February 7 and ended on February 17. The mostsignificant daily declines in modeled production were concentrated between February 10 and 15, with thedaily low reaching 17.1 Bcf per day. However, estimates for this demand decline vary. The U.S. EnergyInformation Administration reported via data provided by in Texas fell to a daily low of 11.8 Bcf per day onFebruary 17.Figure 8: Texas Dry Natural Gas Production, Billion Cubic Feet per Day30Texas dry natural gas production (Bcf per day)S&P Global Platts Estimates25201517.1 Bcf/d1050AGA graph created with data sourced from S&P Global Platts AnalyticsThe weekly natural gas storage withdrawal in the U.S. South Central region, which serves Texas andsurrounding markets, was a record draw of 156 Bcf for the week ending February 19. As with the nationaltotals, storage withdrawals ramped up quickly. Gas flows from storage increased 184% from two weeksearlier. Daily withdrawals were likely even larger.Visit www.aga.org AGA naturalgas naturalgas aga natgas
Figure 9: South Central Region Natural Gas Working Underground StorageSource: Energy Information AdministrationCommentary on the role of natural gas utilities in meeting winter heating season obligationsDuring extreme weather events, when gas utility customers need reliable gas service the most, natural gasdistribution companies work hard to ensure the system remains safe and service is not interrupted. Thefollowing paragraphs focus on how distribution companies continued to provide safe, reliable gas serviceduring the severe weather event that affected much of the U.S. on February 2021.Natural gas utilities have over a century of experience undertaking operational planning and preparation forextreme or emergency conditions, especially winter weather. That planning and preparation proved effectivewhen put to the test under these unprecedented weather conditions.Over 72 million customers use natural gas across the United States for space heating, cooking, water heating,and other end-uses. Natural gas is delivered to customers by local distribution companies, which areregulated utilities subject to the regulatory compact. Under the regulatory compact, utilities are required todeliver natural gas to customers at just and reasonable rates, including during severe weather events thataffect supply and demand.Importantly, state-regulated natural gas utilities purchase gas from producers and transportation companies,receive the contracted gas at the city gates, and distribute the gas to end-use customers. As a result, mostnatural gas bills consist of two items:1) Utilities charge each customer for all gas molecules delivered from the city gates to the customer'spremises. The regulator sets the rate charged for delivery during protracted rate proceedingsinvolving multiple intervenors. Rates set during rate proceedings cannot be unilaterally changed bythe utility without regulatory approval and are not affected by supply or demand changes.2) Utilities pass through to customers the cost of gas commodity purchases. Utilities do not earn areturn on commodity transactions, so they are best served by keeping gas purchases as affordableas possible. However, unlike distribution rates, gas prices are set by the market and are thereforeVisit www.aga.org AGA naturalgas naturalgas aga natgas
subject to supply and demand forces. Since supply and demand can be unpredictable, particularlyduring severe weather events, utilities have access to several tools designed to limit theircustomer's exposure to sharp increases to natural gas prices.Despite the record demand and the challenges described earlier in this Energy Analysis regarding natural gasproduction and electricity generation, natural gas utilities continued to provide safe and reliable natural gasservice to customers during this event with few interruptions. This level of service is attributable to theresiliency of the natural gas infrastructure based on years of strategic investment in these distributionsystems' safety and reliability.America's natural gas utilities invest 91 million every day on enhancing the safety and reliability of naturalgas distribution and transmission systems. This investment stems from the industry's joint efforts along withfederal and state regulators, public officials, and consumers and results in the provision of service to nearly180 million Americans.There are curtailment rules for the natural gas utility industry that dictate how to allocate natural gas supplyin the rare event that there is a limited supply available. A guiding principle of those rules is that top prioritymust be given to natural gas service used in buildings where people usually dwell, such as residences,hospitals, and nursing homes. Those rules ensured that human needs customers took precedence during thisextreme event and incurred very few and limited interruptions to their natural gas service.The costs associated with high commodity pricing during a winter event can affect natural gas utilitycustomers' bills. However, natural gas utilities do not set the market pricing for natural gas, and there is noprofit added to the gas cost recovered to customers. Natural gas utilities use several tools to reduce theeffects of market volatility on customer bills to reliably and economically procure the commodity to provideservice to its customers.Local market conditions and geography often determine gas procurement strategies and operationsmanagement. Gas utilities employ a diverse set of contractual arrangements to procure their gas supplies,including long-term, mid-term, monthly, and daily agreements. Gas utilities also purchase gas commoditiesusing a range of gas supply pricing mechanisms and financial tools, including physical and financial hedgingmechanisms, to manage price volatility and reliability. Financial instruments such as fixed-price purchasecontracts, futures, swaps, and options, allow gas supply portfolio managers to hedge or lock in a portion ofthe commodity cost component of gas supplies. These utilities may maintain underground natural gas storagefields, which allows for the withdrawal of natural gas from storage during peak demand periods to meetcustomer needs.Many factors shape the market pricing of gas commodity and transportation services, including weather,storage levels, end-use demand, pipeline capacity, operational issues, and financial markets. These costs inthe aftermath of severe weather events can be very high. The rates of natural gas utilities are regulated bythe states in which they operate. Utilities may work with their state regulators to mitigate rate shocks tocustomers resulting from these events through special regulatory treatments, including regulatory assets,deferred purchase gas costs, or securitization.Concluding ObservationsThe resiliency of the natural gas transmission and distribution system was on display throughout the middleof February 2021. While large areas of the country struggled with the effects of the polar cold event, naturalgas utility companies were able to use their investments in infrastructure, operations, and planning to keepcustomers supplied with a reliable energy source to heat their homes, even amid severe supply constraints.In addition, the natural gas utilities demonstrated the importance of their extensive storage resources duringpeak seasonal demand.Visit www.aga.org AGA naturalgas naturalgas aga natgas
NoticeIn issuing and making this publication available, AGA is not undertaking to render professional or otherservices for or on behalf of any person or entity. Nor is AGA undertaking to perform any duty owed by anyperson or entity to someone else. Anyone using this document should rely on his or her own independentjudgment or, as appropriate, seek the advice of a competent professional in determining the exercise ofreasonable care in any given circumstances. The statements in this publication are for general informationand represent an unaudited compilation of statistical information that could contain coding or processingerrors. AGA makes no warranties, express or implied, nor representations about the accuracy of theinformation in the publication or its appropriateness for any given purpose or situation. This publication shallnot be construed as including, advice, guidance, or recommendations to take, or not to take, any actions ordecisions any matter, including without limitation relating to investments or the purchase or sale of anysecurities, shares or other assets of any kind. Should you take any such action or decision; you do so at yourown risk. Information on the topics covered by this publication may be available from other sources, whichthe user may wish to consult for additional views or information not covered by this publication.Copyright 2021 American Gas Association. All rights reserved.Visit www.aga.org AGA naturalgas naturalgas aga natgas
The ramp-up of gas storage withdrawals was significant. U.S. gas withdrawals during the week of February 19 increased 43% from the week prior and nearly 100% from two weeks earlier. Figure 4: Daily Henry Hub Na