Transcription
PACIFIC GAS AND ELECTRIC COMPANY2020 WILDFIRE MITIGATION PLANREMEDIAL COMPLIANCE PLANRULEMAKING 18-10-007JULY 27, 2020PUBLIC VERSION
PACIFIC GAS AND ELECTRIC COMPANY2020 WILDFIRE MITIGATION PLANREMEDIAL COMPLIANCE PLANTABLE OF CONTENTSConditionGuidance-3Title of DeficiencyPageLACK OF RISK MODELING TO INFORM DECISIONMAKING113PG&E-3PG&E GROUPS INITIATIVES INTO PROGRAMS ANDDOES NOT PROVIDE GRANULAR INITIATIVE DETAILHIGH INCIDENCE OF CONDUCTOR FAILUREPG&E-8ANNUAL RISK RANKING IS QUICKLY OUT OF DATE28PG&E-15IT IS UNCLEAR HOW PG&E CLASSIFIES FINDINGSAS THE APPROPRIATE LEVEL33PG&E-25LACK OF DETAIL ON PLANS TO ADDRESSPERSONNEL SHORTAGES43PG&E-26EFFECTIVENESS OF INCREASED VEGETATIONCLEARANCES49PG&E-27PUBLIC SAFETY PARTNER COORDINATION55PG&E-1.-i-20
CONDITION GUIDANCE-3LACK OF RISK MODELING TO INFORM DECISION-MAKING-1-
Deficiency: Electrical corporations do not provide sufficient detail in their 2020 WildfireMitigation Plan (WMP) to demonstrate how they are leveraging risk models to target thehighest risk portions of the grid. While most utilities indicate current progress and workon developing models to estimate risk across their service territories, there is a lack offocus on how these models can be used in practice to prioritize initiatives to addressspecific ignition drivers and geographies. Specifically, utilities fail to outline in detail howthey determine where to prioritize to improve asset management or determine portionsof circuits that would benefit the most from hardening and Vegetation Management(VM). By continuing to improve wildfire risk modeling and basing its wildfire mitigationson its wildfire risk modeling outputs, electrical corporations can potentially achieve agreater level of risk reduction with the same resources.Condition: Each electrical corporation shall submit in its remedial correctionplan (RCP) the following:i.how it intends to apply risk modeling and risk assessment techniques to eachinitiative in its WMP, with an emphasis on much more targeted use of assetmanagement, VM, grid hardening and Public Safety Power Shutoff (PSPS)based on wildfire risk modeling outputs;ii. identify all wildfire risk analyses it currently performs (including probabilityand consequence modeling) to determine which mitigation is targeted tocircuits and assets where initiatives will provide the greatest benefit towildfire risk reduction;iii. a timeline to leverage its risk modeling outputs to prioritize and targetinitiatives and set PSPS thresholds, including at least asset management, gridoperations, VM, and System Hardening (SH) initiatives;Consistent with the information provided in Pacific Gas and Electric Company’s(PG&E) response to the Wildfire Safety Division (WSD) Guidelines Maturity Survey,PG&E is in the process of raising the maturity of our risk models from relative riskmodels at the circuit level with system-level risk reduction and Risk Spend Efficiency(RSE) capabilities to automated, quantitative risk models that include risk reduction andRSE evaluations at the asset level. The purpose of these models is to provideanalytical insights to contribute to wildfire risk mitigation decisions by: (1) providing ameasurement to communicate risk levels and track progress in improving grid safety by-1-
drawing-down risk; (2) providing a measure of estimated risk reduction for proposedmitigations to inform optimization of workplans; and (3) contributing to situationalawareness of risk.At a high level, separate composite risk models each for the electric transmission(Tx) and distribution (Dx) systems are at different stages of development. As shown inthe table below, each composite model consists of sub-models targeting specific WMPinitiatives. The timeframes shown for implementing each of these modeling capabilitiesis based on PG&E’s project plan as of the end of the second quarter of 2020. As theactivities shown here involve creating and deploying new tools, revisions to thisschedule are likely. Numerous factors including resource availability, confirmation oftechnological capabilities, and ongoing learnings and adjustments to program focus willinfluence the ultimate schedule under which these tools will be implemented andoperational.-2-
TABLE 1 – SUB-MODELS BY WMP INITIATIVE MPSPSAsset GroupCurrent CapabilitiesPlanned CapabilitiesPlannedTimeframeDistributionSeparate modelsDx Risk Model Composite model ofthe sub-models listedbelowQ2 2021TransmissionSeparate modelsTx Risk Model Composite model ofthe sub-models listedbelowQ1 2022DistributionRelative risk of circuitsegments at the protectionzone levelRisk reduction valuesfor SH mitigationsnear the asset levelQ4 2020TransmissionProbability of failure as afunction of wind speedAdditional granularityat the component levelQ3 2021DistributionRelative risk at theprotection zone levelwithin circuitsRisk reduction valuesby asset and tag typeQ2 2021TransmissionPrioritization based on tagtype and geographic riskPrioritization based ontag type and updatedfire potential conditiondataQ1 2021DistributionRisk reduction values forEnhanced VegetationManagement (EVM)mitigations near the assetlevelImproved modelprecision and detail onrisk reduction valuesCurrently inuseTransmissionLiDAR Risk Score at theline level & ParetoAnalysisImproved modelprecision of tree risk atthe structure levelQ4 2020DistributionOutage Producing Winds(OPW) forecast combinedwith Fire Potential Index(FPI)Improved precisionand granularityCurrently inuseTransmissionTx Asset Health Model(Operability Assessment(OA)) multiplied by FPI atthe structure levelImproved precisionand granularity;addition of potentialignition consequenceinformation (fromTechnosylva model)Currently inuse, nextenhancementplanned Q42020As outlined in the table above, PG&E is developing advanced analytical risk models(at a high level referred to as composite risk models), including sub-models thatrepresent specific failure modes, such as vegetation or equipment caused events.Using asset and environmental data (e.g., asset age, condition, manufacturer,meteorology, topology, vegetation) as inputs to the model, we are improving our ability-3-
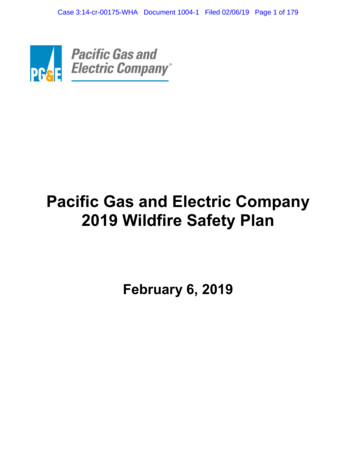
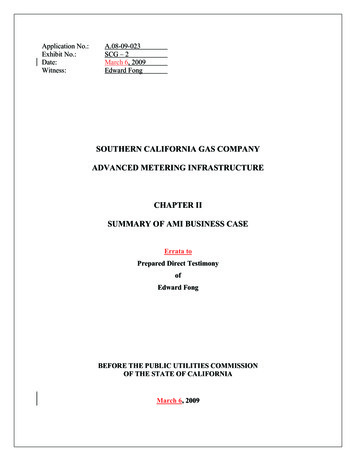
to predict the location and potential causes/failure modes of ignitions, outages, andwire-down events. These composite risk models are intended to be used to informstrategic decision-making around its asset management, VM, grid hardening and PSPSprograms. For decision making purposes, these model-based insights will becomplemented with understandings from internal and external subject matter experts(SME) and industry best practices.An important step in the preparation of these models is peer validation by SMEs (asto technical content) and analytical experts (as to modeling methods). Although modeldevelopment inherently involves a continual process of review and validation, the initialmodels are scheduled for external peer review as part of the “Utility Analytics Week”conference in November sponsored by the Utilities Analytics Institute(https://utilityanalytics.com/). In addition to external peer review, the composite riskmodels will be reviewed and validated annually by comparing actual grid performanceand model outputs and forecasts to improve their accuracy and relevance for use toinform wildfire mitigation decision-making.PG&E’s composite risk models are ultimately focused on developing riskprobabilities at a close to asset level granularity. Using annual probabilities at the assetlevel in combination with “consequence data inputs,” which represent the potentialsafety, reliability and financial consequences derived from the Multi-Attribute ValueFunction (MAVF) risk score, will produce MAVF risk scores close to the asset level.These asset level risk scores can then aggregate up to successively higher systematiclayers (i.e., asset (most granular), span, protection zone, circuit, region, system (mostaggregated)) to update the different initiatives in the WMP.The following four slides capture PG&E’s current approach and plan to developdistribution composite risk models. The Distribution Risk Model is used to illustratePG&E’s approach as we have a larger volume of distribution assets and expect to makeprogress on several key areas (asset management, VM and system hardening) over thenext year. All the composite risk models and their components are a work in progressand may change at any time as new information is learned.To effect these improvements, PG&E is following a systematic risk framework(below) that develops our capacity in alignment with the capabilities identified in theWSD Guidelines Maturity Survey (noted by the green icons).-4-
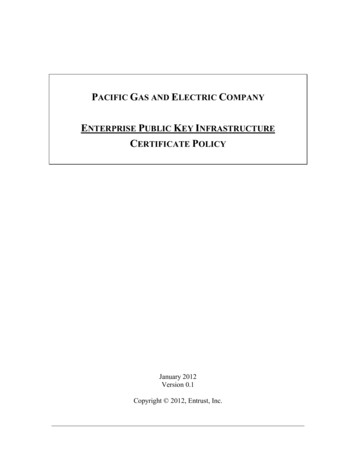
FIGURE 1 – ELECTRIC OPERATIONS RISK FRAMEWORKOur first composite risk model in development within this framework is theDistribution Vegetation model. This model is providing insights to the VM team toinform the targeting of work within the 2021 EVM workplan. For this model we use amulti-variable regression algorithm to forecast the annual probability of ignitions,outages and wire-down events at a 100m x 100m pixel level across our service territory.At this level of granularity, the result is a model that indicates not only where to do workbut also what type of work will be most effective in reducing risk.-5-
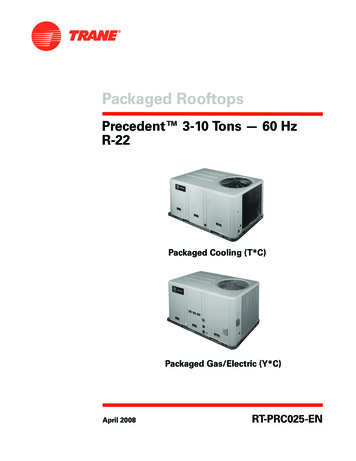
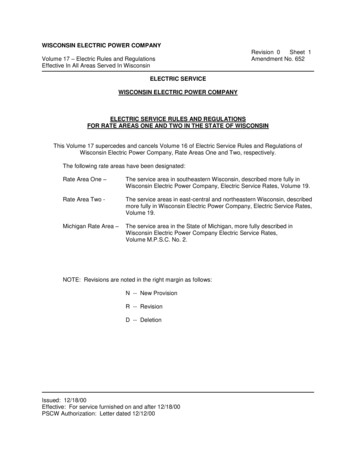
FIGURE 2 – VEGETATION PROBABILITY MODELThe three annual probabilistic outputs from this model (wire-down events, outageevents and ignition events) will be combined with consequence data sets to developdetailed MAVF risk scores to inform VM work targeting. This risk score will not be arelative ranking, like some prior models PG&E used, but instead a quantitative riskscore that ties the risk associated with specific locations to the enterprise MAVF scoresused in the Risk Assessment And Mitigation Phase (RAMP) filing. By combining safety,reliability and financial consequences, the MAVF risk score enables prioritization acrossmultiple risks. Fed by this probabilistic model output, calculating more detailed riskreduction and RSE values for mitigations will be possible. As vegetation work iscompleted in the field, automated updates of the model will measure the risk drawndown over time.-6-
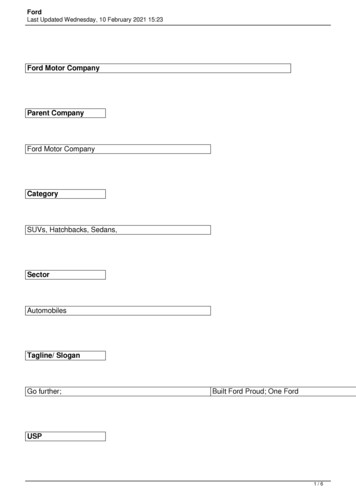
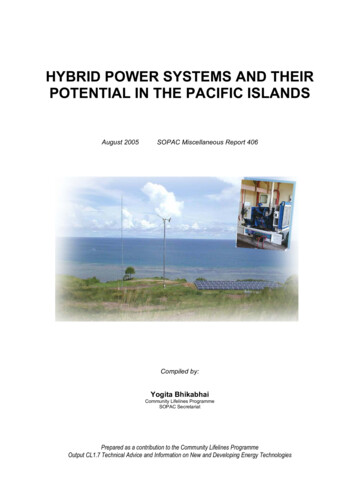
FIGURE 3 – FACTORS OF MAVF RISK SCORESOnce these models have been developed and tested to assure that they are readyto inform electric operations and planning, the primary goals of implementing thesemodels will include: (1) providing situational awareness of risk; (2) enhancing riskinformed decision making; and (3) allowing PG&E to quantify risk reductions fromwildfire specific risk mitigation initiatives. To accomplish these goals, model users willneed to view risk at different levels (or layers) of the electric system to enable acoordinated, one vision approach to risk management. The layers are shown here fromthe most granular asset layer up to the system layer.Once these models have been validated and calibrated at both the individual modellevel and in combination, we will be able to use these risk layers in different ways toinform and support expert technical and policy decisions: The system level will allow regulators and senior leadership to track riskimprovement or view portfolio alternatives at a rate case level. The regional view will enable coordination and comparisons across geographicregions with standard risk measures. The circuit level can inform optimal locations for specific mitigations such as systemprotection technologies (like Rapid Earth Fault Current Limiter). The protection zone view is where PSPS scoping decisions or reliability projectscan be identified.-7-
The span level will be used for system hardening or VM work targeting. The asset level could be used to inform tag prioritization, asset replacementprograms and improvements in asset standards.Using this range of model layers, PG&E should be able to explore the impacts ofalternate asset management strategies and coordinate our multiple efforts to mosteffectively reduce system risk.FIGURE 4 – LAYERED RISK MODEL OUTPUTAs referenced in Table 1 of this response, these risk models will be used to informmultiple work processes, as described below.Asset ManagementAt the most granular asset level, the composite risk model would inform tagprioritization, maintenance, and asset replacement work. As mitigations are completed,the asset data represented in PG&E’s Geographic Information System (GIS) recordscan be updated as part of the existing project completion process. Subsequent modelupdates will then draw on the refreshed asset data in GIS. Our goal is to see on-goingwork reduce the consequences and probabilities of future ignitions and asset failures,with those improvements reflected in updated risk scores.-8-
System HardeningOur goal is for risk scores at the span or circuit level to identify the highest riskspans or circuits to inform targeting of system hardening projects and be able to test theimpacts of alternate strategies to reduce those risks. As hardening projects arecompleted, future composite risk model inputs (asset information) should reflect lowerresidual risk over time.Tag PrioritizationAs PG&E identifies corrective actions that require resolution, generally throughasset inspections, those corrective actions are prioritized according to severity, asdiscussed in PG&E’s response to Condition PG&E-15. Within severity levels PG&E iscurrently using a tag prioritization model to further inform the timing and priority ofrepairing tags. As noted above, PG&E will be enhancing that tag prioritization modelusing the risk scores at the span or circuit level. As corrective tags are completed, thecomposite risk model inputs (asset information) would be updated, informing real-timerisk understanding at the various levels (span, circuit, region & system) of PG&Ecomposite risk models.Vegetation ManagementPG&E is developing a vegetation risk sub-model that uses a portfolio of inputs toestimate an annual probability of ignitions, outages, and wire-down events. This isaccomplished by way of a multi-variable regression trained on past such events. Thegoal of the vegetation risk sub-model is to predict where events are more likely to occurduring the year down to the 100-square-meter level. As noted above, theseprobabilities will be combined with wildfire spread, reliability and other consequencedata sets to create MAVF risk scores at that 100-square-meter (pixel) level alongPG&E’s circuits. We should be able to use these risk scores to calculate the RSE forprogram and investment options and target the correct vegetation mitigations for eachlocation. Identified mitigations can then be grouped along circuits to maximizeefficiency. Over time the model inputs should reflect the impact of on-going EVM workand allow us to track risk draw-down over time. However, factors such as continuingvegetation growth, further ecological changes and other factors may also influenceresidual, real-time quantified risk.-9-
PSPSPG&E has developed fire potential models and outage potential models usinghistorical and meteorological datasets. PG&E’s whitepaper “Calculating Meteorologicaland PG&E Fire Risk: PG&E PSPS Decision-Making”) (see Attachment 1 forGuidance-3) details how the models were constructed and operationalized. Thesemodels are being used with live weather data today to determine the need andappropriate scope for PSPS events.PG&E evaluates the potential need for PSPS when there is an increased risk for acatastrophic fire caused by PG&E equipment. This is viewed as an increased potentialof an outage or failure leading to an ignition during a wind event, combined with theconsequence or growth potential of a resulting fire. There are two key inputs of PG&E’sanalysis to determine PSPS criteria: PG&E’s OPW model1 PG&E’s Utility FPI (Utility FPI)PG&E’s Fire Science and Meteorology team developed the OPW forecast model,which is a location-specific model that tracks the historic frequency of outages atvarying wind speeds. Wind speeds that lead to electric outages (including fromvegetation falling into lines) are not uniform across PG&E’s territory due to variations inthe localized nature of grid assets, topography, vegetation around electric facilities,drought and climatological weather exposure. For example, in general, lower windspeeds cause outages in more heavily forested areas whereas in more barren areas,outages are seen at higher wind speeds.PG&E’s Fire Science and Meteorology team developed and calibrated PG&E’sUtility FPI using a robust 30-year meteorological dataset combined with a fireoccurrence dataset for PG&E’s territory. The Utility FPI combines several factorsincluding a fire weather index (wind, temperature, and humidity), fuel moisture data(10-hour dead fuel moisture and live fuel moistures), and landcover type (grass,shrub/brush, or forest). The Utility FPI estimates the probability of a small fire becominga large fire.1The OPW is used for PSPS decision making on Distribution circuits, for transmission lines asimilar tool, called the OA model is used in the same way and combined with FPI asdiscussed.-10-
The following two images describe these two tools in more detail and indicate thecombination of factors that would contribute to the decision to execute a PSPS event(the red box on the second image).FIGURE 5 – PSPS DECISION MAKING TOOLSFIGURE 6 – PSPS DECISION MAKING SCENARIOSAs we continue to mature these PSPS decision-making tools we are evaluatingadditional tools including fire-spread modelling. A new model from Technosylvaprojects the potential consequence of fires from any ignition source. The model canproduce a spatial forecast of wildfire spread based on topology, fuels, and meteorologyand fuel moisture forecasts.-11-
iv. how it intends to incorporate future improvements in risk modeling intoinitiative prioritization and targeting processes; andv. how it intends to adapt its approach based on learnings going forward.Learnings from peers, outside experts, consultants, regulators and others will beincorporated to refine and mature existing models and to inform the development ofmodels in process. PG&E plans to improve the accuracy and capability of the individualand composite risk models described above, and adapt initiatives and processes basedoff these improvements, by assessing the precision of the models against actualoutcomes (also called precision metrics). By monitoring these precision metrics andcomparing the model output with actual results the modeling teams will continuallyimprove the accuracy of models. To the extent that actual events and causes do notalign with modeled outcomes, machine learning techniques will be employed tocharacterize these failure modes and incorporate them into the probabilistic models.Benchmarking and peer validation will also be important for model development andmaintenance as we drive for continuing improvement of both our models and our riskmanagement processes. An example, as noted above, is that PG&E has plans to shareinitial models for external peer review later this year.-12-
CONDITION PGE-1PG&E GROUPS INITIATIVES INTO PROGRAMS AND DOES NOTPROVIDE GRANULAR INITIATIVE DETAIL-13-
Deficiency: PG&E groups initiatives into “programs,” making it difficult to assess theeffectiveness as well as the cost of individual initiatives within these programs. Forexample, PG&E does not separately report undergrounding from its overall 5.1 billionsystem hardening planned spend, making it impossible to determine how much PG&Espends on undergrounding and difficult to assess the various initiatives within thisprogram. Furthermore, PG&E does not break down the outcomes or results ofindividual initiatives as required by the guidelines. For example, in Table 1, PG&E wasrequired to break down results from inspections over the past five years into each of thefollowing inspection types: Patrol inspections, Detailed inspections, and Otherinspections. PG&E reported all inspection typ
-1- Deficiency: Electrical corporations do not provide sufficient detail in their 2020 Wildfire Mitigation Plan (WMP) to demonstrate how they are leveraging risk models to target the highest risk portions of the grid