Transcription
Data Center Meteringand Resource GuideFEBRUARY 2017
1Contents1. Introduction2. Definitions2.1. PUE as a Metric2.2. Levels of PUE (1 through 3) per The Green Grid (TGG)23343. Metering Implementation3.1. Data Center Type663.2. Energy vs. Power63.3. PUE Estimation3.4. Planning6163.5. Collection of Information to Determine System Type3.6. Determination of Implementation Method16173.7. Commissioning4. Anticipated Scenarios4.1. Stand-alone Data Center4.2. Embedded Data Center181919194.3. Existing Metering System Types5. Metering Method Options5.1. General5.2. Extending/Leveraging Existing Meters5.3. Determining Metering When No Meters Are on Site6. Challenges to Meter Installation and Possible Solutions2020202020226.1. Need for Shutdowns to Install Metering6.2. Multiple Metering Systems22227. Metering Costs7.1. Rough Order of Magnitude Cost7.2. Variables242424ReferencesAnnotated References2626Additional ResourcesAppendix A: Data Center Energy Practitioner (DCEP) Program2829Appendix B: Data Center Profiler (DC Pro) Tools30Learn more at betterbuildingssolutioncenter.energy.gov
21. IntroductionData centers constitute a large and growing sector of energy use. By one estimate, they consume about2 percent of U.S. electricity, and the sector is increasing energy use by about 1 percent each year (Shehabi etal 2016). Inefficiencies in the power and cooling systems of the data center infrastructure often give datacenter owners and operators significant opportunities for energy-efficiency measures. Taking advantage ofsuch opportunities typically is very cost-effective, reducing the operating costs, and can also improve datacenter reliability.Managing and assessing energy performance requires the use of established data center energyperformance metrics, and metering is needed to provide the data for such metrics. Tracking and managingdata can inform decision makers in the following ways:1. It helps organizations identify abnormally low- or high-energy usage and potential causes,supporting such practices as peak-shaving. It also facilitates capacity planning around space andpower utilization and helps with carbon accounting and greenhouse gas (GHG) reporting.2. It helps organizations track and manage energy costs, verify energy bills, and prioritize, validate,and reduce energy costs through improved energy efficiency and energy management.3. It allows organizations to quantitatively assess data center performance and to benchmark it acrossa level playing field. Benchmarking evaluates the organization’s position relative to the rest of themarket (cross-sectional benchmarking) or over time in one data center (longitudinal benchmarking).This enables engagement with senior management and other stakeholders to participate incontinuous improvement of the organization’s energy performance.4. It helps organizations develop and validate energy-efficiency strategies and identify opportunities toimprove energy efficiency by lowering energy and operational costs. These strategies includeidentifying large energy users and establishing performance metrics (cooling plant kilowatts/ton, airhandling watts/cubic foot per minute, etc.) for monitoring and tracking.5. Energy performance metrics can also be used to commission and detect faults in physical systemsand diagnose their causes.This Guide intends to help data center owners and operators implement a metering system that allows theirorganizations to gather the necessary data for effective decision-making and energy-efficiency improvements.It also provides metering guidance to organizations considering participation and to those already participatingin the Better Buildings Data Center Challenge or Accelerator Partnerships. A successful participation as aBetter Buildings Partner requires data submission that is fully metered; partial metering or other estimates areonly appropriate for baseline data. For information on how to baseline energy use without sub-metering, seeAppendix B: Data Center Profiler (DC Pro) Tools.Learn more at betterbuildingssolutioncenter.energy.gov
3The following list describes the sections in this Guide: Section 2, Definitions, includes the Power Usage Effectiveness (PUE) metric and describes its value to users, as well as levels of PUE measurement. At a minimum, Better Buildings Partners shouldimplement metering consistent with PUE Level 1, the basic metering defined by The Green Grid(TGG). This Guide provides guidance for partners focusing on PUE Level 1.Section 3, Implementation, discusses data center types (especially stand-alone and embeddedtypes), estimates PUE for various metering scenarios, planning for and installing the meters, and theimportance of commissioning. This Guide will focus on embedded data centers with incompletemetering.Section 4, Anticipated Scenarios, covers anticipated scenarios of metering systems and how theyintegrate with data center types.Section 5, General, discusses metering methods, including leveraging existing meters, starting fromscratch, and meter types.Section 6, Challenges to Meter Installation and Possible Solutions, deals with challenges to installingand gathering data from electrical and thermal meters and how to overcome these challenges.Section 7, Metering Costs, covers order-of-magnitude metering costs and associated variables.The Appendix provides references and additional resources for readings and training.2. Definitions2.1. PUE as a Metric2.1.1. DefinitionPower Usage Effectiveness, or PUE, is a measure of how efficiently a computer data center infrastructureuses energy. Specifically, it is the ratio of total energy use to that of information technology (IT) equipment.PUE IT equipment energy includes the energy associated with all of the IT equipment (e.g., compute, storage, andnetwork equipment). Total facility energy includes all IT equipment energy as described above, pluseverything that supports the IT equipment using energy, such as: Power delivery components, including uninterruptible power supply (UPS) systems, on-site switchgear,transformers, generators, power distribution units (PDUs), batteries, and distribution losses external to the ITequipment. Cooling system components, such as chillers, cooling towers, pumps, computer room air handlers (CRAHs),computer room air conditioners (CRACs), and direct expansion air handler (DX) units. Lighting.zLearn more at betterbuildingssolutioncenter.energy.gov
42.1.2. What PUE is good for (infrastructure overhead)According to The Green Grid, “The PUE metric is associated with the data center infrastructure. It is not adata center productivity metric, nor is it a stand-alone comprehensive efficiency metric. It measures therelationship between the total facility energy consumed and the IT equipment energy consumed. It providesstrong guidance for, and useful insight into, the design of efficient power and cooling architectures, thedeployment of equipment within those architectures, and the day-to-day operation of that equipment.”2.2. Levels of PUE (1 through 3) per The Green Grid (TGG)The Green Grid defines a three-level approach for measuring PUE, which includes basic, intermediate, andadvanced measurement levels. This guide focuses on PUE Level 1, which is the basic-level measurement.PUE Level 1 is the minimum requirement for Better Buildings Challenge partners to measure and managetheir data centers. For context, PUE Level 2 and PUE Level 3 are briefly described below.Level 1: Basic MeteringThe IT load is measured at the output of the UPS equipment and can be read from the UPS front panel,through a meter on the UPS output, or, in cases of multiple UPS modules, through a single meter on thecommon UPS output bus. Note that any transformers and other electrical distribution losses between the UPSand the IT equipment are counted as IT load when using PUE Level 1.Level 2: Intermediate MeteringLevel 2 metering counts losses from the power distribution units (PDUs) as part of infrastructure and not IT.Level 2 is typically a hybrid metering solution, where most of the metered points are automatically recordedand some are recorded manually. This is different from Level 1, Basic Metering, where typically the majority orall of the points are manually read. Level 2 metering is done at the data center level and at some selectedsystem-level points. In addition to the minimum meters in Level 1, Level 2 may include certain additionalmanual recording and automated metering, such as a chiller plant meter and metering of outside airtemperature through a control system.In Level 2 metering, in addition to utility and switch gear meters that provide continuous and accumulated dataon the center’s energy use, there are meters at the chilled water plant and heating, ventilation, and airconditioning (HVAC) fans. The UPS and PDU displays can provide instantaneous data. Electrical distributionloss, which is an important factor in data center energy efficiency, can be calculated by observing the UPSand PDU displays. In this case, the derived metrics are presented as a good estimate. There are alsotemperature readings for chilled water and CRAC/CRAH (CRAC/H) air. With these data, possible measurescan be implemented to improve chiller efficiency in the chiller plant and air management inside the datacenter. It should be noted that UPS and PDU metering is typically less accurate (within a few percent ofreading) than utility meters (within 1 percent).Learn more at betterbuildingssolutioncenter.energy.gov
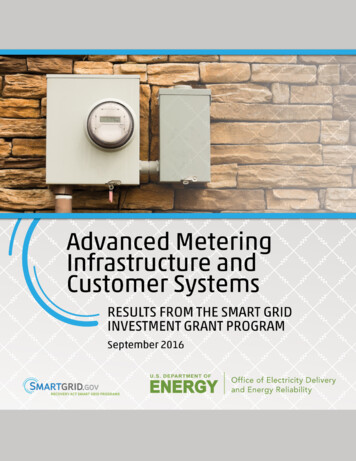
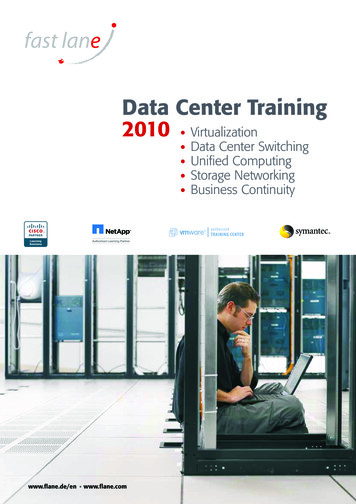
5Level 3: Advanced MeteringIn Level 3 monitoring, all points are automatically metered, with minimum dependency on potentiallyinaccurate equipment display values and manual recording. At this level, the accuracy of the metrics dependson the accuracy of the meters. The values are metered over time as opposed to being estimated from theproduct specifications or taken from manual meter readings. In this case, meters are installed to determineenergy end use, and they provide continuous and accumulated data on data center energy use. In the chillerplant, power use by chillers, pumps, and fans are metered. Electrical distribution is metered at each step,down to the UPS, PDU, and IT equipment. Power use by HVAC equipment, generator block heaters, andcooling and lighting for support rooms is metered.In Level 3 monitoring, the derived metrics are presented as a precise value. There are also temperaturereadings for chilled water, CRAC/H supply air, and rack intake air temperature. These more extensive datahelp to identify more measures that can be implemented to improve chiller plant efficiency and airmanagement inside the data center.Figure 1 illustrates the different metering levels and meter locations.Figure 1 - Different Levels of PUE (Source: NAAT, Inc.)Learn more at betterbuildingssolutioncenter.energy.gov
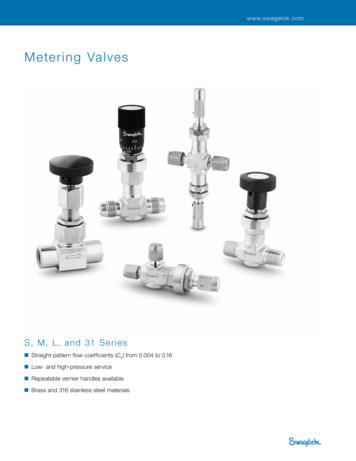
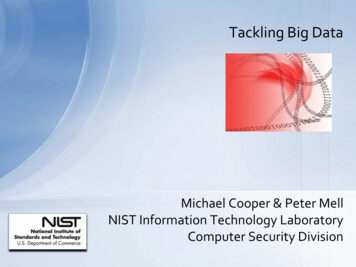
63. Metering Implementation3.1. Data Center TypeWhile this guide discusses two types of data centers—stand-alone and embedded—it focuses on embeddeddata centers.At a stand-alone data center, the incoming energy is measured from the utility electrical service entrance thatfeeds all of the electrical and mechanical equipment used to power, cool, and condition the center. If thestand-alone data center does not have its own meter, one needs to be added.In either type of data center, the power to the IT equipment is measured at the UPS output (or if there is noUPS, at the panels serving only the IT loads in the data center).When a data center is embedded in a building and served by a shared chilled-water plant, the cooling energyis measured using thermal meters, or calculated if measurement is not possible. Thermal meters are installedon the chilled water pipes serving the data center HVAC system. If the data center is served by a stand-alonecooling system (e.g. Computer Room Air Conditioners (CRACs), the CRACs should be electricallysubmetered, but again the cooling energy can be estimated. In a PUE Level 1 calculation, electricaldistribution system losses can be estimated. A typical number may be 10 percent of energy measured at theUPS output (which is the assumed IT energy use).Basic monitoring requires, at a minimum, the collection of energy measurements once a month.3.2. Energy vs. PowerEnergy is a measure of the ability to do work, and is a quantity. The most common unit for measuringelectrical energy is the kilowatt-hour (kWh); one kWh is the quantity of energy that results from one kW ofelectrical power used for one hour. Power is the rate at which energy is generated or used; the kilowatt (kW)is the most common unit for measuring electrical power.3.3. PUE EstimationFigure 2 below is a representative diagram for Level 1 metering. This is a relatively inexpensive solution thattypically relies on existing meters; however, the level of data availability and accuracy is low for derivedmetrics. M1 is for utility readings. M2 is UPS output. For stand-alone data centers, PUE Level 1 M1/M2.Learn more at betterbuildingssolutioncenter.energy.gov
7Figure 2 - Representative Diagram for Level 1: Basic MeteringNote that for PUE calculations, some of the infrastructure-related loads such as lighting and standbygenerator energy use were not considered to have significant value. Lighting energy is usually less than1 percent of the total energy and generator energy use, assuming weekly no-load and quarterly full-load testruns are less that 0.5 percent of the total energy use.Table 1 and the corresponding Figures 3 through 8 exhibit different cases and the corresponding PUEcalculation for embedded data centers where some metering (more advanced than that required by PUELevel 1) is available or can feasibly be installed. We recommend that the total electrical load to the datacenter and the thermal load imposed by the data center be measured if possible. Note that any PUE estimatebased on assumptions about cooling and power distribution efficiencies, while acceptable as a baseline, willbe less accurate and will be difficult to adjust when efficiency improvements are made to these infrastructuresystems.Learn more at betterbuildingssolutioncenter.energy.gov
8TABLE 1 – PUE CALCULATION GUIDE FOR CASES WITH ADDITIONAL METERING(IN ADDITION TO UPS OUTPUT)CaseAdditional MeteringCentral chilled water plant withor without economizer plusCRAH units in the data centerChiller plant input energyM3Central chilled water plant withor without economizer plusCRAH units in the data centerThermal energy to datacenter T1 is meteredCentral chilled water plant withor without economizer plusCRAH units in the data centerChiller plant energy M3PUE CalculationPUE [((M2/0.9) Efan) X (1 (0.285 X Eff))]/M2See Figure 3.See Figure 4.PUE [(M2/0.9) Efan (T1 X Eff)]/M2Eff (Chiller efficiency 0.2) kW/ton, where chillerefficiency can be obtained from Table 3 and 0.2represents typical additional load of chilled water andcondenser water pumps and cooling tower fans.PUE [((M4 X 1.03) Efan) X (1 (0.285 X Eff)]/M2UPS energy input ismetered M4See Figure 5.CRAC units in the data centerCRAC and condenserenergy M5PUE [M5 (M2/0.9)]/M2See Figure 6.CRAC units in the data centerCRAC and condenserenergy M5 and UPSenergy input M4PUE [(M5 M4) X 1.03]/M2See Figure 7.Central chilled water plant withor without economizer plusCRAH units in the data centerThermal energy to datacenter T1; chiller plantinput M3, and chiller plantoutput T.PUE [(M3/T) X T1 (M2/0.9) Efan]/M2See Figure 8.Notes:1. M3 is chiller plant energy (kWh) (includes the energy use of chillers, pumps and cooling tower fans).2. M2 is UPS output (kWh).3. M2/.9 is based on an assumption of 10 percent loss in electrical distribution.4. Efan is the energy used by the CRAH fans (kWh). It can be estimated using motor nameplate. Use motor horsepower x 0.746 kW/hp x 0.75 loadfactor x operating hours /motor efficiency. Actual energy measurement is preferred, especially for fans with variable-speed drives.5. Eff is chiller plant performance in kWh/integrated chiller plant load in ton-hours; overall units are kW/ton.The chiller plant load (in tons) is shown on the chiller display or (chilled water flow in gallons per minute (gpm) X ΔT in F)/24, then converted toton-hours by multiplying by the number of hours at each load. Using the equation in the table, this plant efficiency is then applied to the datacenter load to obtain the share of the plant electricity attributed to the data center.6. 0.285 is used to convert kW of heat rejection to tons of heat rejection.7. M4 is UPS input (kWh). It does not include upstream losses (utility transformer, etc.). Include losses if the data are available, otherwise, anaddition of 3 percent to the M4 reading provides an estimate of distribution losses upstream of the UPS.8. M5 is DX compressor evaporator fan power condenser fan power (kWh) (for equipment that serves only the data center).9. T1 is the thermal output of the chilled water supplied to the data center, in units of ton-hours. T is the total thermal output of the chilled water plant,in units of ton-hours.Learn more at betterbuildingssolutioncenter.energy.gov
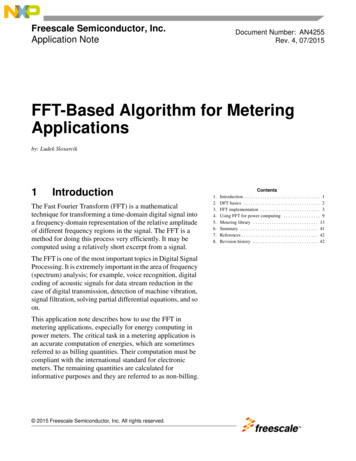
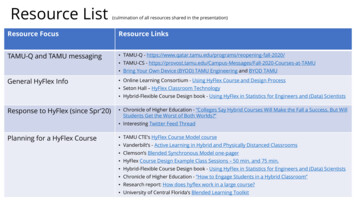
9(M3 is used to calculate: see Table 1.)Figure 3. Embedded Data Center with Additional Metering: ChillerPlant input M3.Figure 4. Embedded Data Center with Additional Metering: Chiller Plant outputto Data Center T1.Learn more at betterbuildingssolutioncenter.energy.gov
10(M3 is used to calculate: see Table 1)Figure 5. Embedded Data Center with Additional Metering: Chiller Plant input M3and UPS input M4.Figure 6. Embedded Data Center with Additional Metering: CRACs andCondensers input M5.Learn more at betterbuildingssolutioncenter.energy.gov
11Figure 7. Embedded Data Center with Additional Metering: CRACs and Condensersinput M5 and UPS input M4.Figure 8. Embedded Data Center with Additional Metering: Chiller Plant input M3, ChillerPlant total output T, and Thermal input to Data Center T1.Learn more at betterbuildingssolutioncenter.energy.gov
12For data centers that only have UPS output energy available, it is still possible to estimate PUE as shown inTable 2 and corresponding Figures 9 through 12. Again, because several assumptions must be used for suchestimates, users are strongly encouraged to install additional metering to obtain more-accurate data andgenerate easily trackable metrics.TABLE 2 – PUE CALCULATION GUIDE FOR EMBEDDED DATA CENTERS WITHOUT ADDITIONALMETERING BEYOND UPS OUTPUTCaseWater-cooled central chilled water plant plus CRAH unitsin the data center.See Figure 9.Air-cooled central chilled water plant plus CRAH units inthe data center.See Figure 10.CRAC units in the data center, with air-cooledcondensers.See Figure 11.Water-cooled chiller water plus CRAH units in the datacenter and a water-side economizer,orPUE CalculationPUE [((M2/0.9) Efan) X (1 (0.285 X Eff))]/M2In this case, Eff (Chiller efficiency 0.2) kW/ton,where chiller efficiency can be obtained from Table 3and 0.2 represents a typical additional load of chilledwater and condenser water pumps and cooling towerfans.PUE [((M2/0.9) Efan) X (1 (0.285 X Eff))]/M2In this case, Eff (chiller efficiency 0.1) kW/ton,where chiller efficiency can be obtained from Table 3and 0.1 represents a typical additional load of chilledwater pumps.PUE [(M2/0.9) X (1 (0.285 X 1.45))]/M2In this case, 1.45 kW/ton represents typical aircooled CRAC efficiency, including fans.Treat the hours in the year that chiller is operatinglike the water-cooled chillers or air-cooled chillerdiscussed in the top two rows of this table. For hoursin the year that the economizer is in active use:Air-cooled chilled water plant plus CRAH units in the datacenter and a water-side economizer.PUE [((M2/0.9) Efan) X (1 (0.285 X 0.25))]/M2See Figure 12.Where 0.25 kW/ton represents cooling systemefficiency during economizer operation.Notes:1. M2 is UPS output (kWh) from meter readings.2. M2/0.9 is based on assumption of 10 percent loss in
3.1. Data Center Type 6 3.2. Energy vs. Power 6 3.3. PUE Estimation 6 3.4. Planning 16 3.5. Collection of Information to Determine System Type 16 3.6. Determination of Implementation Method 17 3.7. Commissioning 18 4. Anticipated Scenarios 19 4.1. Stand-alone Data Center 19 4.2. Embedded Data Cen