Transcription
AHRQ National Scorecard on Hospital-Acquired ConditionsUpdated Baseline Rates and Preliminary Results 2014–2017SummaryUpdated and new patient safety data for 2014 through 2017 continue to show a downwardtrend in the annual number of hospital-acquired conditions (HACs). As reported in 2016, from2010 through 2014, the rate of HACs decreased 17 percent. New and updated data for 2014 to2016 show an 11 percent decrease. When preliminary data for 2017 are included, the decreasein HACs from 2014 to 2017 is 13 percent. From 2010 through preliminary 2017 data, theaverage annual reduction in the overall rate of HACs was approximately 4.5 percent.For the trend beginning in 2014, methods were updated and a larger portion of hospital inpatientswere included in the HAC calculations. The 2014 rate started at 99 HACs per 1,000 hospitaldischarges and is estimated at 86 HACs per 1,000 discharges for 2017. In the method previouslyused, the 2010 rate was calculated as 145 HACs per 1,000 discharges and the 2014 rate was 121HACs per 1,000 discharges. Both methods use the same 28 measures of patient safety events,including many types of hospital-acquired infections, adverse drug events, and injuries due toprocedures, as well as pressure ulcers/pressure injuries and falls.The newly established baseline of 99 HACs per 1,000 discharges in 2014 equates toapproximately 2,940,000 HACs among all hospital inpatients 18 years old and over. The updatedrate for 2017 equates to approximately 2,550,000 HACs. The final 2017 HAC rate will beupdated and recalculated in the future to take into account changes seen in seven of the HACmeasures that use ICD-10 1 data—these data will not be available until late 2019. However, thesemeasures are responsible for only 8 to 10 percent of the annual HACs measured for 2014–2017,so the final calculations are unlikely to make meaningful changes to the data.Based on the HAC reductions seen in 2015, 2016, and 2017 compared with 2014, AHRQestimates a total of 910,000 fewer HACs occurred than if the 2014 rates had persisted through2017. These HAC reductions lead to estimates of approximately 7.7 billion in costs saved andapproximately 20,500 HAC-related inpatient deaths averted from 2015 through 2017. Datareported in 2016 estimated that from 2011 through 2014, HAC reductions totaled 2.1 million,and these reductions resulted in approximately 19.9 billion in cost savings and 87,000 fewerHAC-related inpatient deaths. 2In the new and updated data for 2014–2017, not all types of HACs showed similar trends. Forexample, measured adverse drug events continued to drop from 2014 to 2017, while measuredpressure ulcers/pressure injuries increased from 2014 to 2015 and then decreased somewhat from2015 to 2016 and 2017. A similar trend was seen for physician-diagnosed catheter-associatedurinary tract infections.12ICD-10 International Classification of Diseases, 10th Revision. The ninth revision is referred to as ICD-9.See the AHRQ HAC report at -safety/pfp/2014-final.html.January 2019
Of special interest may be the apparent reduction in the rate of antibiotic-associated Clostridioidesdifficile 3 infections. Comparing these data with other sources of information, such as the Centersfor Disease Control and Prevention (CDC) and the AHRQ Healthcare Cost and Utilization Project(HCUP), may help us determine if efforts to reduce the occurrence of this important HAC areeffective at the national level.The new baseline of 99 HACs per 1,000 discharges was established and calculated for 2014 tomonitor the progress of the Department of Health and Human Services (HHS) goal to reduceHACs by 20 percent from 2014 to 2019. This goal is specifically tied to the Centers for Medicare& Medicaid Services’ Hospital Improvement Innovation Networks, which work collaborativelywith Federal and private partners to achieve this bold aim and build on prior successes.AHRQ estimates that if the 20 percent HAC reduction goal were achieved, the HAC rate in2019 would be 79 per 1,000 discharges. That means approximately 1.8 million fewer HACswould occur compared with the number that would have occurred if HAC rates for 2015through 2019 had stayed the same as in 2014. If a 20 percent reduction were to occur in eachtype of HAC measured, AHRQ projects that these 1.8 million fewer HACs would beassociated with 19.2 billion in cost savings and 53,000 fewer deaths from 2015 through 2019.The results reported above through preliminary 2017 data are not inconsistent with achievingthe 20 percent HAC reduction goal for 2019.Detailed ResultsThe new 2014 baseline for the national HAC rate (NHR) is 99 HACs per 1,000 discharges.Exhibit 1 shows the details. Clostridioides difficile Infections is italicized because it was addedas a “focus” HAC for reduction efforts and tracking for 2014 through 2019. Clostridioidesdifficile infections were previously tracked in the “All Other HACs” measure, a collection of13 other types of HACs. Methods used to calculate the NHR are provided in Appendix 1, andall the measures used in the NHR are shown in Appendix 2, Exhibit A2c.Exhibit 1. New 2014 national HAC rate baseline (rounded), updated January 2019Hospital-Acquired ConditionAdverse Drug EventsCatheter-Associated Urinary TractInfectionsCentral Line-Associated BloodstreamInfectionsClostridioides difficile InfectionsFallsObstetric Adverse EventsPressure Ulcers/Pressure InjuriesSurgical Site Infections2014 Measured Baselinefor HACs1,001,000170,0002014 Total HACs per1,000 73,0002.98.02.321.82.53Clostridium difficile has been changed to Clostridioides difficile. More information is available athttps://www.ncbi.nlm.nih.gov/pubmed/27370902 and https://www.cdc.gov/hai/organisms/cdiff/cdiff infect.htmlAHRQ National Scorecard on Hospital-Acquired Conditions2
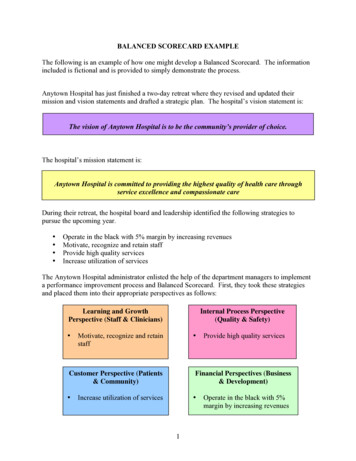
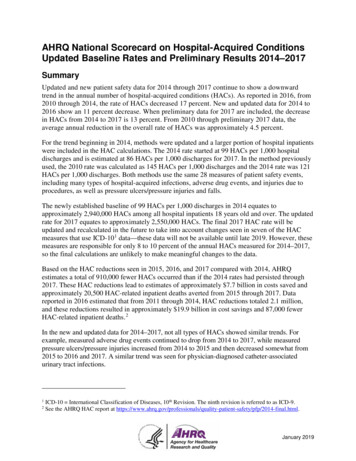
Hospital-Acquired ConditionVentilator-Associated Pneumonias(Post-op) Venous ThromboembolismsAll Other HACsTotal2014 Measured Baselinefor HACs36,00025,000584,0002,940,0002014 Total HACs per1,000 Discharges1.20.919.699The new baseline established with the 2014 data was developed using a new method that wasbased on the method previously used to calculate the 2010-2014 NHR. 4 The major differencebetween the new method and the previous method is that the new method includes patient chartsfor most conditions treated in acute care hospitals.Previously, the Medicare Patient Safety Monitoring System (MPSMS) used patient charts fromonly four groups of patients. Three were represented by the principal diagnosis (acute myocardialinfarction [AMI], congestive heart failure [CHF], and pneumonia [PN]). The other comprisedmajor surgery patients, as described by the Surgical Care Improvement Project [SCIP]). Thesegroups were used to calculate the 2010–2014 NHR. With the new method, charts for conditionsother than AMI, CHF, PN, and SCIP were sampled as a single group, starting with 2014, thusproducing five sets of inpatient charts.The 2015 rate is 92 HACs per 1,000 discharges, and 2016 and preliminary 2017 rates are 88 and86 HACs per 1,000 discharges, respectively (Exhibit 2). Also shown is the goal for 2019, 79HACs per 1,000 discharges, which is a 20 percent reduction from the 2014 baseline NHR of 99.Detailed information on the number of HACs from 2015 to 2017 (preliminary) is shown inAppendix 2, Exhibit A2c.Appendix A2e shows how the current NHR, which starts in 2014 and will be tracked at leastthrough 2019, compares with the NHR trended for 2010 to 2014. The 2010 to 2014 reductionwas 17 percent over 4 years, and the 2014 to 2019 goal is a 20 percent reduction over 5 years.Appendix 3 shows the details of the HAC reductions, cost savings, and inpatient mortalityreductions that are projected based on meeting this goal, which total 1.8 million HACs, 19.2billion, and 53,000 lives. Appendix 4 describes changes in the samples used for the 2014–2017analyses, compared with the 2010–2014 analyses.4See the report at AHRQ National Scorecard on Hospital-Acquired Conditions3
Exhibit 2. Re-baselined 2014 data, with 2015, 2016, and preliminary 2017 national HAC rate data,and 2019 HAC goalExhibit 3 provides the same information as Exhibit 2, but in table form that provides more detailson the combined results to date, based on 2015 and 2016 data and preliminary data for 2017,compared with the 2014 baseline.AHRQ National Scorecard on Hospital-Acquired Conditions4
Exhibit 3. Re-baselined 2014 data, with 2015, 2016, and preliminary 2017 national HAC rate data,and percent change through preliminary 2017dataHospital-AcquiredConditionAdverse DrugEventsCatheterAssociated UrinaryTract InfectionsCentral ifficile InfectionsFallsObstetric AdverseEventsPressure Ulcers/Pressure InjuriesSurgical op) VenousThromboembolismsAll Other HACsTotals (rounded)PercentPreliminary Change in2014201520162017HACs, 2014Measured Normalized Normalized Normalizedvs.BaselineCount ofCount ofCount ofPreliminaryfor HACsHACsHACsHACs201733.730.027.124.2-28%2019 Goal(20%Reductionof 88817.286-12%-13%15.779With the overall HAC reductions described above, and based on new per-HAC cost andmortality estimates updated in 2017 (see Appendix 5), we project that over 2015–2017, therewere approximately 7.7 billion in cost savings and 20,500 fewer deaths associated with HACs.These projections are tabulated in Exhibit 4. In 2017, AHRQ released a special report on costsand inpatient mortality due to HACs. 5Appendix 5 shows the summary cost and mortality associated with each of the 10 focus HACtypes, and the full report from which this table is excerpted is available on the AHRQ website.5The cost and mortality for “all other HACs” was not estimated in this report and was estimatedbased on a weighted average of the 10 focus HACs, with the weighting based on the proportionof each of the 10 focus HACs in the 2014 baseline data.5This report is available at port2017.pdf.AHRQ National Scorecard on Hospital-Acquired Conditions5
Exhibit 4. Projected cost savings and deaths averted due to HAC changes to date from 2015through preliminary 2017 data, compared with 2014 baselineAdverse Drug EventsCatheter-Associated UrinaryTract InfectionsCentral Line-AssociatedBloodstream InfectionsClostridioides difficileInfectionsFallsObstetric Adverse EventsPressure Ulcers/PressureInjuriesSurgical Site InfectionsVentilator-AssociatedPneumoniasVenous ThromboembolismsAll Other HACs (not includingClostridioides difficileInfections)Totals From Annual Changesin HACs, HAC-Related Costs,and DeathsTotal Change in HACs,2015, 2016, andPreliminary 2017 DataCompared With 2014-585,00012,000Estimate of TotalChange in HACRelated Costs- 3,360,000,000 170,000,000Estimate ofTotal Change inHAC-RelatedDeaths-7,000400-9,000- 420,000,000-1,300-54,000- 920,000,000-2,400-43,000-9,000119,000- 290,000,000- 10,000,000 1,720,000,000-2,100-1004,9000-23,000 0- 1,100,000,0000-3,300-22,000-293,000- 390,000,000- 3,130,000,000-1,000-8,700-910,000- 7,730,000,000-20,500Note: Totals are rounded and thus may not reflect the total obtained by adding the individual cells.Detailed Goals for 2019Achieving the goal of a 20 percent reduction in HACs (going from 99 to 79 HACs per 1,000discharges; see Exhibit 3) would result in approximately 1.8 million fewer HACs in the years from2015 to 2019. With constant annual reductions toward a 20 percent reduction across all measuredHACs, and based on the new per-HAC estimates for costs and mortality from the 2017 studyfunded by AHRQ (see Appendix 5), our projections indicate approximately 19.2 billion in costsavings for the 5 years and 53,000 HAC-related deaths averted. These data are tabulated inAppendix 3.Data reported in late 2016 estimated that for the 4 years from 2011 through 2014, HACreductions totaled 2.1 million compared with 2010 baseline data. These reductions resulted inapproximately 19.9 billion in cost savings and 87,000 fewer HAC-related inpatient deaths. 66See report at -safety/pfp/2014-final.html.AHRQ National Scorecard on Hospital-Acquired Conditions6
Looking AheadIn spite of the volume and velocity of data flowing into and through healthcare, providers, healthsystem leaders, and other stakeholders lack sufficient information to guide their efforts as theywork to prevent HACs. Similarly, patients’ choices often occur without the robust informationthey need, and this limitation constrains their efforts to be engaged in their own care.In addition, numerous other unmet needs must be addressed to continue preventing HACs andsustain the improvements documented in this report. In particular, we must continue to advancepatient safety measurement, expand the evidence base for patient safety improvement strategies,and create resources to help providers and the healthcare workforce improve patient safety at thepoint of care.For example, it is critically important that we continue to drive innovation that efficientlyharnesses the full potential of data and measurement. AHRQ’s patient safety measurementprojects, including QSRS, are making progress by moving information closer to points of carewhere it can support providers and the safer care that all stakeholders want to achieve.A powerful foundation of knowledge about how to improve patient safety has been establishedover more than two decades of AHRQ-funded research and implementation projects, and, if wewant to use this knowledge to address persistent patient safety challenges, it is crucial to pair itwith capabilities that help clinicians and other healthcare workers reliably measure patient safetythreats. When providers trust information they receive about patient safety, they are in betterpositions to understand these ongoing problems and to effectively prioritize and target them withsafer practices. QSRS is being developed in part to serve this purpose by providing informationthat clinicians and other healthcare workers will trust and use to improve safety.AHRQ and other HHS agencies recognize that improving the safety and quality of healthcare isthe ultimate purpose of measurement systems, and the ability to support this improvementeffectively and efficiently is a desirable characteristic of these systems. AHRQ and CMS areusing the MPSMS as the primary system to measure the NHR, but AHRQ has been working withCMS and other Federal partners, contractors, and other experts to develop the Quality and SafetyReview System (QSRS), an improved system to succeed MPSMS.The QSRS has been developed and is undergoing use in the Clinical Data Abstraction Center,pilot testing at non-Federal settings, 7 and refinement pursuant to the goal of supporting safe,high-quality care. QSRS has been designed as a robust measurement platform that will serve theshared needs of different healthcare stakeholders.7See -safety/qsrs/index.html and tioniii-2016-summaries.pdf.AHRQ National Scorecard on Hospital-Acquired Conditions7
QSRS is designed to provide up-to-date national HAC rates, including rates of some additionaltypes of HACs not currently measured with MPSMS, the AHRQ Patient Safety Indicators(PSIs), the Centers for Disease Control and Prevention National Healthcare Safety Network(NHSN), or other sources of information concerning patient safety in hospitals. It has beendeveloped so that non-Federal entities, including hospitals and healthcare systems, will be ableuse it to measure patient safety.QSRS will allow assessment of safety for new patient populations not currently captured byMPSMS, which was originally designed to focus on adverse events experienced by Medicarepatients. In addition, QSRS will allow organizations to consider aligning their local patient safetymeasurements with the same methods and measures used at the national level. Standard methodsfor measurement, such as those in QSRS, have been a valuable component of other healthcareimprovement initiatives, including some that have addressed more specific safety challenges.The AHRQ Common Formats for Surveillance 8 serve as the underlying content that provides thefoundation of QSRS measures and cover a broad range of common and uncommon threats topatient safety. Development and revision of the Common Formats for Surveillance and QSRSare ongoing processes that include structured review and public feedback facilitated by theNational Quality Forum. After release of QSRS, AHRQ will rely on feedback, especially fromusers, to inform the development of new versions of the Common Formats for Surveillance andfor QSRS. This process will enable the Common Formats and QSRS to keep pace with users’needs and the emerging scientific evidence base for patient safety and quality improvement.Some data needed for patient safety measurement may be increasingly available from electronichealth records. AHRQ continues to explore the feasibility of automated approaches to dataabstraction 9 in order to further improve efficiency and reduce burden while maintaining thevalidity of QSRS and enhancing its ease of use. These include the AHRQ Common Formats forSurveillance, a subset of the AHRQ Common Formats. 108More information is available at https://www.psoppc.org/psoppc web/publicpages/surveillancecommonformats.See publication in the Journal of Patient Safety online at: https://www.ncbi.nlm.nih.gov/pubmed/28671914. A newstudy and report is currently in preparation and is expected to be complete later this year.10More information is available at www.pso.ahrq.gov/common/development.9AHRQ National Scorecard on Hospital-Acquired Conditions8
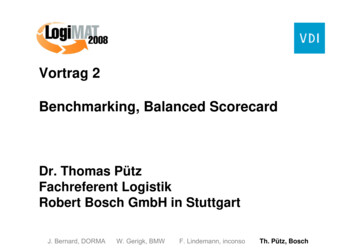
Appendix 1. Method To Estimate the Baseline 2014 National HospitalAcquired Condition RateThis document describes the methods AHRQ has developed to estimate the national rate ofHACs for 2014 to 2019, which has a goal of a 20 percent reduction in HACs. The estimateincludes a wide variety of adverse events, including the 10 HACs selected for special focus byCMS as part of the programs to achieve the 20 percent reduction, as well as several other HACs.Collectively, 28 specific measures are used (Exhibit A1a): 15 measures to generate rates for the10 specific focus HACs and 13 measures to generate a summary rate for “all other” HACs. Ofthe 28 measures, 21 are from the MPSMS, 6 are from the PSIs, and 1 is based on NHSN data.Exhibit A1a. Measures used to estimate the national HAC rateHAC TypeAdverse Pressure UlcerSurgical SiteInfectionVAPVTEAll MSMPSMSMPSMSMPSMSMPSMSMPSMSMPSMSPSIMeasureADE Associated With DigoxinADE Associated With Hypoglycemic AgentsADE Associated With IV HeparinADE Associated With LMWH and Factor Xa InhibitorADE Associated With WarfarinCatheter-Associated Urinary Tract InfectionsClostridioides difficile InfectionsBlood Stream Infections Associated With Central Venous CathetersIn-Hospital Patient FallsOB Trauma in Vaginal Delivery With (PSI 18) and Without Instrument(PSI 19)MPSMSNHSNHospital-Acquired Pressure Ulcers/Pressure InjuriesSSIs for 17 procedures w/CDC SCIP 5 PSMSMPSMSPSIPSIPSIPSIVentilator-Associated PneumoniaPostoperative Venous Thromboembolic EventsFemoral Artery Puncture for Catheter Angiographic ProceduresAdverse Event Associated With Hip Joint Replaceme
AHRQ National Scorecard on Hospital-Acquired Conditions 4 . Exhibit 2. Re-baselined 2014 data, with 2015, 2016, and preliminary 2017 national HAC rate data, and 2019 HAC goal Exhibit 3 provides the same information a