Transcription
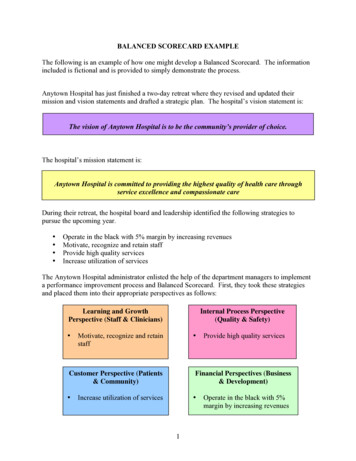
BALANCED SCORECARD EXAMPLEThe following is an example of how one might develop a Balanced Scorecard. The informationincluded is fictional and is provided to simply demonstrate the process.Anytown Hospital has just finished a two-day retreat where they revised and updated theirmission and vision statements and drafted a strategic plan. The hospital’s vision statement is:The vision of Anytown Hospital is to be the community’s provider of choice.The hospital’s mission statement is:Anytown Hospital is committed to providing the highest quality of health care throughservice excellence and compassionate careDuring their retreat, the hospital board and leadership identified the following strategies topursue the upcoming year. Operate in the black with 5% margin by increasing revenuesMotivate, recognize and retain staffProvide high quality servicesIncrease utilization of servicesThe Anytown Hospital administrator enlisted the help of the department managers to implementa performance improvement process and Balanced Scorecard. First, they took these strategiesand placed them into their appropriate perspectives as follows:Learning and GrowthPerspective (Staff & Clinicians) Internal Process Perspective(Quality & Safety)Motivate, recognize and retainstaff Customer Perspective (Patients& Community) Provide high quality servicesFinancial Perspectives (Business& Development)Increase utilization of services 1Operate in the black with 5%margin by increasing revenues
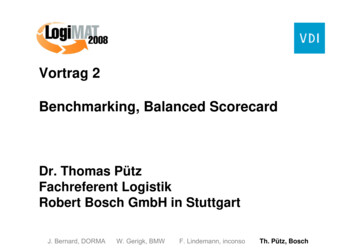
NOTE: Once strategies are categorized according to the four perspectives, if there areimbalances, determine if they are significant and either add or remove strategies accordingly.The next step is to determine the causal linkages between the strategies and develop a strategymap to visually portray how your strategies support your mission and vision. One of the primaryreasons for developing a strategy map is that it should clearly communicate the connectionbetween strategies and mission and is an excellent communication tool. The following isAnytown Hospital’s strategy map.MISSION: Anytown Hospital is committed to providing the highest quality of health carethrough service excellence and compassionate careFinancial Perspectives (Business & Development)Operate in the black with 5% margin by increasing revenuesRESULTS INCustomer Perspective (Patients & Community)Increase utilization of servicesRESULTS INInternal Process Perspective (Quality & Safety)Provide high quality servicesRESULTS INLearning and Growth Perspective (Staff & Clinicians)Motivate, recognize and retain staff2
Once you have your strategy map, you can start identifying what actions you will take to achievestrategies and how you will measure the progress in accomplishing each strategy. The followingare a few examples of actions you might implement under each strategy and two measures thatcould be used to track accomplishment of each strategy. For purposes of this example, both a lag(historical performance) and a lead (predictor of future performance) indicator are used.Learning and Growth Perspective (Staff & Clinicians):Motivate, recognize and retain staffACTIONS:Develop performance based compensationDevelop peer recognition programReview/update salary/benefits to ensure competitivenessMEASURES:Employee satisfaction (lag indicator)Turnover rate (lead indicator)Internal Process Perspective (Quality & Safety):Provide high quality servicesACTIONS:Review ER patient flow process and streamlineReview ER staffing to ensure adequacyImplement automated pharmaceutical dispensingMEASURES:% ER patient triaged within 15 minutes of arrival (lead indicator)Medication errors per dose (lag indicator)Customer Perspective (Patients & Community):Increase utilization of servicesACTIONS:Implement customer serviceImplement marketing planMEASURES:Patient satisfaction in 95%-tile (lag indicator)Average daily census (lead indicator)3
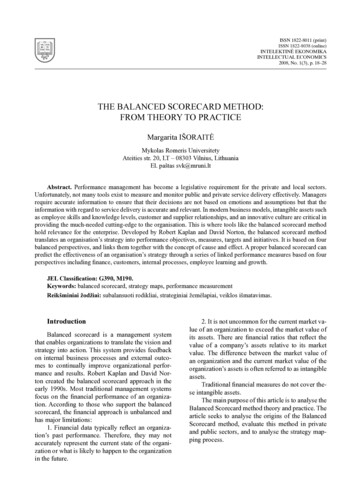
Financial Perspectives (Business & Development):Operate in the black with 5% margin by increasing revenuesACTIONS:Review billing and collections processes for accuracy and timelinessDevelop incentive program for AR staffMEASURES:Net revenue increase over prior year (lag indicator)Decrease net days in accounts receivable (lead indicator)Once the measures are identified, you’ll need to determine whether the data is currentlyavailable or will need to be collected. For example, you may already have data onemployee terminations that could be used to calculate turnover rate on a monthly basis bydepartment. You may have to purchase or design employee or patient satisfactionsurveys to solicit their input. Employee surveys can be completed quarterly or annuallyand patient satisfaction surveys could be ongoing.After data sources have beenidentified, the team(administrator/departmentmanagers) should assignresponsibility for the collection ofthis data. Individuals within thebusiness office would probablycollect the net revenue and ARdata; someone who manageshuman resources or salary/payrollfunctions might be responsible forcollecting data on turnover rates oremployee satisfaction; theindividual responsible for qualityassurance or improvement mightbe responsible for collecting dataon ER triage time or medicationerrors; etc. (see example to right)EXAMPLEThe human resource manager could set up a simpleexcel spreadsheet that contains total employees bydepartment by month and terminations (both voluntaryand involuntary) within each department. A ratio of # ofterminations divided by total employees per departmentcould be calculated easily and tracked each month. Thatdata could be aggregated for the entire facility as well.If, for example, you have a large number of voluntaryterminations (people are quitting), you could determinein which department these tend to occur and implementexit interviews to determine cause. If the terminationsare involuntary (people are fired), you might want toreview the reasons for termination and/or the hiringpractices to make sure the best candidates are beinghired.Assignments should be made to anindividual to collect data, and the team should establish timelines for collection, deadlinesfor reporting, targets (what you hope to achieve) and report formats. Using the exampleabove, at the end of each month, the HR manager gets the employee data from whoeverprocesses payroll and enters it into the spreadsheet. He/she then generates a chartshowing the trends. Refer to Figure 1. The deadline for completion of this task isestablished at the 5th of each month, the target is established at “0%” or no turnover, and4
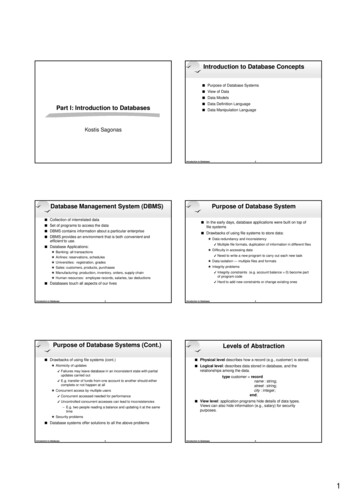
the HR manager is responsible for submitting the data to the team in the agreed uponformat.Figure 1Each responsible individual is given the task of collecting the data, analyzing the data,and reporting the data back to the team. The team can then discuss options, modifyactions or activities intended to achieve strategies, or just keep tabs on progress.A Balanced Scorecard could be put together by simply including each report generatedby the team members or designated individuals. On the following page is a simplifiedreport of four measures – employee turnover, percentage of patients seen in ER within 15minutes, patient satisfaction, and average days in accounts receivables. For each chart,the target is included. This example of a Balanced Scorecard is oversimplified but itdoesn’t need to be anymore complicated than a few charts with relevant data. Thisinformation can be collected, stored, analyzed, and reports generated in Microsoft Officeproducts or other similar software products.5
6
A Balanced Scorecard could be put together by simply including each report generated by the team members or designated individuals. On the following page is a