Transcription
International Journal of Accounting Information Systems 16 (2015) 1–22Contents lists available at ScienceDirectInternational Journal of AccountingInformation SystemsData visualization for fraud detection:Practice implications and a call for future researchWilliam N. Dilla a,⁎, Robyn L. Raschke babDepartment of Accounting Iowa State University, USADepartment of Accounting University of Nevada, Las Vegas, USAa r t i c l ei n f oArticle history:Received 8 June 2012Received in revised form 7 January 2015Accepted 11 January 2015Available online 27 January 2015Keywords:Fraud detectionVisual analyticsInteractive data visualizationDecision aidsCognitive fit theorya b s t r a c tAnalysis of data to detect transaction anomalies is an important frauddetection procedure. Interactive data visualization tools that allow theinvestigator to change the representation of data from text to graphicsand filter out subsets of transactions for further investigation havesubstantial potential for making the detection of fraudulent transactionsmore efficient and effective. However, little research to date has directlyexamined the efficacy of data visualization techniques for fraud detection.In this paper, we develop a theoretical framework to predict when andhow investigators might use data visualization techniques to detectfraudulent transactions. We use this framework to develop testablepropositions and research questions related to this topic. The paperconcludes by discussing how academic research might proceed ininvestigating the efficacy of interactive data visualization tools forfraud detection. 2015 Elsevier Inc. All rights reserved.1. IntroductionFraud investigators have recently recognized the importance of data visualization for fraud detection, andare starting to implement this technique in practice (Deloitte, 2011; Clopton et al., 2014). Data visualization isespecially important in the early stages of fraud investigation, where the investigator is attempting to performan efficient and effective data analysis and desires to better understand the relationships that may be presentin a complex data set. The fraud investigator may employ data visualization as a proactive detection approach,using it to search for data patterns that suggest fraudulent activity (Albrecht et al., 2012). Alternately, theinvestigator might be evaluating a predication of fraud, using data visualization to develop a fraud theory⁎ Corresponding author at: 2330 Gerdin Business Building, Iowa State University, Ames, IA 50011-1350, USA. Tel.: 1 515 294 1685.E-mail address: wdilla@iastate.edu (W.N. 011467-0895/ 2015 Elsevier Inc. All rights reserved.
2W.N. Dilla, R.L. Raschke / International Journal of Accounting Information Systems 16 (2015) 1–22that is subsequently used to select additional investigative procedures (Wells, 2003). In either case, the investigator is following a hypothesis testing approach, developing preliminary hypotheses about fraud and analyzing relevant data to see if they appear to be true. If the data analysis phase of a fraud investigation doesnot support the hypothesis that fraud has occurred, then the investigation ends. On the other hand, if dataanalysis produces results consistent with the hypothesis that fraud has occurred, the investigator will proceedto conduct other investigative procedures, such as examination of documents and interviewingpossible witnesses (Wells, 2003).Since fraudulent actions are deliberate and non-random, traditional audit methods involving the use ofstatistical sampling are often ineffective for discovering fraud. Hence, fraud examination professionalsrecommend the use of data mining procedures for detecting fraudulent transactions (Kranacher et al.,2011; Albrecht et al., 2012). In performing data mining procedures, investigators may brainstormabout possible irregularities that could occur in the business processes or transactions they are examining.Alternately, they may have been given a predication that fraud has occurred. Regardless of whether they identifypossible fraudulent activity through brainstorming or receive a predication of fraud, investigators then outlineways that the schemes might show up in data patterns. For each indicator thus identified, investigators designa data mining query or procedure intended to identify whether there are individual transactions that need tobe examined more closely.Audit software packages such as ACL and IDEA facilitate data mining for fraudulent transactions withinorganizations (Lanza, 2004). Additionally, custom-designed software may be used to identify items for furtherinvestigation in complex, high-risk transaction environments (e.g., Chang et al., 2008; Pryke, 2010). However,interpreting the output from these tools may require considerable skill, as anomalies in data may not be readilyapparent, except to the expert investigator. Graphical analysis may facilitate identifying suspicious patterns oftransactions in data (Lanza, 2005a). While spreadsheet programs can facilitate graphical analysis, such analysiscan be cumbersome—if the user wants to change the variables being graphed or focus on a subset of the data, itis usually necessary to generate a new graph. Interactive data visualization programs that allow the user tomore easily change the data being graphed or its format have now become readily available (e.g., CentrifugeSystems, Inc., 2015; SAP, 2010; Tableau Software, 2010; TIBCO, 2010). Given the potential for interactivedata visualization to assist investigators in seeing and understanding data patterns that are consistent withfraudulent activity, forensic accounting practitioners have recently recommended the use of this technologyas an investigative tool (Deloitte, 2011; Clopton et al., 2014).Proponents of data visualization software contend that it facilitates better decisions by supporting visualthinking. For example, data visualization consultant and author Stephen Few states that“Visual analysis software allows us to not only represent data graphically, but to also interact withthose visual representations to change the nature of the display, filter out what's not relevant, drill intolower levels of detail, and highlight subsets of data across multiple graphs simultaneously. This makesgood use of our eyes and assists our brains, resulting in insights that cannot be matched by traditionalapproaches (Few, 2007).”Further, the developers of Tableau Software claim that“Genuine data visualization supports visual thinking. The human brain can process a picture much fasterthan a table of numbers. The right presentation, using the best practices of information visualization,makes organizing and understanding information simple. Features, trends and outliers show up theway they never do in rows and columns (Tableau Software, 2010).”While these statements make a plausible argument for why data visualization software might facilitatedetecting fraudulent transactions, research evidence suggests that the efficacy of interactive graphicaldisplays for decision making depends on task and user characteristics (Lurie and Mason, 2007; Baker et al.,2009; Dilla et al., 2010; Yigitbasioglu and Velcu, 2012). To date, little research has examined whether and howdata visualization software might allow investigators to see patterns in data that are indicative of fraudulentactivity. Conducting research on this topic is important, given that there are substantial training costs associatedwith adopting data visualization software, and it is important that practitioners know under what circumstancessuch software might facilitate more efficient and effective detection of fraudulent transactions. Therefore, the
W.N. Dilla, R.L. Raschke / International Journal of Accounting Information Systems 16 (2015) 1–223objectives of this paper are to describe data visualization techniques, discuss how they might be useful indetecting fraudulent transactions, and build a framework that identifies opportunities for futureresearch.The remainder of this paper is organized as follows. First, we describe data visualization techniques andprovide an example of how they might be applied to detect fraudulent transactions. Second, we identifyand describe areas where data visualization techniques might be applied to facilitate detecting fraudulenttransactions. Third, we present a framework for investigating factors that affect the efficacy of data visualizationtechniques for detecting fraudulent transactions and use this framework to develop testable propositions andresearch questions. The paper closes with a summary and discussion of implications.2. Data visualization techniques2.1. OverviewWe use the term data visualization to refer to the “use of computer-supported, interactive, visualrepresentations of data to amplify cognition, or the acquisition and use of knowledge” (Card et al.,1999, 6). Throughout this paper, we assume the use of interactive data visualization techniques. Incontrast to static data visualization, interactive data visualization enables decision makers to specifythe format used to display information (i.e., interactive visual representation), select the informationthey view as most relevant for decision making (i.e., interactive selection), or both (Dilla et al., 2010).Thus, interactive data visualization is an “on demand” visualization process that allows decision makersto navigate to selected data and display it at various levels of detail or in various formats.We adapt Yi et al.'s (2007) taxonomy of data interaction techniques to further describe the varioustools used to select data views and change the manner in which data are represented. As shown inTable 1, interactive data representation tools allow decision makers to change the encoding of data(i.e., from tables to graphs or vice versa), reconfigure displays of graphical data, and connect data itemsin large or complex displays. Data selection tools perform functions such as selecting and marking dataitems of interest for further examination, changing the level of elaboration (i.e., altering the data viewfrom an overview down to details of individual cases) or abstraction (i.e., shifting the view from individualcases back to an overview), filtering data through query tools, and exploring a large set of data throughhyperlinks or visual panning techniques.Table 1Interactive data visualization techniques (adapted from Yi et al. (2007)).TechniqueDefinitionRepresentation toolsEncodeShow different representations ofdata.ReconfigureShow different arrangements ofdata.ConnectShow related data items.Data selection toolsSelectMark data items of interest.Elaborate/abstractFilterShow more or less detail.ExploreShow other data.Show data based on specificcondition(s).ExampleConvert tabular representations to graphs or vice versa. Change graph type(e.g., from pie chart to histogram).Adjust baselines or axis scales, reverse attributes displayed on x- and y-axes.View leveled set of data flow diagrams or entity relationship diagrams.Highlight patterns in complex transaction data.Highlight selected items in large spreadsheets or graphical displays.Item remains highlighted, so it can be located even after rearranging the display.Move cursor over screen to view more or less detailed information(e.g., show data underlying a segment of a graphical display).Query tools embedded in database and spreadsheet products, enterprisecomputer programs (e.g., Oracle, SAP, PeopleSoft), or specialized audit programs(e.g., ACL, IDEA).Panning or movement of cursor across a graphical display to view differentsegments of a display. Clicking on hyperlinks to navigate within large, complextextual documents.
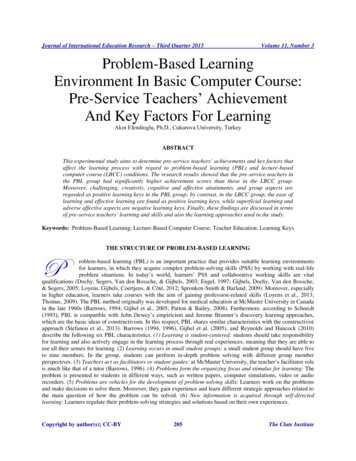
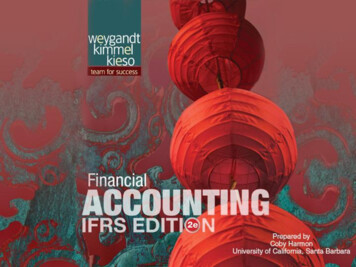
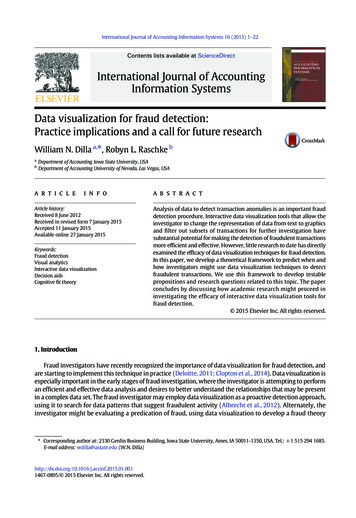
4W.N. Dilla, R.L. Raschke / International Journal of Accounting Information Systems 16 (2015) 1–222.2. Fraud detection examplesWe use two cases to illustrate how data visualization techniques might be used in data mining to identifyfraudulent transactions. The first case is adapted from Albrecht et al. (2012, 196) and involves an investigationof purchasing practices at a janitorial services company.1 The second case involves detection of moneylaundering activity at a large commercial bank (Chang et al., 2008). The cases represent two different levelsof complexity. The purchasing investigation case is typical of a relatively simple transaction analysis taskthat might be addressed by downloading data into a commercially available interactive viewing program,then analyzing it. The money laundering case involves analyzing complex transaction patterns in a verylarge data set. Therefore, it requires the use of a custom-developed software package designed specificallyfor this problem.The investigator in the purchasing investigation case (Albrecht et al., 2012, 196) has two major concerns:(1) an employee or employees may have developed inappropriate relationships with vendors and arepurchasing supplies at above market price and (2) an employee or employees may be generating paymentsto a fictitious entity by using a name very similar to that of a real vendor. In the first step of this analysis,the investigator imports transaction data into an interactive data viewing program and generates a textualsummary of purchases tabulated by vendor and purchaser (See Fig. 1—Panel A). The textual display immediatelysuggests that one vendor (José) may be generating payments to a fictitious entity by using a name very similar tothat of a real vendor. By changing the representation of data from a table to a graph (See Fig. 1—Panel B), one canalso see that two purchasers have rather large proportions of purchases from individual vendors (José fromMaster Cleaning Supply and Sally from Cleaners R Us). To further explore relationships between vendors andpurchasers, the investigator may decide to change the graphical representation of a data from a bar graph to ascatterplot (See Fig. 1—Panel C). This allows one to see that purchases made by Jose from Master Cleaning Inc.and Master Cleaning Supply and by Sally from Cleaners R Us have a substantially higher total dollar amountper transaction than the other observations, which tend to cluster around the trend line for number of recordsprocessed and total dollar amount purchased. Returning to the bar graph representation, the investigator mayfurther disaggregate the purchase data, displaying it by purchaser, vendor, and product to determine if purchasesof a specific item are causing the observed anomalies. The resulting display suggests that José has madean unusually large amount of industrial push broom purchases from Master Cleaning Supply and MasterCleaning Inc. and Sally has made an unusually large amount of 30 count trash bag purchasesfrom Cleaners R Us. The data visualization software also allows one to see the details of total purchasesunderlying any rectangle on the graph through a simple abstract/elaborate tool. By right-clicking on agraph rectangle, one can filter and view transactions related to the rectangle and sort these accordingto a variable of interest, as shown with Sally's purchases of 30 count trash bags from Cleaners R Us, sortedby unit price (Fig. 1—Panel E).In summary, this relatively simple review of purchasing data for fraudulent transactions involves at leastfive of the interactive data visualization techniques described in Yi et al. (2007). The encode tool allows one tochange textual to graphical representations and vice versa. It also allows one to shift among different graphicalrepresentations, for example, from a bar graph to a scatterplot. By moving the cursor over items of interest ona graph, the user may select the item for further examination and elaborate, or show more detail underlyingthe item. At the same time, one can filter the data to show a textual display of data related to an item orcategory of interest. While not shown in Fig. 1, the reconfiguration tool would also be helpful in this case,for example, if the investigator wanted to change the graph in Fig. 1—Panel B to show columns for each vendorwith different colored blocks for each purchaser. The advantage of interactive data visualization software foridentifying data patterns suggestive of fraud is that it allows one to change representations and explore dataon a single platform. Otherwise, the investigator would need to use multiple platforms, i.e., extracting datausing an audit software program, then exporting it to a spreadsheet program for graphical analysis.The money laundering detection application described in Chang et al. (2008) illustrates additionalvisualization techniques (See Fig. 2—Panel A.). The data used in this application contain a variety ofnumeric and textual cues such as sender and receiver identities, transaction frequency and amount,and keywords used by sender and receiver. The investigator uses a custom-designed visualization page1One of the authors adapted the data downloaded from the book's web site at http://www.cengage.com for this example. Tableau Software(2011) Version 6.0 was used to develop the example analysis.
W.N. Dilla, R.L. Raschke / International Journal of Accounting Information Systems 16 (2015) 1–225to analyze these data, searching for patterns that are suggestive of illicit activity. For example, the connecttool is used to identify transaction descriptions which contain keywords that should not be related in thecontext of a money transfer (See Fig. 2—Panel B.). The most frequent keywords appear in the middle ofthe view, while the less frequent ones appear on the outskirts of the circle. When a user highlights aspecific keyword, lines are drawn from that keyword to all relating keywords, thus facilitating the identificationof suspicious transactions. Finally, the explore tool allows the investigator to navigate through the application'sdata displays. For example, the user might pan across the heatmap of keyword combinations in the upper leftcorner of Fig. 2—Panel A or use an exploration tool to change the dates displayed in the “strings and beads”time-series graph of keyword occurrences in the lower left corner of Fig. 2—Panel A.3. Data visualization applications for fraud investigation and detection3.1. Investigating suspected fraudThe purchasing transaction analysis described in Section 2.2 provides an example of how data visualizationmight be applied to investigate suspected fraud. A fraud investigation starts with a predication of fraud, or“circumstances, taken as a whole, that would lead a reasonable, prudent professional to believe a fraud hasoccurred (Albrecht et al., 2012, 80).” Once a fraud investigator is presented with a predication, he or shemust develop a theory of how the fraud occurred and who may have committed the fraud (Wells, 2003;ACFE, 2010). In this case, the investigator has already hypothesized that fraud is being committed in a specificdepartment (purchasing), through purchases made above market prices, payments to a fictitious vendor, orboth. Data visualization enables the investigator to further refine the fraud theory by first finding analyticalanomalies suggestive of fraud, then identifying specific suspicious transactions and the persons responsiblefor them.3.2. Detecting fraudulent transactionsPractitioners recommend using proactive fraud detection methods as part of an effective fraud riskmanagement program (Lanza, 2005b; Albrecht et al., 2012). One important fraud detection method is to identifyareas where there is a high risk of fraudulent transactions (e.g., purchases of supplies, travel and entertainmentFig. 1. Example of interactive data visualization analysis for fraud detection.
6W.N. Dilla, R.L. Raschke / International Journal of Accounting Information Systems 16 (2015) 1–22Fig. 1 (continued).
W.N. Dilla, R.L. Raschke / International Journal of Accounting Information Systems 16 (2015) 1–227Fig. 1 (continued).expense, or purchasing card use), then employ computer-aided data analysis methods to search for anomalies.These proce
a data mining query or procedure intended to identify wh ether there are individual transactions that need to be examined more closely. Audit software packages such as ACL and IDEA facilitate