Transcription
Topological Vulnerability Analysis: A Powerful New ApproachFor Network Attack Prevention, Detection, and ResponseSushil Jajodia and Steven NoelCenter for Secure Information Systems, George Mason University4400 University Drive, S-113 85 Fairfax, Virginia, USAE-mail: {jajodia, snoel}@gmu.eduThis chapter examines issues and methods for survivability of systems undermalicious penetrating attacks. To protect from such attacks, it is necessary totake steps to prevent them from succeeding. At the same time, it is important torecognize that not all attacks can be averted at the outset; those that are partiallysuccessful may be unavoidable, and comprehensive support is required foridentifying and responding to such attacks. We describe our TopologicalVulnerability Analysis (TVA) system, which analyzes vulnerability to multistep network penetration. At the core of the TVA system are graphs thatrepresent known exploit sequences that attackers can use to penetrate computernetworks. We show how TVA attack graphs can be used to compute actual setsof hardening measures that guarantee the safety of given critical resources.TVA can also correlate received alerts, hypothesize missing alerts, and predictfuture alerts. Thus, TVA offers a promising solution for administrators tomonitor and predict the progress of an intrusion, and take quick appropriatecountermeasures.1.1. IntroductionComputer networks are inherently difficult to secure against attack. They areoften connected to the Internet, for which security was not an original designgoal. Default configurations for many software components are insecure, andthese configurations often remain unchanged by the user. There is generally littleeconomic incentive to develop secure software, so vulnerabilities arecommonplace.Moreover, network security concerns are highly interdependent, so that amachine’s susceptibility to attack can depend on vulnerabilities across thenetwork. Attackers can combine vulnerabilities in unexpected ways, allowingthem to incrementally penetrate a network and compromise critical systems. Wecan reduce the impact of attacks by knowing the paths of vulnerability throughour networks. To do so, we need to transform raw security data into topologicalmaps that let us prepare for attacks, manage risks, and have real-time situationalawareness.Traditional tools for network vulnerability assessment simply scan individualmachines on a network and report their known vulnerabilities. Securityconscious organizations may then employ Red Teams of network penetrationtesters, who attempt to combine vulnerabilities in ways that real attackers might.But penetration-testing experts are expensive, changes to the network1
2S. Jajodia and S. Noelconfiguration render the test results obsolete, and the only attack paths reportedare those found within the allotted test time.The processes for tracking network vulnerabilities are labor-intensive,require a great deal of expertise, and are error prone because of the complexity,volume, and frequent changes in security data and network configurations. Butthrough automated simulation of possible attack paths, we can understand ouroverall security posture in the face of actual attacks.Our innovative approach to network attack survivability is termedTopological Vulnerability Analysis (TVA)1. TVA simulates incremental networkpenetration, building complete maps of multi-step attacks showing all possiblepaths into a network. It maintains models of the network configuration andpotential threats. From these models, it discovers attack graphs that convey theimpact of combined vulnerabilities on overall security. TVA technologyincludes recursive attack graph aggregation with interactive drill down ofscenarios in the cyber domain. It incorporates a variety of types of network scandata, providing the ability to easily model and analyze even large networks.Currently available tools generally give few clues as to how attackers mightexploit combinations of vulnerabilities among multiple hosts to advance an attackon a network. The security analyst is left with just a set of known vulnerabilities.It can be difficult even for experienced analysts to recognize how an attackermight combine individual vulnerabilities to seriously compromise a network.For larger networks, the number of possible vulnerability combinations toconsider can be overwhelming.In this chapter, we describe a mature system that implements TVA. This toolconsiders combinations of modeled attacker exploits on a network and thendiscovers attack paths (sequences of exploits) leading to specific network targets.The discovered attack paths allow an assessment of the true vulnerability ofcritical network resources. TVA automates the type of labor-intensive analysisusually performed by penetration-testing experts. It encourages inexpensive“what-if” analyses, in which candidate network configurations are tested foroverall impact on network security. It also allows for the computation ofnetwork-hardening options that protect given critical resources while requiringminimal network changes.To meet network availability requirements, there must usually remain someresidual vulnerability after all protective measures have been applied. In suchcases, we must then rely on the detect/react phases of security. While we cannotpredict the origin and timing of attacks, TVA can reduce their impact byproviding knowledge of the possible attack paths through the network. Forexample, TVA attack graphs can be used to correlate and aggregate network
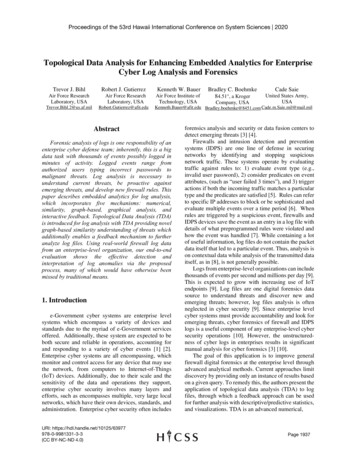
3Topological Vulnerability Analysisattack events, across platforms as well as across the network. TVA attack graphscan also provide the necessary context for optimal reaction to attacks.1.2. Topological Analysis of Network VulnerabilityBecause of the interdependencies of exploits across the network, a topologicalapproach is necessary for full understanding of attack vulnerability. Thetraditional approach of considering network components in isolation andreporting vulnerabilities independent of one another is clearly insufficient. TVAmodels vulnerabilities and combines them in ways that real network attackersmight do. The result is the discovery of all attack paths through a network.Figure 1.1 shows the overall flow of processing in TVA. There are threeinward flows of information: a model of the network configuration, a knowledgebase of modeled attacker exploits, and a desired attack simulation scenario.From these, TVA then simulates incremental attacks through the network,thereby discovering all possible attack paths (organized as a graph) to the givencritical network resources. Various innovative visualization capabilities supportinteractive analysis of resulting attack graphs, while keeping visual complexitymanageable. TVA can also use the attack graphs to compute optimal networkprotection zationHubNetworkNetworkProtectionFig. 1.1. Topological Vulnerability Analysis (TVA). From the network configuration and modeledattacker exploits, multi-step attacks are simulated, analyzed through interactive visualization, andused to formulate optimal network protection.To model the various elements of the network and network attack events, ourTVA system automatically processes the output of various network scanning and
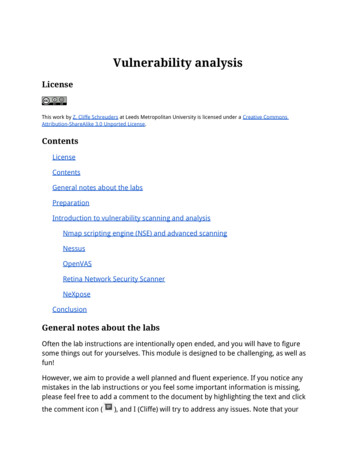
4S. Jajodia and S. Noellogging tools. It can combine scans from various network locations, building acomplete map of connectivity to vulnerable services throughout the network, andcan map actual intrusion events to elements of the resulting attack graph.Figure 1.2 shows the inputs to our TVA system (current and proposed). Theinputs occur in two phases. In the pre-attack protect phase, network scan toolsprovide information about network configuration and known vulnerabilities. Forthis, we can map vulnerability scanner output directly to correspondingvulnerable services on network machines. Our system is currently integratedwith the Nessus2 (open-source) and Retina3 vulnerability scanners, andintegration with the FoundScan4 vulnerability scanner is under development. Orwe can map the output of asset discovery tools (detected software on a machine)to the known vulnerabilities for each software package. For this, our system isintegrated with Symantec Discovery5, which we map to known vulnerabilitiesthrough integration with Symantec DeepSight6 (a direct feed of the Bugtraq7vulnerability data). Cross-referencing data, including MITRE’s CommonVulnerabilities and Exposures8 (CVE), are used to correlate vulnerabilities acrossvarious sources.TVA EngineAnd VisualizerDetectNetflow DataSystem LogsAttack ScenariosTCP Dump DataWeb LogsIntrusion DetectionKnown ThreatsVulnerability ScansAsset DiscoveryProtectNetworkFig. 1.2. Inputs to TVA system. During protect phase, pre-attack scans are used to build models ofthe network. During the detect phase, attack events are mapped to the predicted attack graph.In the detect phase, the TVA system maps detected attack events to theircorresponding elements of the predicted attack graph. This provides the context
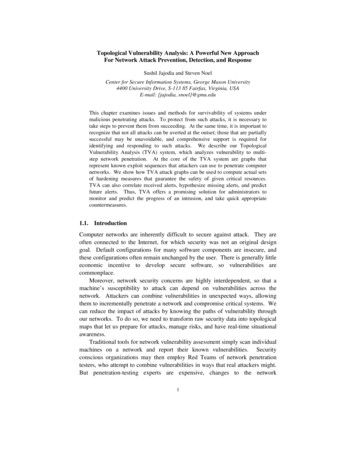
Topological Vulnerability Analysis5for correlating events, predicting the next possible attack steps, and responding inthe best way. It also helps remove clutter by prioritizing those predicted exploitsthat are correlated with recent real-time data. Our TVA system is currentlyintegrated with the Snort9 intrusion detection system. Integration with otherintrusion detection systems (e.g., Dragon) is also possible, as well as with othersources of real-time data, such as web server logs (e.g., Apache and MicrosoftIIS), operating system logs, and network traffic data (e.g., Netflow and TCPDump).To keep our TVA input exploit model current, we monitor emerging cyberthreats, in the form of vulnerabilities that are discovered for particular softwareand the ways in which attackers can exploit these vulnerabilities. From thisthreat information, we model individual attacker exploits in terms ofpreconditions and postconditions. The modeled exploits are in terms of genericattacker/victim machines, which the simulation engine maps to a particular targetnetwork.Because of all this pre-populated data, when using our TVA system thesecurity analyst need not be burdened with all the details of the network andexploit data. All that is needed is to define the attack scenario, e.g., the startingpoint, the attack goal, and any what-if changes to the network configuration. Theattack scenario could also be less constrained, such as finding all possible attackstarts leading to one or more goals, or finding all possible paths from particularstarting points.1.3. A Motivating ExampleAs a motivating example, we demonstrate how TVA combines vulnerabilities ina network to find all attack paths from a particular starting point to a given goal.We then show how TVA determines optimal ways of hardening the networkagainst these attacks.Consider the small example network shown in Fig. 1.3. Here, a restrictivefirewall protects the machines that support public web and email services. TVAshows how vulnerable services on a network can still be exploited through multistep attacks, when the attacker cannot access them directly.The firewall implements the following policy to restrict access to the networkfrom the outside: Incoming web traffic is permitted only to the web server, which is runningMicrosoft IIS. Incoming email traffic is permitted to the mail server.
6 S. Jajodia and S. NoelIncoming FTP is blocked because the mail server is running wu ftpd, whichhas a history of vulnerabilities.All other incoming traffic is blocked.Linuxattack toolsAttacker10.10.101.10NT4.0IISFirewallWeb Server10.10.100.20HubLinuxwu ftpdMail Server10.10.100.10Fig. 1.3. Small example network for illustrating TVA. The firewall allows web traffic to the webserver, allows email traffic to the mail server, and blocks all other incoming traffic.For this example, we populate the TVA network model through Nessusscans. In particular, we scan the web server and mail server from outside thefirewall, to obtain vulnerable connectivity from the initial attack vantage point.We also scan these two servers behind the firewall, showing any subsequentvulnerable connectivity once the attacker gains entry into the network. Thesescan results are merged to form an overall model of the network for TVA.The attack goal for this example is to obtain super user (root) access on themail server, starting from outside the network. This is not directly possiblebecause (1) there are no known vulnerabilities for the version of sendmailrunning on the mail server, and (2) the firewall blocks access to the vulnerablewu ftpd service from the attack machine. TVA analyzes whether the attack goalcan be realized indirectly, i.e., through a sequence of multiple exploits.Figure 1.4 shows the resulting TVA attack graph for the example network inFig. 1.3. Here, shaded ovals are simulated attacker exploits. For each exploit,incoming edges represent preconditions, all of which must be met for the exploitto be successful. Then for each exploit, outgoing edges represent postconditions,i.e., the conditions induced when the exploit is successful. Preconditions with the5-digit Nessus identifiers represent connections to vulnerable network servicesdetected by Nessus.
7Topological Vulnerability AnalysisSolution 1Solution 2No ImpactSolution 2Solution 1Solution 1No ImpactSolution 2Solution 2Fig. 1.4. Attack graph illustrating TVA. This graph shows all possible ways an outside attacker canobtain the ability to execute arbitrary code as a super user on the mail server.The initial condition execute(attack) represents the fact that the attacker canexecute arbitrary code on his own machine. This enables three separate exploitsfrom attack to the web server (machine m20). Each of these exploits providesthe ability to execute arbitrary code on the web server. This subsequentlyenables four new exploits from the web server to the mail server (machine m10),each yielding the ability to execute arbitrary code on the mail server. Two ofthese exploits provide access at a super user level of privilege. The other twoexploits provide user-level privilege only, but two subsequent local privilegeescalation exploits on the mail server provide other paths to super user.Finding such attack paths is a unique TVA capability. Vulnerabilityscanning tools connected outside the firewall report only the IIS vulnerabilitieson the web server. Such scans from inside the firewall would report thevulnerable wu ftpd service, but TVA is required to build an attack path from theoutside through the web server to the mail server. While easy enough for anexperienced penetration tester on such a small network, it becomesunmanageable for networks where voluminous outputs must be analyzed forlarge numbers of machines.
8S. Jajodia and S. NoelTVA can not only find attack graphs, but can also use these graphs forfinding optimal solutions for hardening the network. In particular, though TVAwe can find combinations of network-hardening measures that prevent a givenattack scenario, while requiring a minimal number of changes to the networkconfiguration. Figure 1.4 illustrates this. For this network, one such solution isto remediate (e.g., patches or firewall blocking) the three vulnerabilities fromattack to m20. Hardening these three vulnerabilities is necessary and sufficientfor preventing the attack goal. The other solution is to harden the twovulnerabilities on m10 that enable the four exploits yielding super user access.Interestingly, TVA shows that hardening the other two vulnerabilities on m10(yielding user-level access only) has no impact on blocking access to the goal,i.e., hardening them is neither necessary nor sufficient.The next section describes the TVA process for optimal network hardeningin more detail.1.4. Minimal-Cost Network HardeningAttack graphs reveal threats by predicting combinations of attacker exploits thatcompromise given critical resources. But alone, they do not directly provide asolution to remove the threat. Finding such solutions manually can be tediousand error prone, especially for larger and less secure networks.TVA automates the task of hardening a network against multi-step attacks.Unlike previous approaches whose solutions are in terms of attackerexploits10,11,12, our solutions are in terms of network configuration elements.These solutions are therefore more enforceable, because the configurationelements can be independently hardened, whereas exploits are usuallyconsequences of other exploits and cannot be disabled without removing the rootcauses. Also, our solutions are optimal in the sense that they incur minimal costin terms of changes to the network.Consider the network in Fig. 1.5, which we model using multiple layers ofthe TCP/IP stack. This example shows how complicated interdependenciesamong exploits can be resolved to an optimal set of hardening measures. It alsodemonstrates how purely exploit-based hardening approaches are insufficient fornetwork hardening, i.e., that solutions in terms of network configuration elementsare needed.
9Topological Vulnerability AnalysisattackNIS serverhomerNIS clientEthernetswitchssh (RSA key auth)/home nfs export to bart/home/root/.ssh for RSA keysbartssh (password auth)homer:/home autofsFig. 1.5. Network illustrating TVA minimal-cost network hardening.interdependencies among exploits are to be resolved to optimal hardening measures.ComplicatedIn Fig. 1.5, an Ethernet switch provides connectivity at the link layer. At thetransport layer, unused services have been removed, secure shell replaces FTP,telnet and other cleartext password-based services, and there is tcpwrapperprotection on RPC services. Application-layer trust relationships further restrictNFS and NIS domain access. The exploits and network configuration elements(exploit conditions) for this example are described in Table 1.1 and Table 1.2,respectively.Table 1.1. Exploits for network shown in Fig. 1.5.Exploitarp spoofypcat passwdcrack passwdscp upload pwscp download pwssh login pwrh62 glibc bofcreate nfs home ssh pk sussh login pk suDescriptionSpoof (impersonate) machine identity via ARP poisonattackDump encrypted NIS password fileCrack encrypted user password(s)Secure shell copy, upload direction, using passwordauthenticationSecure shell copy, download direction, using passwordauthenticationSecure shell login using password authenticationRed Hat 6.2 buffer overflow in glibc libraryExploit NFS home share to create secure shell key pairused for superuser authenticationSecure shell login using public key authentication
10S. Jajodia and S. NoelTable 1.2. Configuration elements for network shown in Fig. 1.5.Network Conditionlink arptrans yptrans ssh pwtrans ssh pktrans nfsapp nfs home suapp yp domainapp yp passwdapp pwauthapp ssh pk supgm glibc bofexecutesuperuserDescriptionAttacker shares link-level connectivity with victim (both onsame LAN)Transport layer connectivity to NIS serverTransport layer connectivity to secure shell server thatsupports password authenticationTransport layer connectivity to secure shell server thatsupports public key authenticationTransport layer connectivity to NFS serverApplication “connection” representing sharing superuser’shome directoryApplication “connection” representing NIS domainmembershipApplication “connection” representing acquisition ofencrypted NIS password databaseApplication “connection” representing acquisition ofunencrypted user passwordApplication “connection” representing acquisition/creationof key pair used for superuser authenticationProgram used to exploit glibc library buffer overflowvulnerabilityAbility to execute arbitrary codeSuper user privilegeFigure 1.6 shows the attack graph for the network in Fig. 1.5 modeled via theexploits
this, we can map vulnerability scanner output directly to corresponding vulnerable services on network machines. Our system is currently integrated with the Nessus 2 (open-source) and Retina 3 vulnerability scanners, and integration with the FoundScan 4