Transcription
ATTACHMENT 4UC Retirement Savings ProgramInvestment PerformancePeriods ending June 30, 2015Office of the Chief Investment OfficerSeptember 9, 2015
UC Retirement Savings Program (UCRSP)The primary objective of the Program is to facilitateretirement savings for employees and retirees byproviding a set of Fund Options that allowparticipants to tailor the investment of theirretirement savings assets to their unique risk andreturn preferences at reasonable costs.2
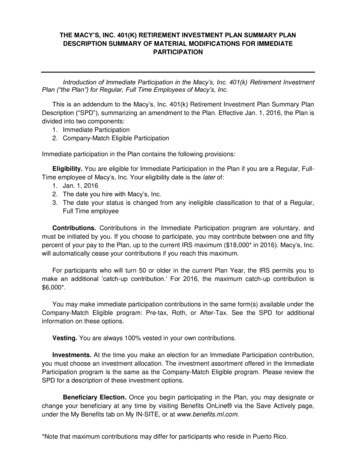
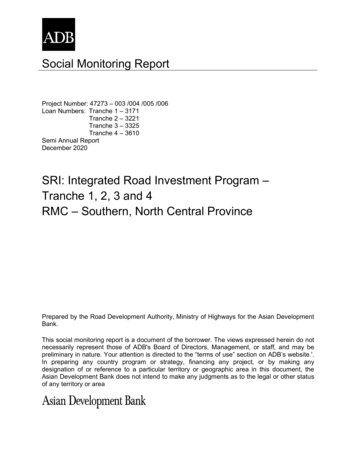
UC Retirement Savings ProgramPlan AssetsEntity LevelAsset Allocation457BDC PlanParticipantDirected 20.1BillionWorkingCapital403B403B: 70% 14.1B457B: 10% 1.9BAs of June 30, 2015DC Plan: 20% 4.1B 98.2BillionPension PlanEndowmentPension Plan: 56% 55.0BEndowment: 9% 8.9BParticipant Directed: 21% 20.1BWorking Capital: 14% 14.2B3
UC Retirement Savings ProgramQ2 Plan Highlights 20 billion across three plans 293,728 unique participants: 151,895 active*, 141,833 inactive** Moved 2.4 billion into UC Target Date Funds on July 1st, 2015 Moved from ‘To’ to ‘Through’ retirement glide path Increased Equity exposure across TDFs; were overly conservative All monitored funds in line with expectations over period except:– Vanguard FTSE– DFA Emerging Markets– Vanguard REITS* Active: Active, Eligible, Beneficiary Spouse, Beneficiary Non-Spouse, Military LOA, Paid LOA, QDRO Spouse, QDRO Non-Spouse** Inactive: Retired, Terminated, Deceased, Not Eligible, Suspended, Unpaid LOA4
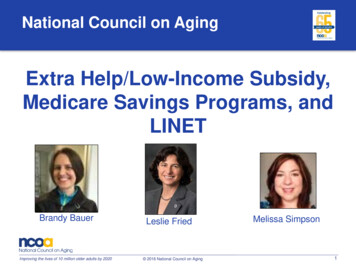
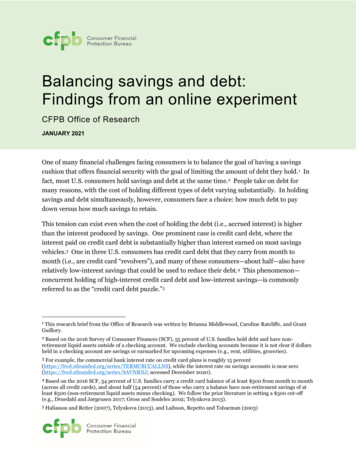
UC Retirement Savings ProgramPlan Overview403B457BBrokerageLink onFixed IncomeDCPFixed IncomeAssetAllocation 1.9BillionFixed IncomeAssetAllocation 4.1BillionEquityEquityEquityEquity: 42% 5.9BFixed Income: 24% 3.4BEquity: 36% 0.7BFixed Income: 21% 0.4BEquity: 30% 1.2BFixed Income: 45% 1.8BAsset Allocation: 27% 3.9BBrokerage Link: 7% 1.0BAsset Allocation: 34% 0.7BBrokerage Link: 10% 0.2BAsset Allocation: 21% 0.9BBrokerage Link: 4% 0.2BAs of June 30, 20155
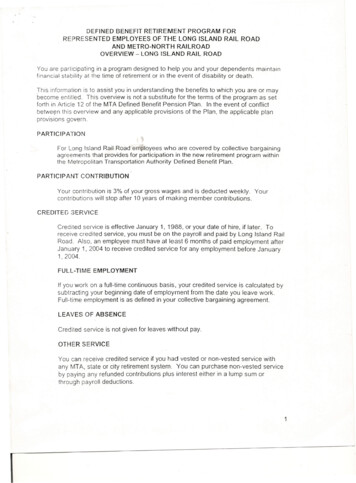
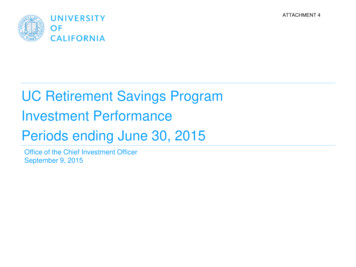
Investment Structure as of July 1, 2015Tier IPre Defined Asset AllocationTier II & IIIAssset Allocations Building BlocksTier IVBuild my own PortfolioConservativeCapital PreservationUC Savings FundInflation SensitiveUC Short Term TIPS FundUC TIPS FundTarget Date FundsUC Pathway FundsAggressiveBalanced FundUC Balanced GrowthDiversified Fixed IncomeUC Bond FundUS Large EquityUS Domestic Equity FundVanguard Social IndexLarge EquityFidelity Growth Company FundUS Small/Mid Cap EquityVanguard Small Cap FundUS Small/Mid Cap EquityCalvert Cap. Accum. FundGlobal / World ex-US EquityUC Global FundUC International Equity FundWorld ex-US EquityFidelity Diversified Intl. FundDFA Emerging Market FundBrokerage WindowReal EstateVanguard REIT Index Fund6
Retirement Savings Program DemographicsSame-sizePeersUnique /AN/A141,833 14,112,114,259 4,070,150,391 1,939,578,084N/AN/A 20,121,842,734N/A18.1%11.2%17.4%50.6%30.8%N/A1 Fund (Non-Lifecycle Fund)N/A21.4%59.4%21.0%9.3%10.2%N/A2 FundsN/A19.4%20.1%19.1%12.0%14.5%N/A3 FundsN/A13.1%4.1%11.5%6.4%8.6%N/A4 FundsN/A9.4%2.1%9.9%5.9%7.0%N/A5 or more FundsN/A18.6%3.1%21.1%15.8%29.0%N/AAverage # of Funds HeldN/A2.9 funds1.5 funds3.2 funds1.8 funds3.2 fundsN/AMoney Market / Short-Term13,635141,5461,964N/AN/A157,145UC GLOBAL EQUITY FDDomestic Equity5,5116,298892N/AN/A12,701UC BALANCED 76688243N/AN/A1,607Domestic Equity271591244N/AN/A1,106Plus 57 other funds-2,8816,0381,298N/AN/A10,217Lifecycle 1,335Asset Class403bDCP457bTotal ParticipantsN/A128,414268,31829,705Active Participants*N/A77,692149,298Inactive Participants**N/A50,722Total Plan AssetsN/A1 Fund (Lifecycle Fund)Industry PeersNumber of ParticipantsNumber of Funds Held by ParticipantsHow many participants hold:Funds held as a single investmentUC SAVINGS FUNDUC BOND FUNDVANG SM CP IDX IS PLTotalFor plans that offer Fidelity BrokerageLink, it will appear as a fund (rather than a product offering) for purposes of providing plan data.As of June 30, 2015* Active: Active, Eligible, Beneficiary Spouse, Beneficiary Non-Spouse, Military LOA, Paid LOA, QDRO Spouse, QDRO Non-Spouse** Inactive: Retired, Terminated, Deceased, Not Eligible, Suspended, Unpaid LOA7
UCRSP PerformanceDC Plan, 403b, and 457b Plans as of 6/30/2015Target Date FundsUC Pathway Income FundUC Pathway Income Policy BenchmarkVarianceUC Pathway Fund 2015UC Pathway 2015 Policy BenchmarkVarianceUC Pathway Fund 2020UC Pathway 2020 Policy BenchmarkVarianceUC Pathway Fund 2025UC Pathway 2025 Policy BenchmarkVarianceUC Pathway Fund 2030UC Pathway 2030 Policy BenchmarkVarianceUC Pathway Fund 2035UC Pathway 2035 Policy BenchmarkVarianceUC Pathway Fund 2040UC Pathway 2040 Policy BenchmarkVarianceUC Pathway Fund 2045UC Pathway 2045 Policy BenchmarkVarianceUC Pathway Fund 2050UC Pathway 2050 Policy BenchmarkVarianceUC Pathway Fund 2055UC Pathway 2055 Policy BenchmarkVarianceUC Pathway Fund 2060UC Pathway 2060 Policy BenchmarkVarianceAs of June 30, 2015Annualized Total ReturnMarket Value% of PlanOne YearThree YearFive YearSeven YearTen Year 279,593,9101.39% 226,203,6861.12% 574,921,8082.86% 398,934,9871.98% 511,248,1212.54% 286,755,9291.43% 342,240,0291.70% 156,978,0350.78% 141,322,7890.70% 52,012,9060.26% 0.30NANANANANANAPathway Policy Benchmarks are a blend of underlying benchmarks given target allocation of each target date fund8
UCRSP PerformanceDC Plan, 403b, and 457b Plans as of 6/30/2015Balanced FundUC Balanced Growth FundBalanced Fund Policy BenchmarkVarianceUS Large EquityUC Domestic Equity Index FundRussell 3000 TF IndexVarianceVanguard FTSE Social Index FundSpliced Social IndexVarianceUS Small/Mid Cap EquityVanguard Small Cap Index FundMSCI US Small Cap 1750 IndexVarianceGlobal/World ex-US EquityUC Global Equity FundUCRSP Global Equity Policy BenchmarkVarianceUC International Equity Index FundMSCI World ex-US TF IndexVarianceCapital PreservationUC Savings FundTwo-Year U.S. Treasury Notes Income ReturnVarianceInflation SensitiveUC Short Term TIPS FundBarclays 1-3 Year U.S. TIPS IndexVarianceUC TIPS FundBarclays US TIPS IndexVarianceAs of June 30, 2015Annualized Total ReturnMarket Value( M)% of PlanOne YearThree YearFive YearSeven YearTen Year .000.126.726.150.576.446.000.44 396,883,4391.97% 0.13 080.10NA11.51NANA9.39NA 4,310,277,67821.42% 8.310.221.981.690.297.887.650.235.325.160.16 80.921.790.631.162.551.680.87 22,866,3560.11% .37NANANA4.434.130.309
UCRSP PerformanceDC Plan, 403b, and 457b Plans as of 6/30/2015Diversified Fixed IncomeUC Bond FundBarclays Aggregate Fixed Income BenchmarkVarianceNew Large EquityFidelity Growth Company FundS&P 500 TF IndexVarianceUS Small/Mid Cap EquityCalvert Cap. Accum. FundRussell 2500 TF IndexVarianceWorld ex-US EquityFidelity Diversified Intl. FundMSCI World ex-US TF IndexVarianceDFA Emerging Markets PortfolioMSCI Emerging Markets IndexVarianceReal EstateVanguard REITS Index FundREIT Spliced IndexVarianceAs of June 30, 2015Annualized Total ReturnMarket Value( M)One YearThree YearFive YearSeven YearTen Year 50.455.194.590.604.704.440.26 NANANANA11.74NANA .850.83NA10.93NA9.039.09-0.06 113,265,4680.56% 69NANA0.86NA6.065.160.90NA8.11NA 29-0.04NA8.15NANA7.14NA10
UC Pathway Funds. Balanced Fund. UC Balanced Growth. Brokerage Window Global / World ex-US Equity. UC Global Fund UC International Equity Fund. Diversified Fixed Income. UC Bond Fund. Large Equity. Fidelity Growth Company Fund. US Small/Mid Cap Equity. Calvert