Transcription
Anaerobic Digestion 101November 2, 20171:00 – 3:00 pm EasternWEF Plant Operations and Maintenance Committee
How to Participate Today Audio Modes Listen using Mic &Speakers Or, select “UseTelephone” and dial theconference (pleaseremember long distancephone charges apply). Submit your questions usingthe Questions pane. A recording will be availablefor replay shortly after thiswebcast.Today’s ModeratorFred EdgecombGilbert Neely Wastewater Reclamation FacilityProject Manager
Today’s SpeakersMatthew Higgins, Ph.D.Professor, Civil andEnvironmental EngineeringBucknell UniversityMatt Van Horne, P.E.Hazen and SawyerPeter Loomis, P.E.CDM SmithAnaerobic Digestion 101Matthew Higgins, Ph.D.Claire W. Carlson Chairin Environmental EngineeringBucknell UniversityLewisburg, PA 17837Dave Parry, Ph.D.C2HM
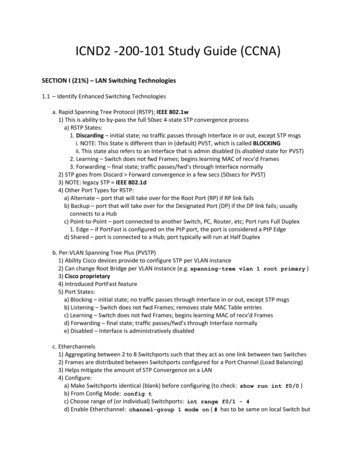
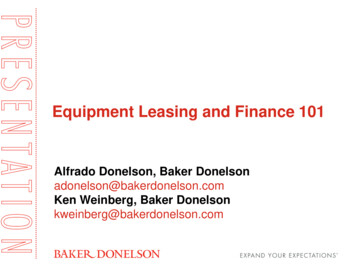
Big ndaryClarifierPlantEffluentWaste ActivatedSludgePrimary CHPDewateringWhy Anaerobic Digestion?One of the approaches to meeting EPA 503 Requirements forbiosolids:1. Vector Attraction Reduction (VAR) requirements-reduces the organics in the sludges so it is ‘stable’2. Reduces pathogens-Meets EPA Requirement as“Process to Significantly Reduce Pathogens”
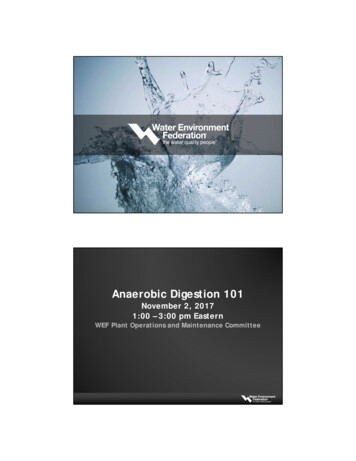
Why Anaerobic Digestion?3. Produces a renewable energy source – biogas (55-70% methane) uses:-Combined heat and power systems (CHP)-Digester heating-Vehicle fuel-Put into natural gas grid4. Produces a excellent soil amendment product, rich in:-carbon-nitrogen-phosphorus-micronutrientsBig Picture of Anaerobic Digestion Process3. Biogas Out (CH4 CO2)1. Organics In2. MicrobialDegradation ofOrganics4. Organics Out
Organics InFeed StocksWaste Activated Sludge(WAS)Typical Feed Total SolidsConcentrations4-6%Primary Sludge (PS)4-6%Primary/Secondary Blends4-6%Food Wastes5-15%Fats, Oils and Grease (FOG)Lots of other organicwastesHighly variablevariableMicrobial ConversionsParticle AcetatePropionateButyrateValerateH2Organic Particles(floc)Complex PolymersProteins,Carbohydrates andLipidsAmino Acids,Sugars, FattyAcidsVolatile FattyAcids andHydrogen Gas (H2)
Microbial OOHH2AceticlasticMethanogenesis4H2 CO22H2O CH4HydrogenotrophicMethanogenesisMicrobial DegradationTypical Parameters for Expressing Degradation1. Volatile Solids Reduction (VSR)2. Chemical Oxygen Demand Reduction (CODR)Mass of VS In Qin*VSinVSR 100*CO2 CH4Mass of VS out Qout*VSout
Microbial DegradationVSR by Van Kleek EquationVSFin VSFout Van Kleek assumes inert solids are constant in and out of the digester, no settlingof grit Inert Solids TS – VS (also called ‘fixed’ solids or ash’) Equation uses the volatile solids fraction (VSF) Microbial DegradationVolatile Solids Reduction by Van Kleek EquationVSFin VSR by Van Kleek 100 *VSFout
Typical VSRsFeed StocksVSRWaste Activated Sludge (WAS)25-40%Primary Sludge (PS)40-65%Food Wastes75-85%Fats, Oils and Grease (FOG)80-95%Operational Parameters Affecting VSR - SRTSolids Retention Time (SRT) average time a particle spends in the digester7060Primary SludgeSRT VSR (%)5040Waste Activated30TypicalDesign &OperationRange2010005101520SRT (d)253035
Operational Parameters Affecting VSR TemperatureMesophilic Range: 25-45 oCThermophilic Range: 50-65 oCOperational Parameters Affecting VSR Temperature555040 CVSR (%)35 C45Typical MesophilicOperatingTemperature35-38 oC25 C403530051015SRT (d)202530
Digester Operational ParametersOrganic Loading RatesVolatile Solids Loading Rates mass of VS fed per day per unit volume of digester.Typical “Textbook” Values:a. kg VSin per day per cubic meter of digester volume (1-3 kg VS/d-m3)b. lb VSin per day per cubic ft of digester volume (0.06-0.30 lb VS/d-ft3)OLR don’t consider:a. What is in your digesterb. Nature of wastesc. Operational conditionsKg VSind – m3Higher OLRs can be readilyachieved with good operationsDigester Operational ParametersSpecific Organic Loading RatesSpecific Organic Loading Rate considers ‘biomass’ in digester grams of CODin per day, per gram of VS in digesterCurrent Guideline:SOLR ·0.3
Anaerobic Digestion Operational ParametersParameterStable OperatingRangesImportancepHMaster variable for digester operation6.7-7.8AlkalinityHelps buffer pH changesVFAs or VAsIncrease in concentrations an indicatorof potential upsetVA/AlkalinityRatio of Volatile Fatty Acids toAlkalinity Ratio, increases meanprocess changes 0.2BiogasComposition(CH4/CO2Ratio)Decreases in CH4 content can meanprocess changes and inhibition 55% 1000 mg/L asCaCO3 300 mg/LStoichiometry of Anaerobic DigestionTheoretical General Equation (Buswell, 1952)digester alkalinityOrganic FeedstockCnHaObNc H2O xCH4methaneproduction yCO2 zHCO3- zNH4 biogasproductiondigesterpHx, y and z are a function of n, a, b, and cpotentialinhibition
Stoichiometry of Anaerobic DigestionTypeFormulaSourceWaste ActivatedC6.6H12O2.4NBucknell Data(average of 8 plants)Primary SludgesC17H31O7.2NBucknell Data(average of 5 plants)Food WasteC17H30O6NBucknell Data(average of 3 different FWs)FatsC16H32O2Rittman and McCartyCarbohydrateC6H10O5Rittman and McCartyProteinC16H24O5N4Rittman and McCartyBiogas ProductionMethane YieldMethane YieldFeed StockPrimary SludgeWaste ActivatedFood WasteFOG (Fats, 055%40%80%90%44058040052090%90%
Notes on EPA Regulatory RequirementsClass B Biosolids: assumes pathogens are present site restrictions are used for land application to ensurepublic safety product is stable, vector attraction reduction is metSeveral Options for Demonstrating Class B Requirements1. VSR 38% for vector attraction reduction2. Monitor fecal coliforms: 2 million per gram dry solids3. Demonstrate digestion meets time and temperaturerequirement 15 days at 35 oC27Notes on EPA Regulatory RequirementsClass A Biosolids: pathogens levels below detection no site restrictions for beneficial reuse stable product that meets vector attraction reductionSeveral Options for Demonstrating Class B Requirements1. 38% VSR for vector attraction reduction2. Monitor fecal coliforms: 1000 per gram dry solids3. Monitor Salmonella: 3 MPN/gram dry solids28
SummaryAnaerobic digestion is a sustainable approach to treatingorganic wastes: produces renewable energy produces a product that recycles organics and nutrients can be used to meet EPA requirements for biosolids stable operations require regular monitoring and goodpractices29Matt Van Horne, PE 14 years experience Specializes in biosolids,energy management andwastewater treatmentfacilities Principal Investigator forWE&RF project on theoperational impacts ofco-digestion
Agenda What is co-digestion? Why consider co-digestion? System configuration System control Lessons learnedWhat is Co-Digestion?
Co-Digestion at a WRRFPrimary SludgeAnaerobic DigesterWaste ActivatedSludgeExternal OrganicMaterialsWhat Are Possible ExternalSources of Material? Fats/oils/grease (FOG) Pre-consumer food waste Post-consumer food waste Industrial waste organics
What Are Possible ExternalSources of Material?Why Consider Co-Digestion?
First Lets Take a Step Back DigesterfeedstocksDigestergasIncreasing Gas Production More incomingorganics can result inmore digester gasproduced More change theeconomics ofbeneficial utilization
Increase Utility Revenue Tipping fees More biosolids to sell More energy to sell externallyCollection System Benefits Remove problematic materials (FOG)from collection system with appropriateoutlet
System ConfigurationOverall System ComponentsDepackagingand SlurryingTruckUnloadingScreening andDebrisRemovalGrinding andMaceratingHeatingStorage
Truck UnloadingDepackaging/Slurrying
Screening/Debris RemovalGrinding/Macerating
HeatingStorage
FeedingSample FOG Facility
Sample FOG FacilitySample FOG Facility
Sample FOG FacilitySample Food Waste FacilityDepackagerWaste materialTrucktippingfloorShredderDilution waterPumping well withrecirculation pumpDigester feed pump
Digester Considerations Increased solids content – mixing Increased organic loading – gas handlingand foaming/RVE control Digested solids productionKey Points Can be many new steps Harsh characteristics of material Odor management Design for reliability Design for maintenance access
System ControlWhat Are We Really Trying toControl? Digester performance is keyLoading rates Quality of materials for digestion Mixing system performance
How Do We Monitor and ControlThis? Feedstock monitoringpH Total solids Volatile solids Toxicity Take samples from each batch received!How Do We Monitor and ControlThis? Digester monitoring pHVolatile acid concentrationsAlkalinityFoamingTemperatureFeed ratesVolatile solids
But What Does This Really Mean? Continue normal digester monitoring andsampling Maybe small expansion of parameters Become familiar with received materialsUnderstand how the digesters react todifferent materials Can be simple flow rate control Lessons Learned
WE&RF Has a Significant ResearchProgram on Co-DigestionDetailed Survey
What Do Plants Monitor?How is Digester Feed Controlled?
Additional Operator Time At PreTreatmentAdditional Maintenance Time atPre Treatment
Additional Time Spent atDigestionFuture Work Efforts for CoDigestion There is no standard approach to monitoring codigestion systems; Operational impacts vary widely based on the typeand quantity of material co digested; Few major operational impacts were reported; and, The industry would benefit from additional guidancefor how to best manage operations of co-digestionfacilities.
Questions and AnswersMatt Van Horne, l Hydrolysis OperatingConsiderationsPeter Loomis, PE 29 years experience inwastewater and biosolids Led commissioning, startupand 2 years of operations atBlue Plains for TH/Digestion Oversaw installation/commissioning of RingsendTH/Digestion expansion in2008
Thermal Hydrolysis OperatingConsiderationsAgenda1.Thermal Hydrolysis – Background and History2.Operations at DC Water3.TH/Digestion Operating Results4.Lessons LearnedThermal Hydrolysis – Backgroundand HistoryThermal Hydrolysis (THP) is a process by which sludge isheated and pressurized with the purpose of reducingorganic solids to make them more readilybiodegradable .In other words, it’s a pressure cooker.BEFOREAFTER
Why THP? Class A biosolids Increased downstream processingcapacity Increased VSRbiogasWithoutTHPWithTHP Projected 10–15% VSR increase Reduced digested solids production Potential energy neutrality Increased cake solids content 10% increase Reduced digester foaming.and reduced odorMean Headspace DetectionThreshold (dilutions to threshold)Lower Odor of THP Biosolids CouldOpen Product Use Opportunities25,000THP with CentrifugeDewateringTHP with BFPDewateringConventionalMAD withCentrifuge20,00015,00010,0005,0000THERMAL HYDROLYSIS PROCESSESSource: Murthy, 2012CONVENTIONALMESOPHILIC
THP System nTHPTo DewateringHEXTHP Background - History First full scale THP systemcommissioned in 1995 by Cambi HIAS plant Lillehammer, Norway Original vessels are still in operation Kruger/Veolia 1st pilot plant 2004(Biothelys) full scale 2009. Kruger/Veolia 1st Exelys plant 2014 First US Installation – DC WaterOperational October 2014 (Cambi) 8 US THP Facilities inplanning/design/construction
THP Background - Manufacturers Cambi 50 facilities. 1 in US. 8Additional in US in next 3 years. Veolia/Kruger 2 types Biothelys – continuous batch 7facilities 1 US pilotExelys – continuous 2 facilities 1demonstration Sustec – 2 full scale, 3 pilot Haarslev – 2 pilot scale plantsDC Water: First Operating THPFacility in North America
DC Water: Operations Implemented THP/digestionwith seeding beginning inOctober 2014 Full throughput in February2015 Full acclimatization in late2015 Temporary approval for Class Bland application February 2015 Approval for Class A landapplication in May 2016DC Water: Operations Controls Key Control Issues Feed ConcentrationTHP Feed RateReactor TemperatureDilution ControlDigester TemperatureControlSteam Pressure
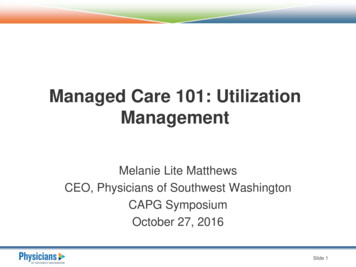
DC Water: Biosolids OperatingResults VSR 65% to 70%(January to June 2016) SRT/HRT at 20 days Fecal coliforms 5 MPN/Gram Approximately 500 wet tonsper day produced Generating 8 to 10 MWof power Waste heat from powergeneration providing steamDC Water: Daily Feed Rates450Average Mass Feed Rate 303 DTPDAverage SRT 21 days400Solids Throughput, dtpd350300250200150100500Digester 1Digester 2Digester 3Digester 4Total
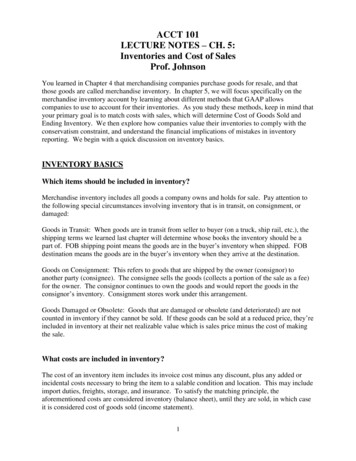
DC Water: Volatile SolidsReductionAverage Feed VS 81%Average VSR 68.5%1009080806070406020500Percent Volatile Solids ReductionPercent Volatile Solids100DatePre-Digestion Screened Blended SolidsFinal Thermal Hydrolysis & Digested Belt Filter Press CakeVolatile Solids ReductionDC Water: Solids Concentration inDigesters87Percent Total Solids6543210DateDigester 1Digester 2Digester 3Digester 4
DC Water: Dewatered SolidsConcentration40Percent Total Solids3530Dewatered solids 32%Polymer use 20 to 22 lbs/ton2520DateFinal Thermal Hydrolysis & Digested Belt Filter Press CakeDC Water: Meeting and ExceedingClass A Requirements8070Fecal Coliform MPN/gram6050Average Fecal Coliform 5 MPN/gramMax Fecal Coliform 72 MPN/gram403020100DateFinal Thermal Hydrolysis & Digested Belt Filter Press Cake
Digester AmmoniaDigester Settling1 minute90 minutes4 hours
Hydrolyzed Sludge Settling1 minute90 minutes28 hoursSludge CoolingDC Water Approach 2 Cooling HEX & 1 Tuning HEX per digesterCooling HEX cools incoming solidsTuning HEX provides “trim” cooling ofdigesting solids Results Cooling HEX Maintain DigesterTemperaturesTuning HEX loses significantheat in winter
Cooling Water DC Water Plant Effluent (10 MGD PumpStation) Maximum Water Temp. of 81 F Chlorine addition to prevent biofouling Apparent precipitate fouling ofwaterside Microbially Induced CorrosionDigesters Draft Tube Mixing Rapid RiseControl viaoverflow toground No supplementalgas storage No Field AnalysisCapabilitiesLesson Learned:Cooling water supply is critical forconceptual design
DC Water: Operating Issues Mechanical Issues Rotary Lobe PumpsCake Bin GatesCentrifuge Solids ControlWear on Mechanical Equipment Process Issues VivianiteGritFoamOdors Support Equipment Issues Steam PressureFlare Exhaust ResultsDilution ControlDC Water: Results andObservations SummarySolids throughput approximately doubled standard mesophilicdigestersConcentration in digesters exceeds 5%Little or no foam with reactors at 165 CDigesters resilient to feed changesAt 50% Primary/50% Secondary Solids VSR improved by 20% to 30%(50% VSR to 65% VSR)Gas yield proportionally higher with VSRDigested solids release water betterLow odor from digested/dewatered solids after 24 to 48 hours
Questions?Peter M. Loomis, PE703.691.6442loomispm@cdmsmith.com97
Why Thermophilic Digestion? Increaseddigester capacity Class A Biosolidswhen timetemperaturerequirement ismet Cost savings fromfewer digesters Meet siteconstraintsWhat is ThermophilicDigestion?Mesophilic95 to 98 F(35 to 37 C)Thermophilic125 to 140 F(52 to 60 C)
Single-Stage or Multiple-StageContinuous versus Batch Thermophilic Digestion
Temperature-Phased Anaerobic Digestion ilic Compared to MesophilicAnaerobic DigestionAdvantages Increased digestercapacity Increased solidsdestruction Greater biogas production Possible decrease inhydrogen sulfide in biogas Improved biosolids quality Class A biosolids withbatch processDisadvantages Higher operatingtemperatures Increased heat demand Requires more heatexchangers Possible increase insiloxanes in biogas Increased odor atdewatering
Converting from Mesophilic to Thermophilic Digesters must beable to structurallyhandle thermophilictemperatures Additional heatexchangers arerequired for sludgeheating Heat recoveryexchangers may beadded for energyefficiency Digester heatingsystem must be ableto supply more heatat a highertemperatureTargeted Parameters for Digester MonitoringParameterpHTemperatureTarget Range6.8 to 7.7Mesophilic 35 deg C (95 deg F)Thermophilic 55 deg C (130 deg F)Volatile Solids ReductionVolatile Acids (VA)Alkalinity (ALK) as CaCO3greater than 50%less than 1,000 mg/LMesophilic: greater than 1,000 mg/LAmmoniaVA/ALK RatioThermophilic: greater than 2,000 mg/Lless than 2,000 mg/L NH3-Nless than 0.2 or decliningCO2 in Digester GasCH4 in Digester GasSpecific Biogas Production(preferred under 0.1)less than 40% by volumegreater than 60% by volumegreater than 0.9 Nm3/kg VSRFoaming(15 scf/lb VSR)little or none
Examples of Thermophilic Digestion Operations Los Angeles, CAOakland, CASan Francisco, CASt Joseph, MO Duluth, MNColumbus, GAVancouver, BCTel Aviv, IsraelDan Region WWTP (SHAFDAN)
Multi-Staged Thermophilic DigestionDigester FeedTanksPrimary SludgeThickened WASSludge watering(6)Thermophilic DigestersDigestedSludgeStorageTankThermophilic Heat Supply: 11 MW CogenerationSystem with Eight 1.4 MW Packaged Units Heat supplysystem designedfor thermophilictemperatures andengine heatrecovery Boilers provideheat for startupand backup heatDan Region Shafdan WWTP, Tel Aviv, Israel,
Thermophilic Digestion Summary Advantages for capacity, Class A,cost savings, tight site Anaerobic digestion at 125 – 140degrees F (50 – 60 degrees C) Differences betweenthermophilic and mesophilicdigestion Same key control variables asmesophilic digestion Mesophilic digesters can beconverted to thermophilicdigesters Examples of thermophilic digestionsystemsQuestions?David L. ParryPh.D., PE, BCEEdave.parry@ch2m.com112
Questions? How to ParticipateToday Audio Modes Listen using Mic &Speakers Or, select “UseTelephone” and dial theconference (pleaseremember long distancephone charges apply). Submit your questions usingthe Questions pane. A recording will be availablefor replay shortly after thiswebcast.
Nov 02, 2017 · Anaerobic Digestion 101 November 2, 2017 1:00 – 3:00 pm Eastern WEF Pl