Transcription
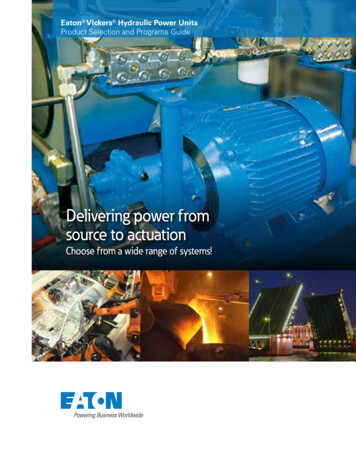
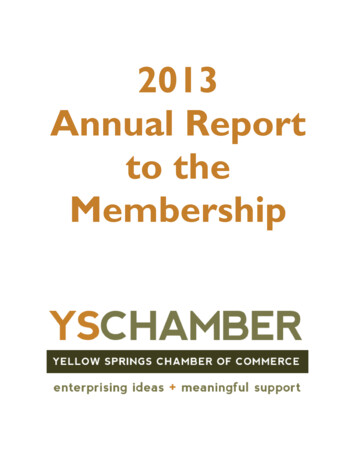
MEMORANDUMTo:From:Date:Subject:Mark TaylorAvenue ConsultantsSeptember 26, 2018Yellow and Red Actuation ATSPM Study1 PURPOSE AND NEEDThe Yellow and Red Actuation (YRA) is a metric found in the Utah Department of Transportation’s (UDOT)Automated Traffic Signal Performance Measures (ATSPM) that shows the number of vehicles passing thru asignalized intersection in the yellow and red clearance intervals and during the red phase of a given movement.Figure 1 shows an example of this metric with several detector activations (black dots). Initial review of the YRAmetric at several intersections showed an excessive number of vehicles traveling through the red phase.To determine if the number of vehicles passing the stop bar on red is unrealistic, UDOT asked AvenueConsultants to verify if a latency exists from the time a vehicle passes through the intersection to the time thecontroller logs the event. The goal of this study is to determine if a standard latency value could be appliedat all intersections with the YRA ATSPM to calibrate the output to show more realistic results.As part of this study, we:1. Determined the latency’s sources and magnitude,2. Identified trends, and3. Calculated a recommended speed for the filter used in the detector zone for the YRA ATSPM, which willensure that vehicles displayed in the ATSPM are not stopping but are passing thru the intersection.Figure 1: Yellow and Red Actuation ATSPM (5600 W & 2700 South intersection)Page 1
Yellow and Red Actuation ATSPM Study September 26, 20182 METHODOLOGY2.1 Data CollectionData was collected using two different methods to determine if latency exists in the system. For the first method,data was collected at the Traffic Operations Center (TOC) using the communications network that connects thetraffic signals to the central computer system (MaxView) at the TOC. For the second method, data was collectedonsite at the study intersections using webcams. This method was performed to eliminate any latency betweenthe traffic signal and the TOC’s central computer system, which could negatively affect the results.2.1.1 Traffic Control Center (TOC) DataAt the TOC, yellow and red actuation ATSPM data was collected over UDOT’s communications network fromthe software programs summarized in Table 1 using Snagit, a screen capture software.Table 1: TOC Data Collection SoftwareSoftwarePurposeWavetronix SmartSensorManagerTo identify when the Wavetronix Matrix detector located a vehicle and places acallTransuite VCSTo record when vehicle arrive at the detector (UDOT’s traffic camera program)Controller Front Panel SoftwareTo determine when the controller receives the call from the sensorOnline StopwatchTo measure time between when vehicle arrives to when the sensor logs the calland when the controller receives that call.Recording these items allowed for the latency to be tracked following the path outlined in Figure 2 below.Figure 2: Detector Call Path Tracked at TOCWe measured two latencies at the TOC to be able to determine the overall latency between the vehicle arrivingat the detector zone and the controller receiving the call, they latency measured included:1. Actual vehicle arrivals at the detection zone near the intersection stop bar (using UDOT’s CCTV trafficcameras) and when the detector acknowledges a vehicle arrival (using the SmartSensor software), and2. When the detector acknowledges a vehicle arrival and when the controller receives the detection call(using the Front Panel software).The latency in the system was then measured by calculating the difference in timestamps between each eventin the process described above and then averaging all events (minus outliers). The average latency calculatedusing this method was an average 1.5 seconds.While the data collection at the TOC provided some initial measurements and confirmed the presence of latencyin the system, concerns were identified about the data collection method. In particular, collecting data over thecommunications network could be adding to the latency due to the delay between the data source and thePage 2
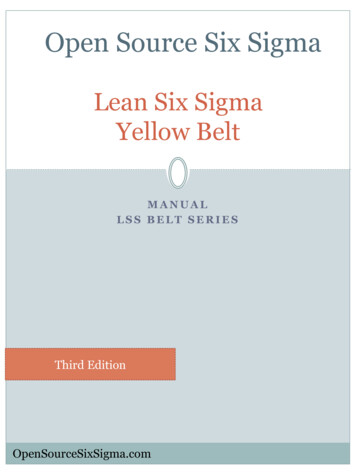
Yellow and Red Actuation ATSPM Study September 26, 2018TOC. Each of the data sources could have different delays, causing the latency measurements between therecorded events to be affected. Based on this concern video data was collected in the field to provide a moreaccurate, “real-time” measurement.2.1.2 Field Video RecordingThe data in the field was collected using four webcams connected directly to a laptop at the intersection andthen screen captured using the Snagit software. The webcams used were Logitech C922, selected due to theirability to capture at 60 frames per second. The webcams were focused on the (1) intersection stop bar, (2) signalcontroller detector screen, (3) signal load switches, and (4) Click 650. Table 2 describes the purpose for eachitem recorded, including the webcams.Table 2: Field Data Collection Recorded ItemsNo.Item RecordedPurpose1Intersection Stop Bar2Signal Controller Detector Screen3Wavetronix SmartSensor Managerv2.1.04Signal Load Switches5Click 650Determine the signal state when each vehicle passes through theintersection. (Not always recorded)Record the intermediate step between the sensor logging the call andthe controller receiving that call.61/10 of a second timerTo determine a timestamp that will allow measurement of latencybetween the steps to a 1/10 of secondIdentify when the vehicle arrives at the detector zone location that isused for the YRA ATSPMDetermine when the controller receives and logs the call from thesensor.Identify when the Wavetronix Matrix detector located a vehicle andplaced a call.Figure 3 is a screenshot of the laptop showing how the data from Table 2 was recorded using the screen capturesoftware.Page 3
Yellow and Red Actuation ATSPM Study September 26, 2018Figure 3: Field Data Collection ScreenshotTo ensure that the location of the detector zone in the Wavetronix SmartSensor Manager software was correct,the zone was determined by physically walking the location, which showed up on the SmartSensor software.Recording these items allowed for the latency to be tracked following the path outlined in Figure 4 below.Figure 4: Detector Call Path Tracked in the FieldWe measured three latencies in the field to be able to determine the overall latency between the vehicle arrivingat the detector zone and the controller receiving the call, they latency measured included:1. Between the actual vehicle arrivals at the detection zone near the intersection stop bar (using awebcam) and when the detector acknowledges a vehicle arrival (using the SmartSensor software),2. Between when the detector acknowledges a vehicle arrival and when the Click 650 receives the callfrom the detector (using a webcam), and3. Between when the Click 650 receives the call and when the controller receives the detection call (usinga webcam).Another item of concern is that there are likely other variables that effect the latency that could not beconsidered in this study, including the type of controller and the sensor version and the presence of a Click 650(all of the locations used in this study had a Click 650). Information about each of the locations recordedincluding the date and type of software are shown in Table 3.Page 4
Yellow and Red Actuation ATSPM Study September 26, 2018Table 3: Field Data Collection SummaryLocationTrafficMovement5600 W & 2700 SSBT5600 W & 2700 SSBL5600 W & 2700 SWBT11-14-20175600 W & 2700 SWBL11-14-20173300 S & West TempleWBT12-05-201710600 S & 700 ENBT01-31-201810600 S & 700 avetronixMatrixVersionClick 102.1.01.1.02.26.102.1.01.1.02.1.3 Speed Filter Data CollectionAdditionally, 5 mph, 10 mph, and 15 mph speed filters were tested in each lane to determine what speed filtershould be applied to the detector zones to avoid registering vehicles that have stopped in the detector zone.The detector zones were placed on top of each other at the stop bar and were compared against a detectorzone without a speed filter. Due to limitations in the number of detector channels at some of the intersections,it was not always possible to test all three speed filters at the same time. In those cases, the speed filters wererotated through until all were utilized to collect data. Two intersections were added during this step; 2700 Weston Bangerter Hwy, and 4420 West on 5400 South. 2700 West on Bangerter Hwy was selected to represent anintersection with higher speeds and 4420 West on 5400 South represents an intersection with lower speeds.2.2 Data ProcessingThe latency measurements from the data recorded at the TOC and in the field was processed using the samemethod. The videos were watched through the Snagit Editor to allow for frame by frame viewing. Thetimestamps for each event was then documented for each vehicle passing through the detector during thevideo. From these timestamps the latency was calculated. In order to investigate if there was a measurablerelationship between the speed of the vehicle and the latency, the speed for each vehicle was estimated bydocumenting the timestamp when the vehicle reached the stop bar and when it passed through the other sideof the crosswalk. Using the distance between these two locations and the timestamps, the speed of vehicle wascalculated. This collection method for the speed is only an estimate as the short measurement distance addedto the inaccuracy of the speeds.3 STUDY RESULTS3.1 YRA Metric Detector LocationFor the YRA metric, the detector zone should be placed on the stop bar to avoid categorizing a vehicle thatenters the intersection during a yellow light as a red-light runner (which could occur if the detector is placedbeyond the stop bar in the intersection). Placing the detector zone on the stop bar will also help avoidPage 5
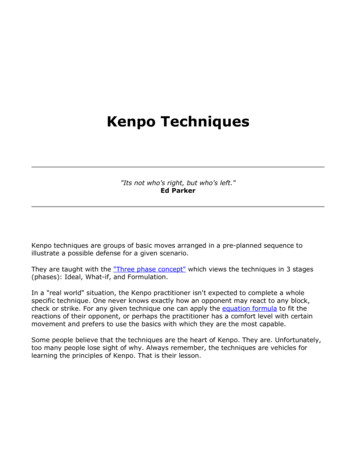
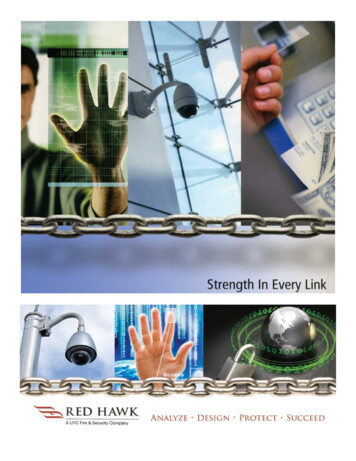
Yellow and Red Actuation ATSPM Study September 26, 2018categorizing a vehicle that enters the intersection on a red light as entering on yellow light (if the detector isplaced upstream of the stop bar).3.2 Latency measurementsThe calculated latency values from the field video data collection are found in Table 4 arranged by movement.Overall, the mean latency was 1.24 seconds with a standard deviation of 0.31 seconds. While the averagelatency varied by approach, from 0.89 seconds to 1.82 seconds, the 95% confidence intervals indicate that themean latency across all sites is likely between 1.22 seconds and 1.26 seconds.Table 4: Field Data Collection ResultsIntersectionMovement5600 W & 2700 SSBTPostedSpeed Limit(mph)451.49StandardDeviation(sec)0.235600 W & 2700 SSBL451.820.28 0.085600 W & 2700 SWBT350.940.19 0.055600 W & 2700 SWBL350.890.13 0.043300 W & West TempleWBT351.150.24 0.0410600 S & 700 ENBT401.110.21 0.0410600 S & 700 EWBT351.350.15 0.05Bangerter Hwy & 2700 WWBT601.110.19 0.025400 S & 4420 WSBT251.390.47 0.15Combined----1.240.31 0.02MeanLatency (sec)95% ConfidenceInterval (sec) 0.03The distribution of calculated latency values is shown in figure 5 below. Overall, this distribution shows a spreadof latency values centered around the average of 1.24 and with most values within a standard deviation. Someof the variation in latency values can be accredited to the data collection method since it required a visualdetermination of when the vehicle arrived at the detection zone and was limited to intervals of 1/10 of a second.Additionally, some can be attributed to there being a 1/10 of the second interval at which the controller is ableto process the data.Histograms which show the distribution for the thru movements at each individual signal can be found in theappendix.Page 6
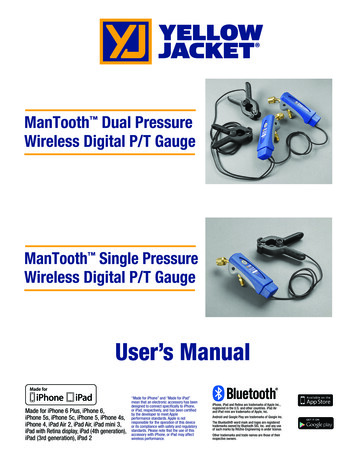
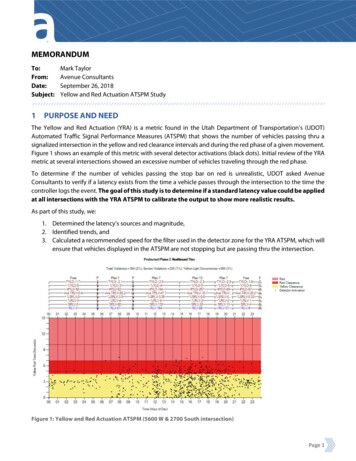
Yellow and Red Actuation ATSPM Study September 26, 2018Figure 5: Distribution of Latency Measurements3.3 Speed vs. LatencyInitially it was believed that vehicle speed had some level of influence on the latency. To identify if there was arelationship between speed and latency, the speed of each vehicle was calculated by measuring the time avehicle traveled between two fixed points in the video. The results of the calculated latency and speed for eachvehicle is shown in Figure 6.Page 7
Yellow and Red Actuation ATSPM Study September 26, 2018Speed Latency RelationshipThru Movements Only3.002.50Latency (s)2.005600 W & 2700 S SBT5600 W & 2700 S WBT1.503300 S & West Temple WBT10600 S & 700 E WBT10600 S & 700 E NBT1.00Bang Hwy & 2700 W WBT0.500.00010203040506070Speed (MPH)Figure 6: Speed Latency Relationship for all Thru MeasurementsIn an attempt to better understand the relationship between speed and latency, scatter plots were generatedseparately for each intersection, specifically for the through movements. Figure 7 shows the speed-latencyrelationship at Bangerter Highway and 2700 West. A trendline was plotted on the scatterplot and an R2 valuewas calculated, which statistically measures how well the trendline correlates with the data points. The closerthe R2 value is to 1, the more accurately the trendline explains the relationship between the data points. A reviewof these scatterplots and the resulting R2 values (R2 0.003 for the data at Bangerter Highway and 2700 West)did not show a conclusive relationship between speed and latency. The inconclusive results may partially bedue to the inaccuracies in how the speeds were measured within a short distance (typically around 15 ft). Thespeeds were calculated using the original video footage, which was not set up for the intent of collecting speedsand had a limited view of the roadway.The scatter plots for the through movements at the remaining intersections, which produced similar results,can be found in the appendix.Page 8
Yellow and Red Actuation ATSPM Study September 26, 2018Speed Latency RelationshipThru Movements Only2.001.801.601.40Latency (s)1.201.00Bang Hwy & 2700 W WBTLinear (Bang Hwy & 2700 W WBT)0.80R² 0.00330.600.400.200.00010203040506070Speed (MPH)Figure 7: Speed Latency Relationship for WBT at Bangerter Hwy and 2700 W3.4 Speed FilterA speed filter is utilized within the Matrix sensor for YRA zones to ensure that only vehicles entering theintersection are registered and that vehicles slowing to a stop at the stop bar are not registered. To determinethe ideal speed filter for the YRA for both thru and left turn lanes, 5 mph, 10 mph and 15 mph speed filter settingswere tested by stacking detector zones for each speed filter on top of each other at the stop bar in each lane.The results showed that vehicles that stopped on the stop bar were not registered by any of the speed filters.One consideration is that in the recorded samples all vehicles slowed down at a normal rate and did not haveto make an emergency stop. Nor did any vehicles, while slowing to a stop, pass through the detector and intothe crosswalk or partway into intersection. Although rare, in these cases there is the possibility that vehiclescould be detected. In the majority of cases any of the speed filters will remove vehicles stopping at the stop barfrom the YRA metric.Page 9
Yellow and Red Actuation ATSPM Study September 26, 20183.5 ConclusionBased on the results of this evaluation, below are three recommendations for improving the accuracy of theYRA metric:1. Adjust the detector actuations according to the average latency of 1.2 seconds2. Locate the YRA detector zone on the stop bar3. Set the YRA speed filter to 5 mph for both thru and left turn lanesAdjusting the ATSPM data based on this latency measurement will help to improve the Yellow and RedActuation ATSPM and provide a more accurate comparison of signal with potential red-light running issues.However, variations are still inherent in the latency calculations, which could be due to vehicle speeds, but isinconclusive with the available data. Other factors such as weather, vehicle type, distance of the sensor fromthe cabinet, software type, and vehicle accelerating or decelerating were not considered in this study but couldhave an impact on latency.Placing the detector at the stop bar will provide a more accurate representation of when vehicles cross the stopbar and enter the intersection. Placing the detector farther into the intersection or upstream of the stop bar mayresult in an inaccurate number of red light actuations.The purpose of the speed filter is to ensure that vehicles coming to a stop at the stop-bar do not actuate thedetectors to avoid a false reading in the YRA metric. The results of the speed filter analysis indicate that vehiclespassing over the detector but stopping before entering the intersection are likely to be filtered out by any ofthe three speed filter settings evaluated (5, 10, and 15 mph). Therefore, the 5 mph speed filter should preventvehicles stopping at the stop bar from showing up on the YRA metric.Page 10
Yellow and Red Actuation ATSPM Study September 26, 2018APPENDIX1 STUDY LOCATION DETECTOR ZONE SETUPSB 5600 W and 2700 SWB 5600 W and 2700 SNB 10600 S and 700 EWB 10600 S and 700 EPage 11
Yellow and Red Actuation ATSPM Study September 26, 2018WB 3300 S and West TemplePage 12
Yellow and Red Actuation ATSPM Study September 26, 20182 HISTORGRAMS OF LATENCY MEASUREMENTSPage 13
Yellow and Red Actuation ATSPM Study September 26, 2018Page 14
Yellow and Red Actuation ATSPM Study September 26, 2018Page 15
Yellow and Red Actuation ATSPM Study September 26, 20183 SPEED LATENCY RELATIONSHIP GRAPHSSpeed Latency RelationshipThru Movements Only2.50Latency (s)2.001.505600 W & 2700 S SBTLinear (5600 W & 2700 S SBT)1.00R² 0.06960.500.00010203040506070Speed (MPH)Speed Latency RelationshipThru Movements Only2.50Latency (s)2.001.5010600 S & 700 E NBTLinear (10600 S & 700 E NBT)1.00R² 0.00030.500.00010203040506070Speed (MPH)Page 16
Yellow and Red Actuation ATSPM Study September 26, 2018Speed Latency RelationshipThru Movements Only3.002.50Latency (s)2.003300 S & West Temple WBT1.50Linear (3300 S & WestTemple WBT)1.00R² 0.03760.500.00010203040506070Speed (MPH)Speed Latency RelationshipThru Movements Only2.001.801.60Latency (s)1.401.201.0010600 S & 700 E WBT0.80Linear (10600 S & 700 E WBT)0.60R² 0.00320.400.200.00010203040506070Speed (MPH)Page 17
The calculated latency values from the field video data collection are found in Table 4 arranged by movement. Overall, the mean latency was 1.24 seconds with a standard deviation of 0.31 seconds. While the average latency varied by approach, from 0.89 seconds to 1.82 seconds, the 95% confidence intervals indicate that the