Transcription
Executive Programs &IT Key Metrics DataCountry Averages for MalaysiaC t dOCreatedOctobert b 2011This presentation, including any supporting materials, is owned by Gartner, Inc. and/or its affiliates and is for the sole use of the intended Gartner audience or otherauthorized recipients. This presentation may contain information that is confidential, proprietary or otherwise legally protected, and it may not be further copied,distributed or publicly displayed without the express written permission of Gartner, Inc. or its affiliates. 2011 Gartner, Inc. and/or its affiliates. All rights reserved.
Content Overview Sample Statistics IT Spending as a % of Total Revenues pg as a % of Operatingpg ExpensespIT Spending IT Spending per Company Employee IT Employees as a % of Company Employees In House vsvs. Contract IT Employees Capital vs. Operational IT Spending IT Spend Distribution (HW, SW, Personnel, Outsourcing) IT SpendSDistribution (Run,(GGrow, Transform)f) Spending & StaffingSource: Gartner Benchmark Analytics - IT Key Metrics Data 2011 Gartner, Inc. All Rights Reserved.1
Assessment OverviewThe purpose of this report is to provide a high level overview of IT investmentand staffing levels and distributions within Malaysia as compared to GartnerBenchmark Analytics global database averages.The data from the Malaysian organisations was collected as part of a special Gartnerproject conducted between July and September 2011. IT costs were based on theorganisations 2011 financial year,ear whilsthilst ReRevenueen e and Operating EExpensespenses wereerebased on the prior financial year.The Gartner database averages were sourced from the Gartner IT Key Metrics Data2011 publication series,series published in December 20102010.Both the Malaysian averages and the Gartner Database Averages represent a mix oforganizations of different sizes and vertical industry segmentations. And therefore themake up of the sample may have an impact on the overall results shown.As with any data, many potential interpretations and analyses exist, so thesemeasures should be considered in the context of your organizations future stateobjectives and your niche competitive landscape.Your organization should assess its own situation carefully, and should not, arbitrarily,change to conform to published data (which do not necessarily represent bestpractices).Source: Gartner Benchmark Analytics - IT Key Metrics Data 2011 Gartner, Inc. All Rights Reserved.2
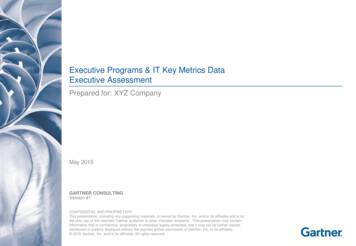
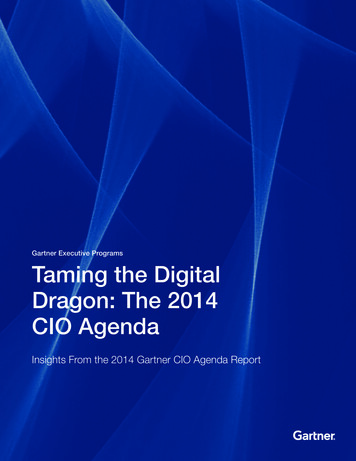
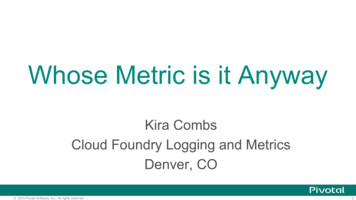
Revenue DistributionMalaysia Sample4%10B USD30%1B - 10B USD500M - 1B USD8%250M - 500M USD8%50%Less than 250M USD0%10%20%Total contributing data points:30%40%50%60%- Malaysia Sample 24- Gartner Database 2252Source: Gartner Benchmark Analytics - IT Key Metrics Data 2011 Gartner, Inc. All Rights Reserved.3
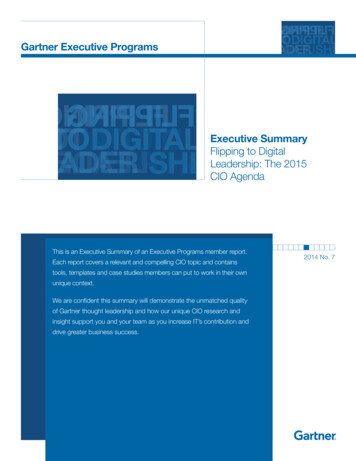
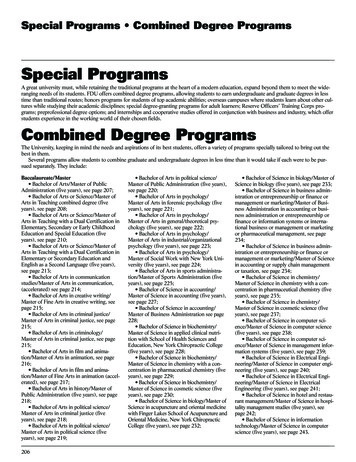
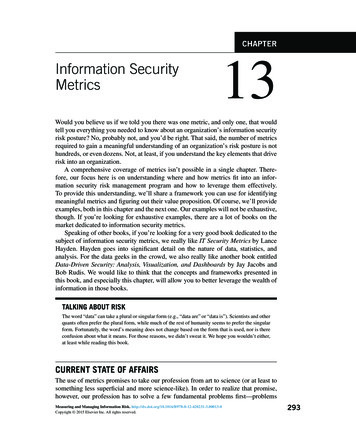
Industry DistributionMalaysia SampleBanking and Financial Services21%Government - National/International17%Construction, Materials, and NaturalResources13%Professional Services13%Transportation8%Media and Entertainment8%Insurance8%Ch i lChemicals4%Retail and Wholesale4%Education4%0%5%Total contributing data points:10%15%20%- Malaysia Sample 24- Gartner Database 2252Source: Gartner Benchmark Analytics - IT Key Metrics Data 2011 Gartner, Inc. All Rights Reserved.425%
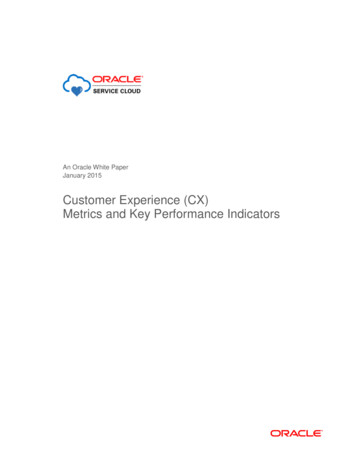
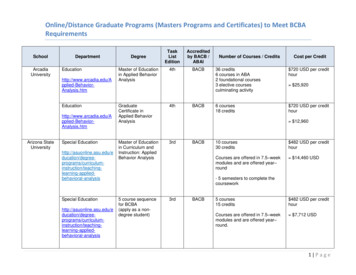
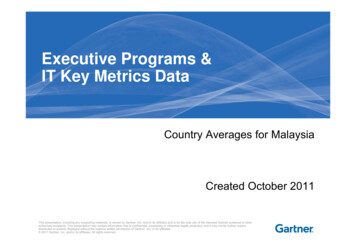
IT Spending as % of Total Revenues30%25%20%15%10%5%4.3%3.5%0%Malaysia AverageDatabase AverageCylinders denotes the median 50% of responses Range Average Middle QuartilesSource: WorldwideIT Benchmark ServiceSource: Gartner Benchmark Analytics - IT Key Metrics Data 2011 Gartner, Inc. All Rights Reserved.5
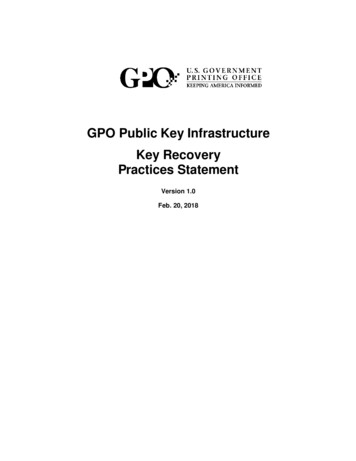
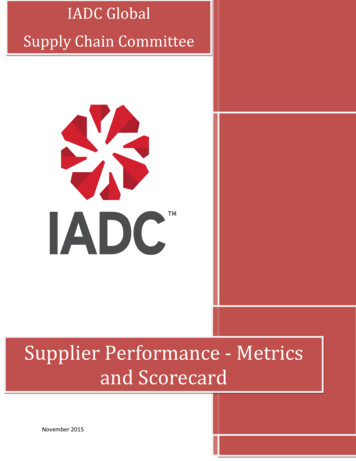
IT Spending as % of Operating Expenses35%%30%25%20%15%10%6.1%5%4.3%0%Malaysia AverageDatabase AverageCylinders denotes the median 50% of responses Range Average Middle QuartilesSource: WorldwideIT Benchmark ServiceSource: Gartner Benchmark Analytics - IT Key Metrics Data 2011 Gartner, Inc. All Rights Reserved.6
IT Spending per Company Employee 100 000 100,000 90,000 80,000 70,000 60,000 50,000, 40,000 30,000 20 000 20,000 12,350 10,000USD 6,437 0Malaysia AverageDatabase AverageCylinders denotes the median 50% of responses Range Average Middle QuartilesSource: WorldwideIT Benchmark ServiceSource: Gartner Benchmark Analytics - IT Key Metrics Data 2011 Gartner, Inc. All Rights Reserved.7
IT Employees as % of Total Employees35%30%25%20%15%10%5.4%5%3.7%0%M lMalaysiai AverageAD t bDatabaseAAverageCylinders denotes the median 50% of responses Range Average Middle QuartilesSource: WorldwideIT Benchmark ServiceSource: Gartner Benchmark Analytics - IT Key Metrics Data 2011 Gartner, Inc. All Rights Reserved.8
IT Staffing DistributionIn House vs. Contract EmployeesMalaysia Average90%10%In HouseC t tContractorsDatabase Average81%0%20%40%Source: Gartner Benchmark Analytics - IT Key Metrics Data 2011 Gartner, Inc. All Rights Reserved.919%60%80%100%
IT Spending DistributionCapital & Operational SpendMalaysia Average37%63%OperationalCapitalDatabase Average0%20%40%Source: Gartner Benchmark Analytics - IT Key Metrics Data 2011 Gartner, Inc. All Rights Reserved.25%75%1060%80%100%
IT Spending DistributionHardware SoftwareHardware,Software, PersonnelPersonnel, OutsourcingMalaysia AverageDatabase Average0%HardwareSoftwarePersonnel (includingOccupancy)Outsourcing (includingTransmission)20%40%60%80%Database Average17%21%Malaysia Average23%27%41%22%21%28%11100%
Spending DistributionRun, Grow, TransformMalaysia Average64%22%14%RunGrowTTransformf67%Database Average0%20%19%40%Source: Gartner Benchmark Analytics - IT Key Metrics Data 2011 Gartner, Inc. All Rights Reserved.1260%80%14%100%
Spending DistributionBy Technology DomainMalaysia AverageDatabase Average0%Data CenterClient & Peripherals10%20%30%40%50%60%70%80%Database Average20%Malaysia Average28%11%13%IT Help Desk7%6%Data Network10%12%Voice Network7%2%Application Development18%16%Application Support16%13%IT Management7%4%Finance & Administration4%6%Source: Gartner Benchmark Analytics - IT Key Metrics Data 2011 Gartner, Inc. All Rights Reserved.1390% 100%
Staffing DistributionBy Technology DomainMalaysia AverageDatabase Average0%10%20%30%40%50%60%70%80%Database Average16%Malaysia Average21%Client & Peripherals12%12%IT Help Desk10%10%Data Network8%7%Voice Network5%2%Data CenterApplication Development20%18%Application Support17%17%IT Management8%6%Finance & Administration4%7%Source: Gartner Benchmark Analytics - IT Key Metrics Data 2011 Gartner, Inc. All Rights Reserved.1490% 100%
Gartner Benchmark AnalyticsIT Key Metrics Data (ITKMD) The Gartner IT Keyy Metrics Data reportspcontain importantpdatabase averagesg froma subset of metrics and prescriptive engagements available through GartnerBenchmark Analytics.y in December,, ITKMD allows clients to rapidlyp y identifyy trends and Published annuallyhigh-level averages in IT spending and staffing across 21 different industries inaddition to offering high-level insight into unit costs and performance metrics acrosscritical IT domains. A leading resource for IT measurement data since the early 1990s and amongstGartner’s most popular research. Includes data from thousands of companiescompanies, with a strong sampling of Fortune 500and Global 2000 enterprises Information is collected globally, year-round through direct fact finding in our manybenchmarking and consulting engagements,engagements through surveys of the Gartnercommunity, at Gartner events, in addition to surveys of non Gartner basedcommunities. Financial information, such as revenue and operating income, is alsocollected from secondaryy research sources,, such as annual reports.pSource: Gartner Benchmark Analytics - IT Key Metrics Data 2011 Gartner, Inc. All Rights Reserved.
Information Provided byGartner Benchmark AnalyticsIf you have any questions regarding this report, please contact us at:KMDInfo@gartner.comTo learn more about Gartner Consulting’s Benchmark Analytics solutions,go gartner benchmark solutions brochure.pdfor contact us at: benchmarkinginfo@gartner.comTo learn more about IT Key Metrics Data please visit our website atwww.gartner.com/itkmdt/itk d16
Gartner delivers the technology-relatedg necessaryy for our clients to makeinsightthe right decisions, every day.17
Executive Programs & IT Key Metrics Data Country Averages for Malaysia C t d O t b 2011Created October 2011 This presentation, including any supporting materials, is owned by Gartner, Inc. and/or its affiliates and is for the sole use of the intended Gartner audience or other authorized recipients.