Transcription
EarthLink Overview0
EarthLink TodayLeadingNationwide ITservices, networkandcommunicationsproviderOver 3,000employeesOver 1.2 millioncustomer relationshipsOver 1.2 billion in revenue- 94% Business Services and Broadband1
Investment Thesis Improving revenue trajectory– 150M retail growth business growing at 20% per year with differentiated ITservice offering– 150M wholesale growth business with unique fiber routes– Lower churn and better product mix of new bookings– Nationally recognized and trusted brand Substantial cash flow– Legacy customer business generating meaningful cash flow Strong balance sheet and significant tax assets2
Opportunity Beyond Current ValuationEnterprise Value/EBITDA(1)EarthLink Share Price Sensitivity(2)14.0EV/EBITDA Multiple(1)12.8 12.7 12.7Theoretical Share Pricebased on „13 EBITDA Consensus(2)5.0x5.5x6.0x6.5x 6.56 7.62 8.68 LNKCBEYEnterprise Value/EBITDA is calculated using Enterprise Value based on market capitalization as of 5/3/13 less Q4 ‘12 Ending Cash minus Debt divided by FY ‘13 consensus for EBITDA. All datasourced from Thomson Reuters.(2) Theoretical share price sensitivity with (1)% - 0% organic revenue decline. Not intended to predict future share price.Adjusted EBITDA is a non-GAAP measure. See appendix for additional information on non-GAAP measures(1)We are currently valued well below our peers3
Financial Snapshot / Q1 Recap2013 Guidance(1)Revenue 1,255M - 1,268MAdjusted EBITDA(2) 214M - 227MNet Loss (282)M - (276)MImplied EPS(3) (2.74) - (2.68)Capital Expenditures 140M - 155MQ1 ’13 Recap –(1)(2)(3)(4) 192MGross Debt 593MNet Cash Balance (400)MMarket Cap(3)(4) 604MEnterprise Value(4) 1,004MDividend Yield(4)3.4%65% of sales in Q1 came from Growthproducts Retail and Wholesale productivityup nearly 50% and nearly 65%respectively Rolled out 4 of 5 next generationdata centers and have completednearly 70% of fiber expansion The combination of higher bookingsand lower churn led toimprovements in both Business andTotal Company revenue trajectoryBalance Sheet & ValuationCash BalanceStrongest sales quarter in over ayear in terms of bookingsGuidance as of date of earnings announcement (5/2/13); not being updatedAdjusted EBITDA is a Non-GAAP measure. See appendix for additional information on non-GAAP measuresAssumes Q1 Fully Diluted shares outstanding of 103MMarket Cap, Enterprise Value and Dividend Yield assume share price as of 5/3/13. All other balance sheet data as of 3/31/134
Market Opportunity5
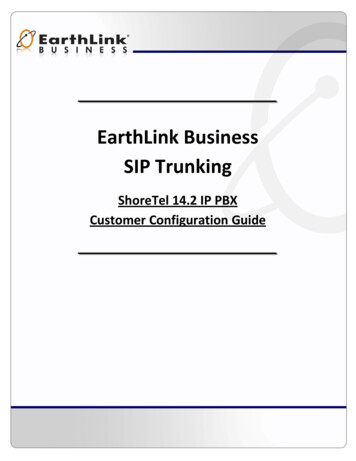
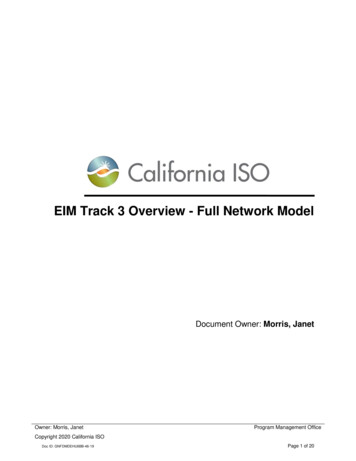
Market Opportunity for EarthLinkSmallBusiness, 116bFortune1000, 33bMidMarket/Enterprise, 177b 326 Billion Nationwide IT Spend MarketThe market for IT Services is large. EarthLink‟s product portfolio will enablethe company to compete for 100 Billion of the 177 Billion in MidMarket/Enterprise opportunity6Source: EarthLink customer revenue and analysis, D&B industry segmentation, TNS spend / opportunity sizing, and Computer Economics Annual IT Budget Benchmark Survey, December 2010
Challenges for Mid Market CustomersSmall BusinessMid Market /EnterpriseFortune 1000Customer Challenges Consumers increasingly wantto buy virtually Complex regulatory and compliancerequirements – PCI, HIPAA, etc. Total cost of running IT infrastructure is growingfaster than the top line Technology is changing every day. Customers lack theresources to keep up with the increased complexity and risk inthe IT world7
Why VARsManagedHostingConsultativeBreadth ustomers can turn to EarthLink as a trusted partner8Source: EarthLink customer revenue and analysis, D&B industry segmentation, TNS spend / opportunity sizing
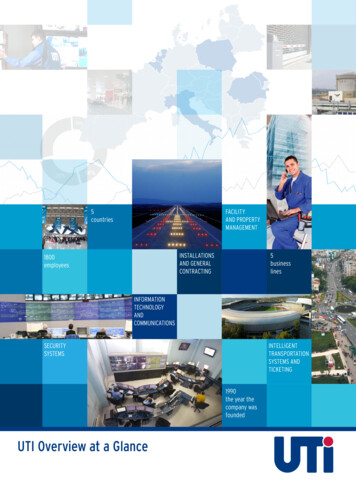
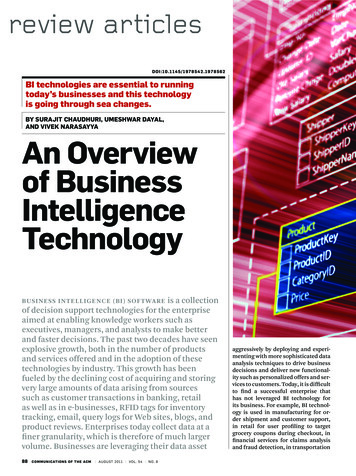
Trusted eam29%Level328%XOtw telecom24%22%MegaPath19%Cbeyond19%A brand study of IT professionals shows EarthLink has the highest brandrecognition among competitive communication providers. We are investingmore in the brand to build awareness in the IT Services space.Source: 2010 B2B Telecommunications Study9
Strategic Product PortfolioEarthLink‟s Roadmap is focused on solutions which allow our customers more time andresources to focus on day to day business. We can be an extension of their IT Staff.myLink CustomerControl PointData d HostingCloud WorkspaceCloud BackupDisaster RecoveryDedicated ServerWeb HostingSecurity ServicesApplicationServicesSecure EmailEmail EncryptionEmail ArchiveSecure File SharingCore PortfolioDifferentiatorsManagedSupportService One Stop Shop forEvolving IT Needs Service Model andCustomer Resources Private Cloud,Secure Networkingvia DistributedAccess Network Control Point /myLink ToolsetManaged ColocationManaged Cloud HostingEarthLink TechCareHosted Network Security, Managed Firewall, Secure RemoteAccess, Asset Management, Laptop SecurityIP Voice and Data ServicesMPLS Networks, Hosted VoIP, InternetAccess, Integrated Voice & Data, SIP & PRI,Mobile Voice10
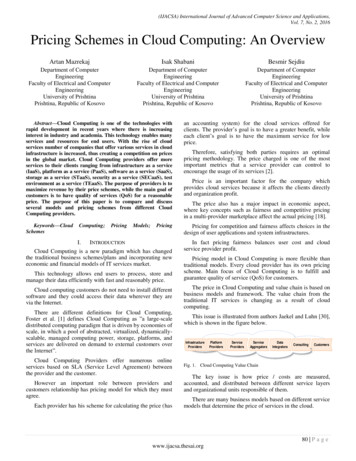
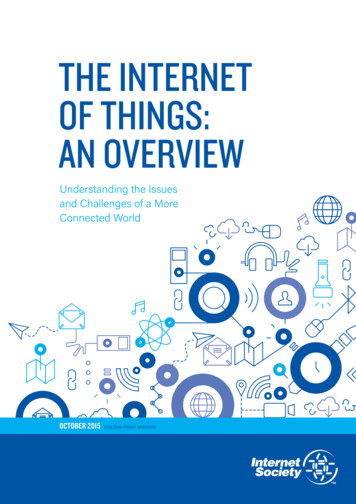
Network & Data Center FootprintRochesterLiveCurrent Data CenterNew Data CenterMarlborough2nd Gen IT Services1st Gen IT ServicesChicagoLiveNational CoverageSan JoseLiveOriginal Acquired FiberNew Fiber ExpansionAtlantaColumbiaDallasLiveMiamiMid ‘13We have a broad network footprint that provides coverage across over 90% of the country.We have expanded our data center presence and added new network routes: Allows for lower latency, customer bridging and a more fault-tolerant enterprise class product Network and data center combination creates an end-to-end cloud solution11
Sales Progress12
Improved MRR and Mix of BookingsNew Bookings - MRR 3.2M 3.2M 3.4M 3.2M 84 million of total contractvalue sold 2.9MQ1 '12Q2 '12Q3 '12Q4 '12Q1 '13Business Bookings Mix7%40%34% 46%9%12%13%36% 50%37%50%39%25%65%40%60%54%50%50%35%Q1 '12Q2 '12Q3 '12Retail - CLEC & Legacy ProductsQ4 '12Retail GrowthQ1 represented ourstrongest sales quarter inover a year65% of sales in Q1 camefrom Growth products Launched our nationwideproduct portfolio in Q1 „12 We expect the mix of sales tocontinue to improve as wecomplete the rollout of ournext generation cloud platformand unique fiber routesQ1 '13Wholesale Growth13Charts are MRR only and exclude non-recurring/usage based revenues
Sales ProductivityRetail - Sales Productivity 3.5kPer Rep / Month 3.1k 3.0k 2.5k 2.2k 2.3kQ1 '12Q2 '12 2.1k 2.1kQ3 '12Q4 '12 2.0k 1.5k 1.0k 0.5k Q1 '13Total Retail/Wholesale – Sales Productivity Averaged 3.1k in monthlyRetail rep productivity in Q1‟13 200 fewer employees inQ1‟13 than we had last year Positive early traction fromSEM & advertising campaignsdriving leads to inside salesPer Rep / Month 4.5k 3.9k 4.0k 3.5k 3.0k 2.5kRetail productivity up 4550% from historical levels 2.3k 2.5k 2.4k 2.3kQ2 '12Q3 '12Q4 '12 2.0k 1.5k 1.0k 0.5kRetail/Wholesale productivityup 60-65% from historicallevels Averaged 3.9k in totalbusiness monthly repproductivity Q1 '12Q1 '1314Charts are MRR only and exclude non-recurring/usage based revenues
Churn Improvement Over TimeBusiness Services Churn(1)Churn in our Business segmentimproved 7bps in Q1 neComm DeltacomPre-Acq '10 Pre-Acq '104.0%Q1 '12Q2'12Q3 '12Q4 '12Q1 '13Consumer Churn(2)3.5% Business churn is well below preacquisition levels and while quarterlyresults can be lumpy, churn hasgenerally declined over time Driven by integration activities,improved product portfolio and accountmanagementConsumer churn of 2.2% in Q1’13 (new historical low) We expect further improvement overtime as mix of tenured customersincreases Nearly 70% of Consumer subscribershave been with us for 5 years3.0%2.5%2.0%1.5%Q1 Q2 Q3 Q4 Q1 Q2 Q3 Q4 Q1 Q2 Q3 Q4 Q1 Q2 Q3 Q4 Q1'09 '09 '09 '09 '10 '10 '10 '10 '11 '11 '11 '11 '12 '12 '12 '12 '1315(1)(2)Monthly average revenue churn excluding write-downs and write-ups for Total Business including Retail, Carrier , IT Services and Web HostingMonthly average churn
Revenue ComponentsAs ReportedFY 2012Q1 2012Q4 2012Q1 2013Q1 ’13 vs.Q1 ’12Variance 130M 31M 36M 37M21% in Millions 300Mannualizedrun-rateGrowthBusiness– was 280a quarteragoRetailGrowthWholesaleRetail CLEC& LegacyTotal BusinessConsumerTotal Company 152M 37M 39M 39MOutlook Expect to grow revenue at 20% orgreater5% Q4‟12 and Q1„13 included 3M and 1M, respectively, for favorablesettlements Installing large Q1 „13 sales in Q2 „13 Expect to grow at the high end of 02% market range as we capitalizemore on new unique routes 749M 193M 182M 172M-11% Anticipate this business will decline 10% for FY ‟13, including (8)Mremoval of systems revenue in 2H Declines are in high single digitswhen normalizing for settlements andsystems exit Improving further in ‟14 and beyond 1,031M 260M 256M 248M-5% Pre-acquisition, businesses weredeclining in double digits 318M 84M 75M 72M-14% 1,349M 344M 332M 320M-7% Expect Consumer to decline 13-15%for FY ‟13 and 12-13% in „14 Decline was over 10% a year ago16Revenue component amounts sourced from billing data. Retail Growth includes MPLS, IT Services and Hosted VoIP productsRevenue outlook information does not represent guidance and is not subject to being updated
Revenue TrajectoryAs ReportedNormalized for Run-Rate Activity(1)Business Services Revenue % YoYBusiness Services Revenue % YoYQ2 '11 Q3 '11 Q4 '11 Q1 '12 Q2 '12 Q3 '12 Q4 '12 Q1 '13Q2 '11 Q3 '11 Q4 '11 Q1 '12 Q2 '12 Q3 '12 Q4 '12 Q1 tal Company Revenue % YoY-12.6%-7.8% -6.9%-5.5%-5.0% -4.6% -5.6% -5.3%-8.2%Total Company Revenue % YoYQ2 '11 Q3 '11 Q4 '11 Q1 '12 Q2 '12 Q3 '12 Q4 '12 Q1 '13-9.2% -10.1%-10.9%-6.1% -5.8%Q2 '11 Q3 '11 Q4 '11 Q1 '12 Q2 '12 Q3 '12 Q4 '12 Q1 '13-7.1%-12.6%-10.9%-7.9% -7.3% -7.8% -7.4%-9.2% -8.7%While quarterly results are lumpy, we are executing towards positive growth.Expect further / larger improvement in Q2‟13.Pro-Forma for acquisitions(1) Normalized for dispute settlements17
Cash Flow & Balance Sheet18
Long Term Capital ExpendituresExcludes Network & Data Center Investment Announced in Q4 ‘12Success Based65% of SpendProjects19%Maintenance/Projects25% of SpendReal work36%Integration10% of SpendLong Term Trends We expect non-success based capital to remain relatively consistent Two-thirds of capital is success based Our capital demands as a percentage of revenue are lower than our peers19
Generating Substantial Cash FlowAdjusted EBITDA less CapEx Yield(1)50%39%40%30%23% 22% LLVLTCBEYTWTCCCOIRAXEQIXINAPTTM 22% yield as of Q4 ‟12, among the highest in our peer groupAdjusted EBITDA less CapEx yield is calculated using trailing twelve month (TTM) Adj. EBITDA minus TTM CapEx as of Q4 ‘12 divided by shares outstandingto derive Adj. EBITDA less CapEx per share.Adj. EBITDA less CapEx per share is then divided by the closing share price as of 5/3/13. All data sourced from Thomson Reuters.(1) Adjusted EBITDA is a non-GAAP measure. See appendix for additional information on non-GAAP measures20
Strong Balance SheetDebt MaturityCapitalization & Leverage ( M)Q1 '1310½% Sr.SecuredDeltacom Notes, 293M8⅞% Sr.UnsecuredNotes, 300M2012 2013 2014 2015 2016 2017 2018 2019Next Call Date for Bonds: 10½% - April 2013 at 105.25 8⅞% - May 2015 at 104.4EarthLink Cash and Marketable Securities 19210.5% Senior Secured Deltacom Notes due 2016 2938.875% Senior Unsecured Notes due 2019 300 150M Revolving Credit Facility (undrawn) -Gross Debt 593Net Debt 4002013 Adjusted EBITDA Guidance Midpoint(1) 221Gross Debt/EBITDA2.7xNet Debt/EBITDA1.8x We continue to generate cash andour leverage is low Redeemed 10% of outstanding10.5% Sr. Secured Deltacom notesin Q4 „1221(1)Adjusted EBITDA is a non-GAAP measure. See appendix for additional information on non-GAAP measures
Lower Leverage than Peers7.0Net Debt Leverage Ratio(1)6.0 We have lower leverage thanmost of our industry peers5.04.03.02.0 We can make investments inour network, products andsales motions to provide longterm returns1.00.0-1.08.0Gross Debt Leverage Ratio(1)7.06.0 Lower leverage provides usfinancial flexibility5.04.03.02.01.00.022All data above is sourced from Thomson Reuters and is as of 12/31/2012(1) Denominator for Debt Leverage Ratios is 2013 Consensus EBITDA
Significant Tax Assets 500M Federal NOLs –Legacy ELNK &Deltacom 700M State NOLsCurrently payinglow single digitmillions ofdollarsAssuming 50Mtaxable incomeaverage, weexpect to shieldcash taxes wellinto 2020s(1)One Comm purchasetreated as assetacquisition – Able todeduct Dep/AmortWe have tax assets that will save approximately 200 million of cash taxes23(1)Illustrative – if taxable income averaged 50 million annually
Company Has Substantial AssetsTax AssetsTax assets will save approximately 200 millionin cash taxesValue of FiberOriginal cost to build networks was 3 billionFiber assets have real terminal valueConsumer TailThe Consumer business generates over 100million of annual cash flow today, and will have atail for years to comeBusinessSegmentOngoing cash flow and opportunity for growthWe have substantial assets with terminal value24
Capital Allocation Strategy 15 Consecutivequarters Can be opportunisticwhen the tradingwindow is open We currently pay .05/share quarterlydividend Repurchased 31.6Mshares since 2007(1) 3.4% yieldDividendsBuybacks 74M of remainingauthorizationCapitalAllocation Continue to be opento evaluatinginorganictransactions and aimto preserve flexibilityon balance sheet Remain disciplinedand price sensitiveM&ADebt Redeemed 10% ofoutstanding 10.5%Sr. SecuredDeltacom notes in Q4’12 Considering ouroptions around theremaining Deltacomnotes25(1)As of March 31st 2013
SummaryWe have 300M of run rate growth business growing annually at over 10% IT Services is an emerging market with tremendous opportunity Full suite of product capabilities to address the marketWe are nearly complete with the rollout of our national cloud platform andfiber expansion We have seen favorable early traction on sales from our new wholesaleroutes and geographically dispersed cloud stacksWe are financially strong We generate cash We have the financial platform to support our business strategy We can capitalize on the opportunities aheadWe are focused on growth26
Appendix27
Executive TeamRolla P. HuffChairman and Chief Executive Officer Joined in June 2007 and led a restructuring effort thatfocused EarthLink on its core access and awardwinning customer service competencies.Leads a team of employees across the countrydedicated to building positive customer lifetime valuethat translate into positive shareholder value.30 year record of achievement as a business,operational and financial strategist.Former chairman and chief executive officer ofMpower Communications, a facilities-based providerof broadband data and voice services to businesscustomers, from 1999 until 2006 when successfullyclosed a 200 million all cash sale to anothercompetitive local exchange provider.Previously president and chief operating officer ofFrontier Communications, leading negotiation of 13billion merger with Global Crossing Ltd. JoinedFrontier in May 1998 as executive vice president andchief financial officer.Served more than 5 years with AT&T Corporationand AT&T Wireless, holding executive positionsincluding president, central United States for AT&TWireless responsible for wireless business in 15states, encompassing 1.6 million customers andmore than 1 billion in annual revenue.Senior vice president and CFO for AT&T Wirelessfrom 1995 to 1997. Prior to CFO, was financial vicepresident of AT&T's corporate mergers andacquisitions group, involved in the acquisition andintegration of McCaw Cellular, AT&T's successful bidfor 1.5 billion in PCS licenses, and the sale ofAT&T's interest in LIN Broadcasting.More than 10 years with NCR Corporation inaccounting, financial planning, and operations indomestic and international business units.Brad Ferguson, Chief Financial Officer Chief Financial Officer since August 2009. EarthLink's VicePresident, Controller since September 2005 and PrincipalAccounting Officer; previously EarthLink's Vice President,Commercial Finance and Treasurer.Joined EarthLink with merger with MindSpring Enterprises, Inc.in 2000, where he was Vice President, Treasurer of MindSpring.Previously member of the audit practice at Arthur AndersenLLP. Michael Toplisek, EVP, Sales & Marketing Joined EarthLink in May 2012 responsible for IT Servicesproduct development as well as management and marketingfor EarthLink‟s growing IT Services business.Over 20 years of progressive leadership experience in ITInfrastructure and the communications industry. He bringsexperience in successfully launching a high-growth IT Servicesproduct strategy, most recently as President of ConcentricCloud Solutions, a XO Communications Company.Previously served as XO‟s Chief Marketing Officer where hedeveloped, implemented and helped execute a growthstrategy for the Business Service division.Prior to XO, Toplisek held the positions of Senior VicePresident Global Enterprise & Collaboration and Regional VicePresident of Business Servicesfor Global Crossing. He also held sales leadership positions atFrontier Communications and MCI Telecommunications.28
EarthLink t &LogisticsOther IndustriesHealthcare29
Consumer Business Has a Long TailConsumer Churn Rate3-Month Moving AverageConsumer Revenue Loss5.5%4.5%Millions5.0%Q1 Q2 Q3 Q4 Q1 Q2 Q3 Q4 Q1 Q2 Q3 Q4 Q1 Q2 Q3 Q4 Q1 Q2 Q3 Q4 Q1'08 '08 '08 '08 '09 '09 '09 '09 '10 '10 '10 '10 '11 '11 '11 '11 '12 '12 '12 '12 '13 - (5)4.0%3.5% (10)3.0%2.5% (15)2.0% (20)1.5% (25) Consumer mix continues to migratetoward longer tenures The Consumer revenue loss trendscontinue to improve Churn has fallen as a result and weexpect further improvement Consumer revenue loss improvedto less than (3)M in Q1 „1330
Cautionary Information RegardingForward Looking StatementsThis presentation includes “forward-looking” statements (rather than historical facts) that are subject to risks and uncertainties that could cause actual results to differ materially fromthose described. Although we believe that the expectations expressed in these forward-looking statements are reasonable, we cannot promise that our expectations will turn out to becorrect. Our actual results could be materially different from and worse than our expectations. With respect to such forward-looking statements, we seek the protections afforded by thePrivate Securities Litigation Reform Act of 1995. These risks include, without limitation (1) that we may not be able to execute our strategy to be an IT services company for small andmedium-sized businesses with IT and network security needs, which could adversely affect our results of operations and cash flows; (2) that we may not be able to grow revenues fromour evolving Business Services product portfolio to offset declining revenues from our legacy Business Services products and from our Consumer Services segment, which couldadversely affect our results of operations and cash flows; (3) that we may not be able to develop the optimal sales model necessary to implement our business strategy; (4) that we maybe unsuccessful integrating acquisitions into our business, which could result in operating difficulties, losses and other adverse consequences; (5) that if we are unable to adapt tochanges in technology and customer demands, we may not remain competitive, and our revenues and operating results could suffer; (6) that our failure to achieve operating efficiencieswill adversely affect our results of operations; (7) that as a result of our cont
Windstream EarthLink Sprint Verizon AT&T 19% 19% 22% 24% 28% 29% 43% 68% . Web Hosting Secure Email Email Encryption Email Archive Secure File Sharing Managed Colocation Managed Cloud Hosting EarthLink TechCare . 11 We have a broad network footprint that provides coverage across over 90% of the country.