Transcription
http://www.autoforks.com/Autoforks Settings ExampleLast Updated: May 24, 2005May 24, 2005 Comments: When you first begin to use the Autoforks RT software program, it's easy to beoverwhelmed with the number of pitchforks the program draws automatically. Let me try to give you a briefglimpse into how I used it in a recent trade and this can be a great way for you to discover just how easy it is tostart using the software program successfully in your trading, whether you've never drawn a pitchfork before orbeen drawing them for years.Now let me see if I can show you a step by step practical example of how I used it in setting up a successfulhttp://www.autoforks.com/ (1 of 33)10/19/2005 11:38:07 AM
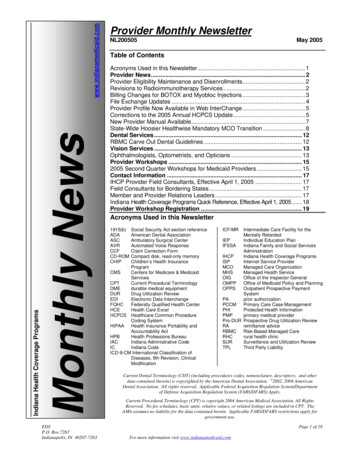
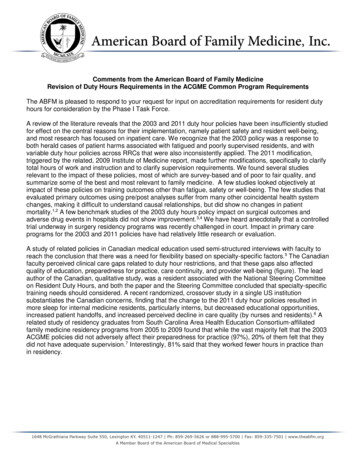
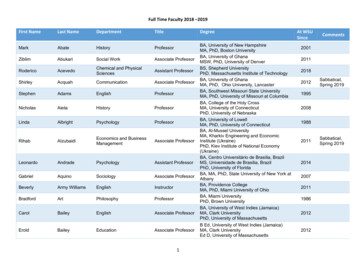
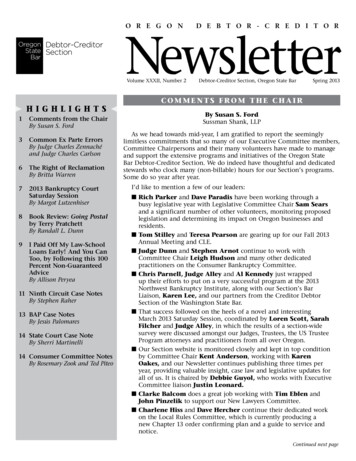
http://www.autoforks.com/trade just this past week. Let's take a look at the Ensign Toolbar that always sits on top of your charts, which iswhere the buttons that you'll use to start and configure Autoforks are found:The first button you need to be aware of is the "Run" button, which is where you'll find the Autoforks RT indicatorstart button. Click on the Run button and you will see the AutoForks button listed there. By clicking on it, youautomatically start a copy of the Autoforks indicator on the chart running in Ensign on the page you are workingon. Remember: You CAN run more than one Autoforks indicator on any given chart, and you'll see why that'simportant a bit later.Here's a fifteen minute chart of the E*Mini Russell futures [AB #F or AB M5] before I clicked on the Run buttonand the Autoforks button:http://www.autoforks.com/ (2 of 33)10/19/2005 11:38:07 AM
http://www.autoforks.com/Once I clicked on the Run button and then on the Autofork button, the chart changed to look like this:So now I have a set of pitchforks that will update with the close of each fifteen minute bar. I don't have to drawthem, they draw themselves. Is that a good thing? Yes and no. It's great that I don't have to draw them. Thatmeans I don't have to learn how to draw pitchforks or choose pivots. But if I simply leave the Autoforks RTprogram set on its default settings, sometimes I'll see pitchforks that are doing a great job showing me what Ineed to see. And sometimes, I'll see lots of pitchforks that update to new pitchforks, all day long, and seenothing that really helps me make any trading decisions.Does that mean Autoforks is a useless piece of software that just adds more noise for you to watch? If you useit incorrectly, that could be the outcome. Tools are only tools. If you try to hammer in a nail using a screw driver,you won't get very far. It's the wrong tool for the job. And even if you pick up the right tool for the job, you needto have an idea how to use it, or you'll just hit your fingers with the hammer over and over.So now let me show you how to make Autoforks a much more useful piece of software that WILL make adifference in your trading:Let's take the example from May 12, 2005 [the link to that trade description is a few paragraphs above] and seehow I chose the pitchfork, using Autoforks RT, for that trade. Before the E*Mini Russell market opened, Iopened Ensign, put up an E*Mini Russell chart and put the Autoforks RT indicator on that chart. Now rememberwhat the buttons on the top of your Ensign screen look like:http://www.autoforks.com/ (3 of 33)10/19/2005 11:38:07 AM
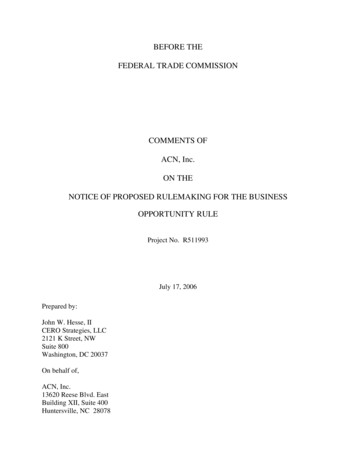
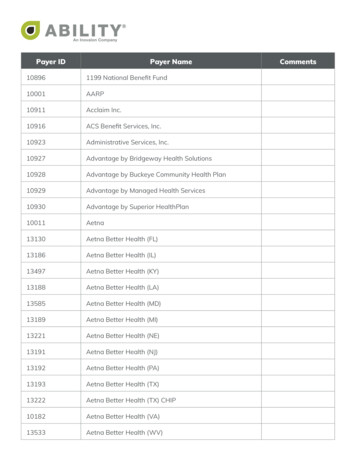
http://www.autoforks.com/Once I had Autoforks running, I clicked on the "Object" button and this screen appeared:Then click on the "Properties" button and the following page will pop up:http://www.autoforks.com/ (4 of 33)10/19/2005 11:38:07 AM
http://www.autoforks.com/This is the control panel of the Autoforks RT indicator. You can change settings for everything from the numberof pitchforks shown on your chart, the color of the pitchforks, the thickness of the lines for each of the pitchforksdrawn, how the program alerts you when price touches a Median Line or Upper or Lower Parallel, and much,much more [Read the instructions that came with the software and ask questions on the Market Maps Forum ifyou have more questions about settings!!!].Before I do another thing, I turn off the first [pink] auto pitchfork by clicking on the second box to the right of the"1st Line" that has a black solid horizontal line shown in it and has the word "Style" above the box. Once I clickon it, it brings up different line settings and if I scroll all the way to the top of this list of line types, there is a"blank" setting, which is simply all white with no line showing. When you choose this, it turns that pitchfork off.Then I go to the last line on the control panel and I change the third box, furthest to the right after the variable"Spread," by clicking on the arrow there and finding a "marker" I like. I choose a square with a small hole in thecenter. By changing this box from blank [or white] to show this square marker, Autoforks RT will place a greensquare above or below me each pivot, making it easy for me to see what pivots Autoforks is "seeing" and"using." This will be important in a moment, when I show you how I "rock" through the shift settings, looking for adominant pitchfork. The control panel now looks like this:http://www.autoforks.com/ (5 of 33)10/19/2005 11:38:07 AM
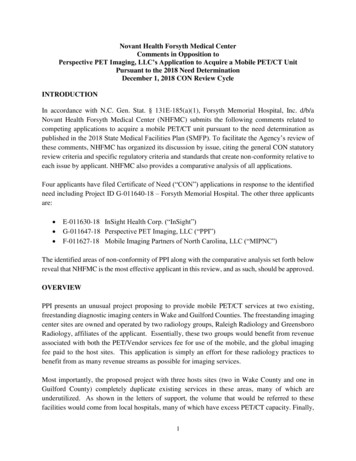
http://www.autoforks.com/Why do I only want to look at one pitchfork at a time? I don't want to be overwhelmed with TOO muchinformation. The FIRST thing I need to know, whether I am drawing the pitchforks by hand or whether I amletting the software draw them for me is this: Is there a dominant pitchfork already "in control" of this market? Iam looking for ONE pitchfork that will give me the direction of this market and the likely areas where price willrun out of energy. To do this, I don't need or want two or three pitchforks. I need ONE pitchfork that price hasbeen tested and has done a good job showing the direction of price and the areas where price will likely run outof energy. Start out by finding this before the market opens and you will simplify your trading by 1000 percent!So now I have Autoforks set up so that it will show me ONE pitchfork, not two or three. And it will also show meeach pivot it detects, by marking them with a green square. I click on the box marked "OK" and the control panelcloses. I can now double check that I am seeing just one automatically drawn pitchfork and pivots marked withgreen squares:http://www.autoforks.com/ (6 of 33)10/19/2005 11:38:07 AM
http://www.autoforks.com/Once I double check that I am only seeing green squares at each pivot and only one blue pitchfork, which is thepitchfork controlled with the "2nd Line" blue box, I am ready to begin the pitchfork selection process [You couldhave used the "1st Line" by leaving it colored pink and changing the "2nd Line" and box to "white," but I chose towork with the second pitchfork that I marked blue. Either choice would be fine.Now let's begin the selection process: Click on the "Objects" button on the Ensign toolbar and then click on the"Autofork 3/5/1/0" and then click on properties. Once again, you'll see the Autoforks Control Panel. Now click onthe dark blue band on the top of the control panel and you can "drag it down or around" on top of your chart.You want to set it up so you can see a good amount of the chart you are going to trade, but you still need to seethe settings on the far left of the Control Panel, because we're going to change them to look at differentpitchforks. If you have more than one screen attached to your computer, you can make Ensign stretch to morethan one screen and then put the entire chart on one screen and the Control Panel on another, which makes itvery easy to see, but if you have only one screen, here's what you'll be looking at:http://www.autoforks.com/ (7 of 33)10/19/2005 11:38:07 AM
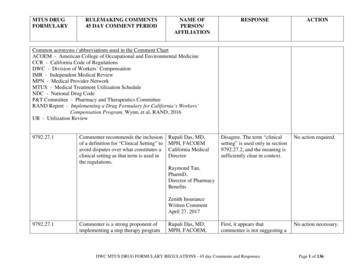
http://www.autoforks.com/Ok, you should be looking at a chart that also has a gray box near some corner that shows the "settings" boxes,just as the chart above has the settings boxes in the right bottom corner. Now I'm going to use those settings to"scroll through" potential pitchforks until I find the pitchfork that I think will show me the likely areas where pricewill run out of energy as the market unfolds today [Remember, this was on May 12th]. In Autoforks slang, whenwe scroll through the 1st or 2nd values, we call that "spinning" and when we scroll through the Shift -L/R setting, we call that "rocking." If you have a set of variables that you have used with some success, it's ofteneasier to begin by using those settings and "rocking" through the possible shift variables, because it's very easyto "rock" through the shift variables. In the E*Mini Russells, I have had some recent success using "3" as the 1stvariable and "5" as the second variable, so I am going to use those two settings and try "rocking" through theshift variable to see if I can identify a pitchfork I feel has the potential to be dominant after the open.Now let's look at the actual charts that were made before the session opening on May 12, 2005 as I "rock"through the settings [note I have moved the control panel in the left hand corner and it now reflects the currentsettings]. Again, we're going to look at each chart as I change the shift settings and try to be aware if it has beenuseful in showing us where price is going [up trend, down trend, or trading range] and if it has been helpfulshowing areas where price was likely to run out of energy. So we're looking for Median Lines and Upper/LowerMedian Lines that have been tested by price and have proved useful, as well as keeping an eye out forsomething that *might* look promising after the market opens. Here we go with shift setting "0":http://www.autoforks.com/ (8 of 33)10/19/2005 11:38:07 AM
http://www.autoforks.com/Ok, this chart isn't bad. I don't know that it has been tested enough for me to feel comfortable trading off it, butdepending on where price opens, we might want to keep this one in the back of our mind. If you had just let theautoforks program churn out pitchforks, one after the other, you would have seen this pitchfork pop up in thepast few sessions yesterday [May 11, 2005]. Let's look at shift setting "-1":http://www.autoforks.com/ (9 of 33)10/19/2005 11:38:07 AM
http://www.autoforks.com/This pitchfork looks exactly like the prior pitchfork, and that's because it IS the same pitchfork. By setting theshift setting to "-1," you "freeze" the pitchfork, so that it will not change on the screen and the program will notchange it until you go back into the control panel and change the shift value. So remember: IF you are watchingthe AutoForks RT program and letting it automatically generate pitchforks for you, if you suddenly see apitchfork you like, simply click through to the control panel and change the shift value [which will be at "0" ifAutoforks is automatically updating the pitchforks for you] and change it to "-1." Now let's look at shift setting "2":http://www.autoforks.com/ (10 of 33)10/19/2005 11:38:07 AM
http://www.autoforks.com/This pitchfork clearly will not help us today, because it had such a negative slope that price has "drifted" throughit to the right and it is very unlikely price would trade low enough, fast enough, for this pitchfork to come intoplay.Let me pause here for one moment and explain now exactly what the "shift" setting is doing: If you look carefullyat each of these charts as I "rock" through them, you'll see that as I change the shift variable, Autoforks "shifts"the pivots being used either backward or forward in time. This means that if you change the shift value from "0"to "-2," instead of using the three current alternating pivots, Autoforks will use a set of alternating pivots oneback from the current set. Why only one set, if we chose a "-2" shift value? Remember we use the "-1" shiftvalue to freeze the current set of alternating pivots so they will no longer change, so a shift value of "-2" shiftsthe alternating pivots back one from the current set. Let's look at setting "-3":http://www.autoforks.com/ (11 of 33)10/19/2005 11:38:07 AM
http://www.autoforks.com/It seems like we're getting closer. This pitchfork's Median Line was tested once and price sold off hard after thattest, zooming well through the Lower Median Line Parallel. Price did eventually climb back late in the dayyesterday to re-test the up sloping blue Lower Median Line Parallel and then price consolidated below theLower Median Line Parallel. Again, this is a pitchfork we may want to keep our eyes on, depending on whereprice opens. Selling a re-test of the up sloping blue Median Line Parallel that was zoomed might be an enticingtrade set up. Let's look at setting "-4":http://www.autoforks.com/ (12 of 33)10/19/2005 11:38:07 AM
http://www.autoforks.com/Not much promise here. The pitchfork was too steep and price drifted to the right of this pitchfork as the daywent on yesterday, especially once price turned higher. It's highly unlikely this pitchfork will come into playtomorrow. Let's look at setting "-5":http://www.autoforks.com/ (13 of 33)10/19/2005 11:38:07 AM
http://www.autoforks.com/This pitchfork hasn't been tested by price and we've already seen a similar pitchfork that *has* been tested andwill give us similar measurements if price trades to the upside, so I'm not going to pay much attention to thispitchfork. Let's take a look at setting "-6":http://www.autoforks.com/ (14 of 33)10/19/2005 11:38:07 AM
http://www.autoforks.com/This pitchfork did a GREAT job describing most of the sell off yesterday and the Median Line and Upper/LowerParallels were each tested several times. Price DID zoom above the Upper Median Line Parallel early yesterdayafternoon, so if price opens quite a bit lower, we might keep this pitchfork in the back of our minds. That mightset up an interesting area to try a long position IF the risk reward ratio is acceptable. Let's take a look at setting"-7":http://www.autoforks.com/ (15 of 33)10/19/2005 11:38:07 AM
http://www.autoforks.com/Nothing here. Two days ago, this pitchfork briefly caught part of the late day up move. But the slope of thispitchfork is too steep and price has moved too far to the right of this pitchfork for it to come into play. Let's take alook at setting "-8":http://www.autoforks.com/ (16 of 33)10/19/2005 11:38:07 AM
http://www.autoforks.com/This pitchfork looks quite promising. The Upper Median Line Parallel, the Median Line and the Lower MedianLine Parallel have all been tested. And while price briefly broke above and below this pitchfork, price really hasbeen "kept in check" by this pitchfork. Of all the pitchforks I have seen in this series so far, this one looks themost interesting. I can envision a re-test of the down sloping Median Line as a potential area to get long or atest of the down sloping Upper Median Line Parallel as a potential area to try to get short, if the risk reward ratiolooks good on the trade set up. I'll definitely keep my eye on this pitchfork. Let's take a look at setting "-9":http://www.autoforks.com/ (17 of 33)10/19/2005 11:38:07 AM
http://www.autoforks.com/It's highly unlikely price will trade high enough, fast enough, to test this pitchfork. It's not worth looking at. Let'stake a look at setting "-10":http://www.autoforks.com/ (18 of 33)10/19/2005 11:38:07 AM
http://www.autoforks.com/Price has clearly moved too far to the right for this pitchfork to have much chance of intersecting with price.There's nothing here. We may have shifted so far back in the prior pivot sets that we're not going to see anymore useful pitchforks. Let's look at one more to see if it, too, is shifted too far away from current price to beuseful. Let's take a look at setting "-11":http://www.autoforks.com/ (19 of 33)10/19/2005 11:38:07 AM
http://www.autoforks.com/Again, this is not a pitchfork that will come into play in today's trading. We have shifted back so far in thealternating pivots that the pitchforks are no longer interacting with price. There's no point "rocking" back anyfurther. For us to do further investigations into potential dominant pitchforks before the session opens, we'dneed to look at the 1st and 2nd variables, one at a time, which we call "spinning." And by the way, when YOUare doing this with the software, you can simply hold down the arrow on the variable you are changing [1st or2nd value if you are "spinning" or shift -L/R value if you are "rocking"] and it becomes a very quick exercise tolook through 10,20,30 or even 40 possibilities. Simply keep track of the ones that look promising as you "spin"or "rock" through the variables.The best setting I've seen, looking at this chart before the opening [of May 12, 2005] for a single pitchfork, isusing the 1st variable set to "3" and the 2nd variable set to "5" with the shift value set to "-8," which also meansthe pitchfork will not change as price moves forward.By the way, you don't have to turn off both pitchforks. I often use two pitchforks and then "spin" or "rock" throughthe settings to see what variables are working. But you can certainly focus on finding one pitchfork that isdominant before the opening and then use that one pitchfork throughout the trading day.Another important thing to remember: If you want to see Autoforks draw additional pitchforks and still keep this"dominant" pitchfork locked onto your screen, you simply click on the Run button, click on the AutoforksIndicator button and a new indicator will be inserted, giving you up to three new pitchforks that are automaticallydrawn by the software, right on the same chart with the dominant pitchfork I just identified.http://www.autoforks.com/ (20 of 33)10/19/2005 11:38:07 AM
http://www.autoforks.com/Now here's one last trick: After reviewing the variables I "rocked," there were two I thought that looked mostpromising: The best had a shift value of "-8" and the second best had a shift value of "-3." Both had 1st andsecond values of "3" and 5." Rather than choose which to look at before the open of the morning session, Isimply put one on the chart with the settings of "3,5,-8 and then once the first pitchfork is on, I click back on the"run" button and add another Autoforks indicator and set it to the settings of "3,5,-3," which give me my twochoices on the same chart, so I can see how they line up alongside each other. Once again, I am looking for enedge--confluence or a grouping of resistance or support that I can trade against. Here's the chart containingboth of these choices on one chart, before the opening of the trading session on May 12:You can see that there is some interesting confluence coming in above the market at the 598 1/2 area, wherethe pink up sloping Lower Median Line of my second choice intersects with the blue down sloping Upper MedianLine of my first choice. Remember, because I have these set to "negative" shift values, these pitchforks will staydrawn unchanged UNTIL I change them. If I want Autoforks RT to draw new pitchforks that automaticallyupdate, I can add them as well by simply clicking on the run button and adding another Autoforks indictor andthis time, leaving the shift setting set at zero. Now let's see how these two pitchforks, that I chose using the"rocking" technique, performed as the day session unfolded:http://www.autoforks.com/ (21 of 33)10/19/2005 11:38:07 AM
http://www.autoforks.com/Before the opening, I was looking at the E*Mini Russell 15 minute chart, above, carefully. There is a *ton* ofconfluence forming overhead resistance between 598-600. The rally out of the hole yesterday may have putprice in position to test the intersection of the blue down sloping Upper Median Line Parallel and the pink upsloping Lower Median Line Parallel. There are double tops at 599.80--Those are easy to identify. And then, ifyou measure the Directional Energy price spent in the last two up swings--that is, how far did price move in onedirection, bottom to top, in the prio
difference in your trading: Let's take the example from May 12, 2005 [the link to that trade description is a few paragraphs above] and see how I chose the pitchfork, using Autoforks RT, for that trade. Before the E*Mini Russell market opened, I opened Ensign, put up an E*Mini Russel