Transcription
A Framework for Performance Comparison among Major Electronic Health Record Systems1A Framework for Performance Comparisonamong Major Electronic Health RecordSystemsBy Tiankai Wang, PhD, and David Gibbs, PhD, CPHI, CHPS, CPHIMS, CISSPAbstractWhile nearly all hospitals have adopted electronic health record (EHR) systems, some aredissatisfied and considering replacement systems to better address unique organizational needs andpriorities. With more than 4,000 certified health information technology products available, comparingthe vast number of EHR options is complex. This study tested the hypothesis that various EHR systemsdemonstrate different financial and quality performance and presented a framework for comparison.Using a subscribed database containing US hospitals’ observations from 2011 to 2016, we estimated anordinary least squares regression model with robust standard errors and clustered by year. We regressedthe selected finance and quality measures as dependent variables with the vendors’ indicators asindependent variables, with control variables. This study demonstrated an approach for analyzingperformance data to help hospitals distinguish EHR systems on the basis of several organizationaloutcomes: return on assets, bed utilization rate, Hospital Consumer Assessment of Healthcare Providersand Systems (HCAHPS) summary star rating, and value-based purchasing Total Performance Score. Thisframework will help EHR acquisition teams make informed decisions.Keywords: electronic health records; health information technology; financial and qualityperformance; comparisonIntroductionAccording to the Office of the National Coordinator for Health Information Technology (ONC)Certified Health IT Product List, there were 4,279 certified health information technology (IT)products in April 2018.1 Many healthcare organizations face the challenge of selecting a new orreplacement electronic health record (EHR) system from the variety of choices available. Whilenearly all hospitals have adopted EHR systems, some are dissatisfied and considering replacingtheir systems with other products to better address unique organizational needs and priorities.2Comparing the vast number of EHR options is complex, with numerous features and benefits tobe considered. To help address the complexity, tools have been developed to identify objectivecriteria for comparison among EHR systems.3 In this paper we introduce an approach, based onour study, which may be of interest to those involved in comparing EHR systems from differentvendors.
2Perspectives in Health Information Management, Fall 2019BackgroundOne of the most important motivations for implementing EHR systems is to improve patient outcomes.The US federal government deemed the positive impact on patient outcomes to be worthy of financialincentives to hospitals adopting any of the available certified EHRs. While patient outcomes areimportant, other outcomes that must be considered include the long-term impact on financial performanceand standardized quality scores to ensure sustainability and competitiveness of the healthcare deliveryorganization.Other researchers have related a hospital’s investment in an EHR to positive financial outcomes, withoutdistinguishing between competing EHR vendors.4 In prior research, theoretical analyses suggested thatEHR systems can increase hospital financial performance, with the assumption that EHR systems wouldbe interconnected, interoperable, adopted widely, and used effectively.5, 6 However, the empirical researchhad mixed results. Menachemi et al. looked at 82 Florida hospitals’ financial statements and an IT survey,with results showing a positive association between case mix and clinical IT use.7 A research team inIsrael studied the use of customized EHRs to achieve cost savings by classifying specialty clinics forreferrals into four classes based on average cost per visit. Clinics in class 1 had the lowest cost, whileclass 4 clinics were most expensive. Classes 1, 2, and 3 were represented in the EHR systems of 243primary care facilities and available for referral; class 4 clinics required additional preauthorization.Primary care physicians initiating referrals to specialty clinics were presented with the classified optionsand tended to refer to those providers with lower cost. Having relative cost information available in theEHR at the time of the referral order resulted in lower overall costs during the four-year study. To becomemore competitive, the class 4 clinics eventually reduced their costs. The researchers concluded that EHRsystems have a positive impact on finances.8 Subsequently, Collum et al. examined the levels of adoptionof 32 specific clinical functions and found no long-term financial benefits of adoption or expanded use ofEHR functions, based on their criteria.9 They highlighted that their findings were inconsistent with earlierstudies that did show reduced operating costs associated with EHR adoption. These studies consideredEHR systems in general without distinguishing between EHR vendors.In addition to financial performance, quality performance is also an important consideration, especiallyfor not-for-profit hospitals. Each healthcare organization must identify the appropriate balance offinancial and quality performance representing its mission, vision, and value proposition. One crosssectional study of 41 urban Texas hospitals across 10 metropolitan statistical areas examined dischargedata covering more than 167,000 patients and concluded that hospitals with electronic records, orderentry, and clinical decision support had lower mortality rates and fewer complications; these findings areindicators of quality care. The study used the Clinical Information Technology Assessment Tool(CITAT), which provides a numerical score indicating the level of automation used by a hospital. Fourdomains of automation are considered: test results, notes and records, order entry, and decision support.Indicators of quality for the study included complications, mortality, and length of stay (LOS). Higherlevels of automation were associated with lower mortality rates and complications, in most instances.There was no clear relationship between the automation scores and LOS.10 Adler-Milstein et al. studiedhow hospital outcomes of process adherence, patient satisfaction, and efficiency were related to EHRadoption. Their results showed that increased EHR adoption was associated with improved processadherence and patient satisfaction, but not efficiency. The relationships were stronger in more recentyears.11Since the Hospital Value-Based Purchasing program was enacted as part of the Patient Protection andAffordable Care Act in 2010, hospitals have been incentivized to achieve high scores on qualitymeasurements such as the Hospital Consumer Assessment of Healthcare Providers and Systems
A Framework for Performance Comparison among Major Electronic Health Record Systems3(HCAHPS). The HCAHPS score is an important measure of hospital quality because it represents datacollected from patients regarding their hospital experiences and how well their expectations were met.The HCAHPS scores, along with other factors, are used by the Centers for Medicare and MedicaidServices (CMS) to calculate individual and overall five-star quality ratings and the Total PerformanceScore (TPS). These quality scores are reported to the public on the Hospital Compare website to enableconsumer comparison and research. Carter and Silverman provide an effective summary of the complexformula used by CMS to determine HCAHPS scores.12 Herrin et al. analyzed how HCAHPS scores wereaffected by sociodemographic factors, cultural factors, and level of access to care. They concluded that anumber of community factors other than direct hospital experience affect HCAHPS scores.13 Todetermine the overall rating score, CMS combines the HCAHPS scores from patients with objective datacollected from hospitals. Quality measures collected include complication, mortality, and readmissionrates and specific patient safety indicators.14 The TPS is based on the same HCAHPS scores with differentquality measures. The TPS formula has been refined over time. In 2014, TPS was based on clinical careprocesses, patient experience, and outcomes.15 The broad use and acceptance of HCAHPS scores asquality indicators influenced their inclusion in this research study.Researchers have previously examined the concept of EHR systems and sought evidence that EHRs, ingeneral, could meet expectations to improve efficiency and productivity in hospitals,16 but they did notattempt to distinguish among the various certified EHR vendors. Some of these studies focused on patientoutcomes, while others analyzed EHR usability or financial outcomes.17–20 Ratwani et al. explored thebarriers associated with comparing usability of EHRs, highlighting the need for robust comparison tools.They pointed out that although user-centered design was required by the ONC for products to be includedon the public certified health IT products list, there was a lack of consistency among vendors.21 Thesestudies confirmed the need for standardized comparison tools to enable purchasers of EHR systems to bemore fully informed.22 They also highlighted the shortage of objective assessments for EHR systems thathave already been implemented. The ONC proposed ways to improve comparison among vendors byvalidating certified and ancillary uncertified features of health IT.23In 2016, the ONC published a report to Congress, Report on the Feasibility of Mechanisms to AssistProviders in Comparing and Selecting Certified EHR Technology Products.24 The report outlines fourmechanisms to help health IT decision makers compare options and describes how the mechanisms areapplicable to all providers and especially organizations lacking resources to independently complete athorough scan of available technology options. The ONC cited a previous nationwide study, whichconcluded that EHR adoption challenges vary by organization and were affected by factors such aspractice setting.25 The study found that selecting vendors for health IT was the second most frequentlyreported challenge to technology adoption, underscoring the complexity of comparing options. Neitherthe ONC report nor the national study included an analysis of how vendor selection affected finance andquality outcomes.This study analyzed a collection of available data to identify objective measurements related to thefinancial and quality score impacts of specific EHR implementations. The result was a model that may beuseful to organizations desiring to compare EHR solutions on the basis of the organization’s uniquemission, values, and priorities.ObjectiveCurrently, thousands of EHR products are available in the market. Naturally, practitioners question howwell individual EHR systems perform. While many have studied EHRs in general, to our knowledge, noone has studied the differences among the various EHR system vendors regarding the impact of their
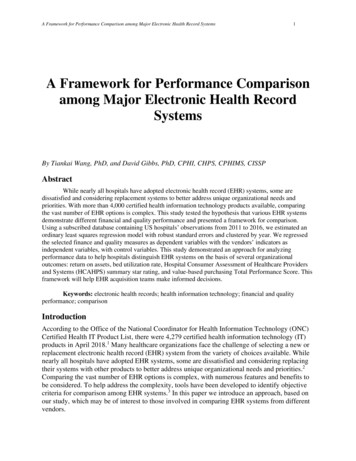
4Perspectives in Health Information Management, Fall 2019individual products on finance and quality performance indicators. This leads to our hypothesis thatvarious EHR systems demonstrate different finance and quality performance.MethodsSample SelectionIn our study, we chose to use a subscription-based health data provider, Definitive Healthcare, becausethe dataset covered more than 8,000 hospitals in the United States, and these hospitals provided a broadrange of healthcare services. Because Definitive Healthcare frequently updates its dataset, the data weretimely and current.The original dataset contained 8,825 unique hospital observations from 2011 to 2016. The datasetcontained historical financial data and quality measures back to 2009. The sample data used in this paperwere downloaded on October 21, 2016. We dropped observations with unreasonable values, including 64observations with total assets less than or equal to zero and 513 observations with total uncompensatedcare (unreimbursed cost) less than zero. We further dropped observations lacking the information requiredto calculate dependent, independent, and control variables. After data cleaning, our final sample contained2,463 observations. This sample allowed us to examine hospital financial and quality performancemeasures over multiple years.Empirical ModelTo test our hypothesis, we estimated the following ordinary least squares (OLS) regression model withrobust standard errors and clustered by year.Performance β0 EHR vendor indicators Controls Year fixed effects εWe selected several hospital performance measures as the dependent variables, including financialperformance and quality performance. Consistent with prior literature,28, 29 in this paper we used return onassets (ROA) as the dependent variable measuring hospital financial performance. The quality measuresselected were found in relevant literature and consisted of the bed utilization rate (BUR),30 HCAHPSsummary star rating,31 Hospital Compare Overall Rating,32 and value-based purchasing TPS.33 Thesequality measures were available in the Definitive Healthcare dataset.We created EHR vendor indicator variables as the independent variables. We identified the five top EHRproducts listed in the Definitive Healthcare database. Figure 1 represents the relative market share of eachincluded vendor. To avoid having this study be misunderstood as EHR vendor promotion, we assignedthe letters A to E, respectively, to the five top EHR vendors, rather than disclose their true names. Next,we created an indicator variable for each of the vendors. For example, the variable for vendor A is setequal to 1 if the hospital’s EHR system is vendor A’s product. Thus, the baseline was the use of an EHRsystem not manufactured by one of the top five vendors. By examining the coefficient estimates of theindependent variables, we could investigate whether the top EHR system’s performance was better orworse than not using an EHR system from one of the top five vendors.
A Framework for Performance Comparison among Major Electronic Health Record Systems5Following Wang et al., we used the following control variables in our model: hospital size, marketconcentration index (MCI), payer mix (Medicare and Medicaid; i.e., the percentage of revenue comingfrom each of those programs), and uncompensated care cost, ownership (governmental, proprietary andnonprofit, which was used as the reference group), teaching status, geographic classification, and yearfixed effects.34 The definitions of variables are specified in Table 1.Table 2 displays descriptive statistics for the full sample (2,463 observations). In sample data, the hospitalmean ROA was 0.069, consistent with the findings of Collum et al.35 The hospital mean bed utilizationrate was 0.53, mean HCAHPS score was 3.04, mean overall rating was 2.99, and mean TPS was 38.32.The remainder of Table 2 presents descriptive statistics for the control variables used throughout thestudy. The hospital mean size was 177.68 million of total assets. The average market concentrationindex was 0.34, and the mean payer mix for Medicare, payer mix for Medicaid, and uncompensated costwere 0.37, 0.11, and 19.67, respectively, which were comparable to those found in prior studies.ResultsTable 3 reports correlation coefficients for the full sample. We found that vendors C and E were notsignificantly correlated with the financial measure (ROA), while the other three vendors were sufficientlycorrelated with ROA. Regarding quality measures, vendors A and C were significantly correlated with allquality measures, while the other three vendors were significantly correlated with some quality measures.To test our hypothesis, we regressed the selected finance and quality measures as dependent variableswith the vendors’ indicators as independent variables, including control variables. Table 4 presents themultiple regression results of our model.The explanatory power of our models, as evidenced by the adjusted R2, varied from 8.5 percent in theROA model to 38.2 percent in the BUR model, suggesting that 8.5 to 38.2 percent of variation wasexplained by the independent variables in different models. The magnitude of the adjusted R2 in ourresults was consistent with prior study.36DiscussionTable 4 shows that various EHR systems performed differently. In the ROA model, vendors B and Cshowed positive associations with ROA, but only the coefficient of vendor C was significant, suggestingthat using vendor C would significantly raise hospitals’ return on assets; that is, hospitals using vendor Chad a higher ROA at 0.0226 than those hospitals not using one of the top five vendors’ EHR systems (p 0.044). On average, hospitals’ total assets were 177.68 million dollars. These results suggested that, onaverage, if a hospital used vendor C’s EHR system, this choice could result in a 7.82 million increase innet income, compared with hospitals not using an EHR system from one of the top five vendors. With thesample data having an average net income of 22.1 million, this reflects a 35.38 percent increase inhospital net income due to the adoption and utilization of vendor C’s EHR system. However, using anEHR did not guarantee an increase in ROA. Table 4 shows that using vendor A’s EHR system resulted ina statistically significant ROA decrease, at 0.0111 (p 0.014).
6Perspectives in Health Information Management, Fall 2019The BUR model showed mixed results across the vendors. Vendors A, C, and E showed positive andsignificant associations with the BUR, indicating that the use of their EHRs would significantly increasethe hospital’s bed utilization rate. Among these three products, vendor E had the largest coefficient at0.0321 (p 0.008), suggesting a 0.0321 increase in the bed utilization rate with adoption of vendor E’ssystem. With an average BUR of 0.53 in the sample data, vendor E’s increase represented a 6.06 percentrise in the bed utilization rate. Vendor B also had a positive coefficient, but the finding was not significant(p 0.310). Vendor D showed the only negative association with BUR at 0.0361, which was statisticallysignificant (p 0.002), indicating that the use of vendor D’s system would reduce the average bedutilization rate by 0.0361 or 6.81 percent, compared with not using an EHR system from the top fivevendors.The HCAHPS model showed statistically significant results for four of the five vendors. Vendors A, B, C,and D all showed statistically significant and positive associations with HCAHPS scores. Vendor C’scoefficient was the highest at 0.2779 (p 0.001), suggesting an HCAHPS score increase of 0.2779 or9.14 percent based on the average HCAHPS score of 3.04 in the sample data. Vendor E had a positive butnot significant association with HCAHPS at 0.0141 (p 0.769).The model for overall rating showed significant positive associations for all five vendors. The highestcoefficient was 0.2966 (p 0.001) for vendor C, with an average overall rating score for the sample dataof 2.99. This suggested that hospitals that adopt an EHR system from vendor C would have an overallscore 9.92 percent higher than those without an EHR system from one of the top five vendors.The TPS model had mixed results. Vendors A, B, and C showed positive and significant associations withthe TPS, indicating that hospitals using one of these EHR systems would have higher TPSs than those notusing any of these EHR systems. Among these three vendors, vendor C had the highest coefficient at2.6266, and this finding was statistically significant (p 0.001). With the average TPS in the sample databeing 38.32, this suggests that hospitals with an EHR system from vendor C would have a TPS 6.85percent higher than hospitals not using an EHR from one of these vendors. Vendor A’s coefficient of0.2451 and vendor B’s coefficient of 0.7800 were much lower than the coefficient for
A Framework for Performance Comparison among Major Electronic Health Record Systems 3 (HCAHPS). The HCAHPS score is an important measure of hospital quality because it represents data collected from patients regarding their hospi