Transcription
How to Measure theMetrics that Matterwith PerformanceManagementCopyright Voice Print International, Inc. 2014
Today’s AgendaWhat is Performance Management?Performance Management Best PracticesTop 10 Contact Center Metrics that Really MatterVPI/NACC Benchmark Research ResultsWhat Metrics to Measure in Real-time1
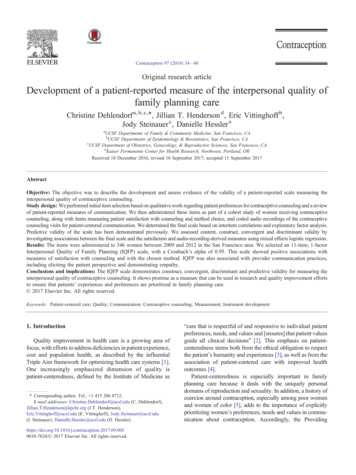
VPI @ a GlanceFounded: 1994 by current CEO, reputation for innovationHeadquarters: Camarillo, California, US-based R&DCustomers: More than 1,000 customers globallySolutions: Contact Center Analytics and Workforce OptimizationVirtual Call AgentsCall & ScreenRecordingE-learningPerformance Management2Speech & Data AnalyticsQuality AssuranceWorkforce Management
Current Business Economic EnvironmentMore DemandingCustomersLower MarginsMergers andAcquisitionsMore Choices andSubstitutesDeclining SalesRevenuesRecoveringEconomySiloed Systems and DataHandling Inbound& OutboundMulti-channelenvironmentInconsistent ServiceAcross ChannelsManual Reportingusing Inaccurate SpreadsheetsMore Metricsand DataInconsistentProcesses
Gartner CIO StudyWhat contact centers today want:real-time and predictive data rather than justhistorical data.a unified view instead of fragmented views fromsiloed systems.(in addition to reporting) business, operational andcustomer insights that are actionable and helpdrive decision making and process optimizationSource: Gartner CIO Study
The Challenge: A Visibility GapWorkforce OptimizationCommunications@ACD / DialerEmailIVRRecording& AnalyticsChatQAWFMServicing AppsHRCRM / ERPHelpdeskHome Grown
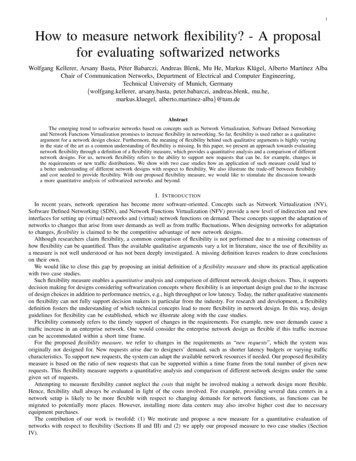
What we see today 92% of contact centers stillregularly generate reportsusing spreadsheets.Ventana ResearchContact Center Analytics Benchmark ResearchSpreadsheets run amuck in most organizations.They proliferate like poisonous vines, slowlystrangling organizations by depriving them of asingle consistent set of metrics to evaluateperformance.”- Eckerson, TDWI
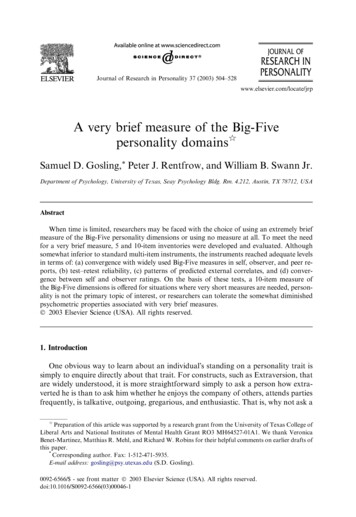
The Solution: Performance ManagementE-learningACD / DialerCoaching4Calls/Hr.AgentGroupAvg. Talk123:04153:38Stacy AdamsHome GrownTransfers Conversions1383%70%Sales ( )CreditsAdherenceAvg. QA 5,354 3,000 562 20072%80%91%85%In QueueGroupExpect Higher Call Volumes at 2:30pm Today Due to TV PromotionOther DataSourcesCRM / CollectionsWFMQA123:49Abandons5
Performance Mgmt. Implementation Best PracticesDEFINEDetermine Goals andKPIs by Line of BusinessCONTROLStandardize Processesand Monitor ResultsIMPROVEDevelop Action Plan forEach KPI if PerformanceFalls Outside of Targets8MEASUREImplement Process andTechnology to Collect andPresent KPI informationANALYZEIdentify and ConfirmRoot Causes
DEFINEDetermine Goals by Line of BusinessWhat are your top challenges and goals?Example issues (i.e. “Defects”)Improve Customer Satisfaction and RetentionDecrease Cost Per TransactionIncrease First Contact ResolutionReduce RiskIncrease Revenues
Most Commonly Used MetricsProcess/ Efficiency MetricsOutcome/ Effectiveness MetricsAvg. Talk TimeFirst Contact ResolutionQuality Assurance ScoresAvg. After Call Work TimeCustomer Satisfaction Level# of Customer Saves% of Calls Transferred% of Calls Put on Hold# of Calls Handled# of Other Interaction Types # of Incomplete Sales AttemptsValue of Sales Made# of Evaluations# of New Sales MadeCustomer Net Promoter Score# of New Accounts GeneratedSource: Ventana Research Agent Performance Mgmt. Benchmarking 53%52%
Top 10 Contact CenterMetrics that Matter& Measurement Best Practices
1Customer EngagementAttitudinal and Emotional Relationship Strength MeasuresNPSCSATOverall, how satisfiedare you with ourcompany?This company alwaysdelivers on what theypromiseHow likely are you tocontinue to choose,repurchase or repeatyour business with ourcompany?How likely are you torecommend ourcompany to a friend orassociate?This company is aname I can alwaystrustThis company alwaystreats me with respectIf a problem arises, Ican always count onthis company to reacha fair and satisfactoryresolutionI feel proud to be acustomer of thiscompanyThis company alwaystreats me fairlySource: Human SigmaThis company is theperfect company forpeople like meI can't imagine theworld without thiscompany
1 Customer EngagementConfidenceIntegrityPridePassionFeelings are facts, Perception is realityGreater predictor of revenue and loyalty than CSAT23% lift in revenue per customer when ‘irreplaceable’Source: Human Sigma
2Hot Metric: Customer Effort / Net Easy Score1. Overall, how easy was it to get the help you wanted today?ExtremelyEasyHow wecalculate‘Net Easy'1% EasyVeryEasyFairlyEasy32–Neither4% Difficult2. Why?Sources: Dr. Nicola Millard at BT, The Magazine of Customer Service Institute of icult567 Net Easy Score
2Customer Effort Score96% ‘high effort’ are more disloyalPredictive Power forHigh Purchasing9% ‘low effort ‘are more disloyal.CESNPSCSATLowPredictive Power forIncreased Spending“The Customer EffortScore outperforms theNet Promoter Score andcustomer satisfactionmeasures in predictingbehavior.” – Harvard Business ReviewHigh
Low Effort Organizations 1. Don’t just resolve the current issue –head off the next one2. Prepare employees to address the emotional side ofcustomer interactions3. Minimize channel switching by increasing self-service‘stickiness’4. Use feedback to reduce customer effort5. Empower employees to deliver low-effort experienceSource: CEB / CCC
3 First Contact ResolutionHighest correlated measure to CSAT of all metrics1Every 1% gain in FCR translates into a 1% gain in CSATCSAT is 35% lower when a 2nd call is made.266% of contact center costs today are due to callbacks.3Sources: 1. SQM Group (Service Quality Management Group). 2. Customer Relationship Metrics 3. Yankee Group,
Methods of Measuring FCRSource: Ascent Group
How to Accurately Measure FCRCalculation: % of calls that do not result in a repeat contact by acustomer within a specific period of time in regards to the same issue.Who is thecustomer?Why are theycontactingyou?When didthey lastcontact youfor the samereason? Captured from IVR or ACD Entered by agent Captured from CRM system Captured from IVR (press 1 for , 2 for )Incoming Phone Number (DNIS)Case ID or Service Ticket IDReason codes entered by agent into CRM systemIdentify application screens entered by agentduring call What is a reasonable time period?
4Contact Quality“Quality is not the absence of defects asdefined by management, but the presenceof value as defined by the customer.”I followed the process exactly.- Miliken & CompanyThat didn’t go the way I wanted!
The Quality-Customer Satisfaction Gap30 point difference between reportedsatisfaction (Quality) and ACSI scores100%90%Reported Satisfaction(Quality) Scores60%American CustomerSatisfaction Index(ACSI) Scores0%DecJanFebSource: COPC Quality Process Optimization Inc.MarAprMayJunJul
QA Form Design Best PracticesDetermine what knowledge, skills and abilities you want toevaluateOrganize questions in the flow of a callIdeally, questions should be linear Yes, No or N/AIf using variable rating scales, define each grade in writingTrain all on pre-defined scoring benchmarksWeight more critical questions heavierKeep forms short and targeted
5Employee EngagementGetGiveBelongGrow18% higher productivity27% less absenteeism260% more revenue growth when high Employee EngagementOnly 43% can relay ‘why do business with us’High marks on both Employee Engagement andCustomer EngagementHigh marks on both Employee Engagement andCustomer Engagement3.4x growth rateSource: Human Sigma
5 Employee EngagementHow to Measure and Monitor Agent EngagementGet to do whatI do bestevery dayRecognized inthe last 7 daysSomeone hereencourages mydevelopmentMy opinionsseem to countMy job mattersOur purposemattersI have a bestfriend hereProgressdiscussed every6 monthsLearned andgrew this yearKnow what’sexpected of meHave the toolsto do it rightSomeone hereactually caresabout meWe’re allcommitted todoing qualityworkSource: Human Sigma
6Customer Complaints“You COMPLAINTS“Misleading”When the word ‘Ridiculous’ is used in a service interaction, byeither the agent or customer, the customer is 80% more likelyto change their insurer within 3 months.”- KPMG Insurance Study
7 Service Level% of net offered calls were answered in X seconds or less.How few people do I need to staff?What’s it going to cost me?Source: The Call Center School
Measure KPIs on an Interval BasisService Level – % of net offered calls were answered in X secs. or less.Service Level by Interval (Goal 80%)Time of DayCall VolumeDaily %Service Level6:00 – 7:00854.5%100%7:00 – 8:00905.0%95%8:00 – 9:00955.5%95%9:00 – 10:001458.0%90%10:00 – 11:0018510.0%75%11:00 – 12:0019510.5%70%12:00 – 1:001659.0%80%1:00 – 2:0018510.0%80%2:00 – 3:0022012.0%65%3:00 – 4:0021011.0%70%4:00 – 5:001458.0%80%5:00 – 6:001256.5%85%Daily AverageSource: The Call Center School82%
Measure KPIs on an Interval BasisOnly 5 intervals within 75% to 85% range goalTime of DayCall VolumeDaily %Service Level6:00 – 7:00854.5%100%7:00 – 8:00905.0%95%8:00 – 9:00955.5%95%9:00 – 10:001458.0%90%10:00 – 11:0018510.0%75%11:00 – 12:0019510.5%70%12:00 – 1:001659.0%80%1:00 – 2:0018510.0%80%2:00 – 3:0022012.0%65%3:00 – 4:0021011.0%70%4:00 – 5:001458.0%80%5:00 – 10:0011:0012:001:002:003:004:005:006:00
What about Average Speed of Answer (ASA)?ASA does not correlate highly with Customer SatisfactionSource: MetricNet
8 Forecast Accuracy ‘by Interval’Forecasted call volume compared to actual call volumeMost consider 5% racyIs Goal in Range?8:00 – 9:00125128-2.3%Yes9:00 – 10:00132162-18.5%No10:00 – 11:00126157-19.7%No11:00 – 12:001671539.2%No12:00 – 1:001821744.2%Yes1:00 – 2:00179198-9.6%No2:00 – 3:0020718114.4%No3:00 – 4:002072003.5%Yes4:00 – 5:00179196-8.7%NoTotal1,5041,549-2.9%33%
9Transfers“A call transfer is an 8% CSAT detractor. – JD Power & AssociatesTransfer Rate – % of calls transferred by agent and groupwithin a defined period of time.Total # of Transfers – The number of calls transferred by agentand group within a defined period of time.10 After-Call Wrap TimeGoal: Reduce Handle Time withoutAdversely Affecting CSAT
Other Valuable Outcomes-based MetricsCost per contact (CpC)Calculation: ACD Calls perhour / Agents hourly rateCost per Cost Per ChannelCost per agentMean time to ticket closureSales conversion rateRevenue per callRight Party Connects (RPC)# of leads generatedIVR completion ratesError and rework rateCost per channelCost per agentCustomer retentionCustomer lifetime value
DEFINEEnsure KPI Calculations are Consistent“Metric definitions and calculations areextremely inconsistent acrossorganizations – there were no caseswhere the most popular metricdefinition garnered even 50 percentof the responses.”- Jay Minnucci, ICMISource: Jay Minnucci, Call Centre KPIs: A Look at How Companies are Measuring Performance. Incoming Calls Management Institute.
DEFINECreate Weighted KPIs and TargetsAgent Productivity KPIAdjustedCalls PerHourKPIHandleTimeTier 2 MetricsTier 3 MetricsSource: SymmetricsTalk TimeAvailabilityAfter-callWrap TimeSign-onHoursScheduleAdherenceNon-contactWork
DEFINECreate Weighted KPIs and TargetsOverall versions20%25%20%25%213Attendance10%
Measure the Metrics that Matter1DEFINE5CONTROL2MEASUREImplement Process andTechnology to Collect andPresent KPI information4IMPROVE363ANALYZE
MEASUREDevelop a Balanced cScoreBalancedScoreCost per Call25% 2.53 3.5729.13%7.28%Customer Satisfaction20%75%45%60%12.00%First Call Resolution20%60%30%50%10.00%Agent 9.18%Agent Turnover5%4%5%20%1.00%Avg. Speed of Answer5%34045024%1.22%Call Abandonment nce Metric
Metrics and Performance ScorecardsDevelop abalancedscorecardfor eachcustomersegment ineach line ofbusiness.Line of BusinessCustomerSegment ACustomerSegment BCustomerSegment CCustomerSegment DBalanced Performance ScorecardRevenueCostHybrid/Other
Sample Scorecards by mer SatisfactionCost / CallAgent TurnoverCustomer SatisfactionFirst Call ResolutionCustomer SatisfactionCustomer SatisfactionASAASAAbandon RateAbandon RateService LevelFirst Call ResolutionAgent TrainingFirst Call ResolutionAbandon RateAgent TrainingASAASAAgent TrainingAgent UtilizationCall QualityAbandon RateCost / CallAgent UtilizationAgent TurnoverAgent UtilizationHealthcareAgent TrainingRetailSales Conversion RatesHelp DeskTicket Close RatioCustomer SatisfactionAHTFirst Contact ResolutionService LevelAbandon RateAgent UtilizationASACall Back TimeASAAbandon RateFirst Call ResolutionCustomer SatisfactionCost / CallCustomer SatisfactionAbandon RateAHTCall QualityCost / CallAgent TrainingAgent TurnoverSource: MeticNet
MEASUREDetermine Data SourcesSurveyingACDCRMWFMQASpeechAnalytics
IMPROVESetup Automated ActionsIFTHENFlaggingRepeat call aboutsame issueFlag and assignfor QA ReviewAlertsCall handle timeexceeds thresholdAlert managersStaffingCall volumeincreases andservice levels tankSend message toadhere to schedules,request overtimeCoachingSalesconversionsbelow goalAssignCoachingRe-skilling Assign skill soyou can prioritizeagent in queueOne of your coachingis now scheduled to be started.Agentassignmentscompletesskill E-learning
IMPROVESetup Automated ActionsEvery KPI should have response plan and owner.Callsper Hour1,836ServiceLevel67%Send alert to KPI owner(s)Send agents reminder message to adhere to schedulesRequest overtimeEngage Virtual Call Agents to handle low- to mediumcomplex calls
“73% of organizations take too long – 2 or more days– to deliver important metrics and KPIs.”Transitioning toReal-Time Monitoringand TransparencyVentana ResearchContact Center Analytics Benchmark Research
Satisfaction with the time required to share metrics?Source: Saddletree Research Benchmark Survey Results
Is there value in sharing metrics in real-time with agents?Source: Saddletree Research Benchmark Survey Results
Metrics of Greatest Value to Share in Real-Time with AgentsSource: Saddletree Research Benchmark Survey Results
Assess Your Culture’s Real-time ReadinessREA L - T I ME
KPIs Impacted Most by Real-Time Visibilitycostscxrevenue10%30%5%talk timespeed ofanswer25%25%wrap timeabandonratesales5%collections
Performance Management rs &ScorecardsWeightedKPIsCoaching& AlertsWHY?Better VisibilityBetter Decision MakingDrive the Right BehaviorsEngages AgentsTurns Data in Motion into Competitive Advantage49
Thank You! Questions?Patrick BotzVP of Workforce OptimizationCorporate Headquarters160 Camino RuizCamarillo, CA 93012Direct:Email:1.800.200.5430 x5214PBotz@VPI-corp.comwww.VPI-corp.comDownload your free eBook:The Business Case for ContactCenter Performance Management@ www.VPI-corp.com/Resource-Center
Call & Screen Recording Speech & Data Analytics Quality Assurance Virtual Call Agents Performance Management Workforce Management E-learning VPI @ a Glance. Inconsistent Processes S