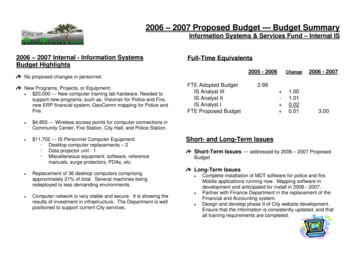
Transcription
University of Louisiana SystemBUDGET BRIEFINGApril 10, 2015
Budget Briefing Webinar Overview 30 minutes including presentation, plus Q&AAll microphones muted except speakersUse question/chat module to submit questionsYour control panel can be minimized/maximizedby clicking the orange arrow Webinar is being recorded and will be archived atwww.ulsystem.edu/webinar
FOCUS ON MERGERSLegislativeANDCLOSURESSession
Budget Briefing PanelistsDr. Sandra K. WoodleyPresidentRachel KincaidVice President of External AffairsDr. Edwin LitolffVice President of Business & Finance
8 Return for Every 1 Louisiana Invests in UL SystemNote: This 2009 Economic Impact Study does not include UNO, which joined ULS in 2012
UL System Budget HistoryFY 2009 to FY 2015 61%Change in Total Funding- 90,000,000Tuition & Fees-55%State FundingTuition& FeesTuition & Fee IncreasesTuition& Fees38%FY0962%69%StateFunding 3,098 (80%)FY1531%StateFundingCost Per Degree- 9,702 (14%)
What has ULS Done to OperateMore Efficiently? 2,455 less employees (-17%)– 508 less faculty (-11%)– 360 less administrators (-34%) Decreased Budget for Salaries -18% (- 83.5 M) Increased Budget for Benefits 19% ( 26.7 M) Eliminated/Consolidated 300 Academic Programs Increased Online Courses & Degrees Increased Collaborative Degrees Initiated Sustainability/Green Initiatives7
UL System Schools are Meeting & ExceedingPeer Performance with Less Funding80% 14,00070% 12,00060% 10,00050% 8,00040% 6,00030% 4,00020% 2,00010% 0RetentionULSGrad RatePeers 12,322 8,802ULSPeer Avg.Total Dollars Per FTE Student
FY 16 Executive Budget without Contingency Funding vs.FY 15 Operating Budget Plus Increased CostsBUDGETGAP 924.1 M – FY 2015 Budget 75.1 M – Increased Costs* 999.2 M- 390.9 M – FY 2016 Base Funds** 608.3 M*Fully Funding TOPS, WISE, LOSFA & Equity/STEM** 372.1 Million in Executive Budget Contingent on Tax Rebates
University of New Orleans Budget HistoryFY 2009 to FY 2015 38%Change in Total FundingTuition & Fees- 22,264,838-56%State FundingTuition& FeesTuition & Fee IncreasesTuition& Fees41%FY0968%59%StateFunding 3,170 (75%)FY1532%StateFunding
University of New OrleansPerformance vs. Funding80% 16,00070% 14,000 12,00060% 14,265 11,715 10,00050% 8,00040% 6,00030% 4,00020% 2,00010% 0RetentionUNOGrad RatePeersUNOPeer Avg.Total Dollars Per FTE Student11
- 82%BUDGETGAP 29.0 M – FY 2015 Budget- 5.3 M – FY 2016 Budget*- 23.7 Million* 16.1 Million in Executive Budget Contingent on Tax RebatesSource: Legislative Fiscal Office
8 Return for Every 1 Louisiana Invests in Nicholls 274 MillionAnnual Impact2,843 non-universityjobs created as a result ofNicholls spendingNote: This Economic Impact Study was completed in 2009
Nicholls State University Budget HistoryFY 2009 to FY 2015 63%Change in Total Funding- 4,875,544Tuition & Fees-55%State FundingTuition& FeesTuition & Fee IncreasesTuition& Fees40%FY0960%71%StateFunding 3,583 (98%)FY1529%StateFunding
Nicholls State UniversityPerformance vs. Funding80% 12,00070% 10,00060% 8,00050% 10,653 7,944 6,00040% 4,00030%20% 2,00010% 0RetentionNichollsGrad RatePeersNichollsPeer Avg.Total Dollars Per FTE Student15
- 82%BUDGETGAP 14.6 M – FY 2015 Budget- 2.6 M – FY 2016 Budget*- 12 Million* 8 Million in Executive Budget Contingent on Tax RebatesSource: Legislative Fiscal Office
8 Return for Every 1 Louisiana Invests in McNeese 335 MillionAnnual Impact3,520 non-universityjobs created as a result ofMcNeese spendingNote: This Economic Impact Study was completed in 2009
McNeese State University Budget HistoryFY 2009 to FY 2015 60%Tuition & FeesChange in Total Funding- 9,738,918-58%State FundingTuition& FeesTuition & Fee IncreasesTuition& Fees37%FY0963%69%StateFunding 2,912 (85%)FY1531%StateFunding
McNeese State UniversityPerformance vs. Funding80% 12,00070% 10,00060% 8,00050% 11,086 7,172 6,00040% 4,00030%20% 2,00010% 0RetentionMcNeeseGrad RatePeersMcNeesePeer Avg.Total Dollars Per FTE Student19
- 82%BUDGETGAP 17.2 M – FY 2015 Budget- 3.2 M – FY 2016 Budget*- 14 Million* 9.5 Million in Executive Budget Contingent on Tax RebatesSource: Legislative Fiscal Office
8 Return for Every 1 Louisiana Invests in Northwestern 353 MillionAnnual Impact3,738 non-universityjobs created as a result ofNorthwestern spendingNote: This Economic Impact Study was completed in 2009
Northwestern State University Budget HistoryFY 2009 to FY 2015 66%Tuition & FeesChange in Total Funding- 8,156,690-56%State FundingTuition& FeesTuition & Fee IncreasesTuition& Fees38%FY0962%70%StateFunding 3,188 (89%)FY1530%StateFunding
Northwestern State UniversityPerformance vs. Funding80% 14,00070% 12,00060% 10,00050% 8,00040% 6,00030% 4,00020% 2,00010% 0RetentionNorthwesternGrad RatePeers 11,888 8,590NorthwesternPeer Avg.Total Dollars Per FTE Student23
- 82%BUDGETGAP 20.0 M – FY 2015 Budget- 3.7 M – FY 2016 Budget*- 16.3 Million* 11.1 Million in Executive Budget Contingent on Tax RebatesSource: Legislative Fiscal Office
8 Return for Every 1 Louisiana Invests in ULM 350 MillionAnnual Impact3,669 non-universityjobs created as a result ofULM spendingNote: This Economic Impact Study was completed in 2009
University of Louisiana at Monroe Budget HistoryFY 2009 to FY 2015 57%Tuition & FeesChange in Total Funding- 13,162,355 -54%State FundingTuition& FeesTuition & Fee IncreasesTuition& Fees35%FY09State65%Funding65% 3,172 (84%)FY1535%StateFunding
University of Louisiana at MonroePerformance vs. Funding80% 14,00070% 12,00060% 10,00050% 8,00040% 6,00030% 4,00020% 2,00010% 0RetentionULMGrad RatePeers 11,624 8,254ULMPeer Avg.Total Dollars Per FTE Student*FTE adjusted for pharmacy
- 83%BUDGETGAP 23.8 M – FY 2015 Budget- 4.0 M – FY 2016 Budget*- 19.8 Million* 11.9 Million in Executive Budget Contingent on Tax RebatesSource: Legislative Fiscal Office
8 Return for Every 1 Louisiana Invests in Grambling 264 MillionAnnual Impact2,778 non-universityjobs created as a result ofGrambling spendingNote: This Economic Impact Study was completed in 2009
Grambling State University Budget HistoryFY 2009 to FY 2015 34%Change in Total Funding- 7,883,705Tuition & Fees-53%State FundingTuition& FeesTuition & Fee IncreasesTuition& Fees45%FY0970%55% StateFunding 2,721 (72%)FY1530%StateFunding
Grambling State UniversityPerformance vs. Funding80% 16,00070% 14,000 14,327 12,00060% 10,00050% 8,00040% 7,560 6,00030% 4,00020% 2,00010% 0RetentionGSUGrad RatePeersGSUPeer Avg.Total Dollars Per FTE Student31
- 83%BUDGETGAP 13.5 M – FY 2015 Budget- 2.3 M – FY 2016 Budget*- 11.2 Million* 6.9 Million in Executive Budget Contingent on Tax RebatesSource: Legislative Fiscal Office
8 Return for Every 1 Louisiana Invests in LA Tech 462 MillionAnnual Impact4,760 non-universityjobs created as a result ofLA Tech spendingNote: This Economic Impact Study was completed in 2009
Louisiana Tech University Budget HistoryFY 2009 to FY 2015 79%Tuition & FeesChange in Total Funding- 747,536-53%State FundingTuition& FeesTuition & Fee IncreasesTuition& Fees40%FY0960%71%StateFunding 3,017 (60%)FY1529%StateFunding
Louisiana Tech UniversityPerformance vs. Funding80% 14,00070% 12,00060% 10,00050% 8,00040% 6,00030% 4,00020% 2,00010% 0RetentionTechGrad RatePeers 12,848 10,091TechPeer Avg.Total Dollars Per FTE Student35
- 83%BUDGETGAP 26.7 M – FY 2015 Budget- 4.6 M – FY 2016 Budget*- 22.1 Million* 13.8 Million in Executive Budget Contingent on Tax RebatesSource: Legislative Fiscal Office
8 Return for Every 1 Louisiana Invests in Southeastern 564 MillionAnnual Impact5,748 non-universityjobs created as a result ofSoutheastern spendingNote: This Economic Impact Study was completed in 2009
Southeastern Louisiana University Budget HistoryFY 2009 to FY 2015 70%Change in Total FundingTuition & Fees- 13,819,465-60%State FundingTuition& FeesTuition & Fee IncreasesTuition& Fees38%FY0962%72%StateFunding 2,826 (76%)FY1528%StateFunding
Southeastern Louisiana UniversityPerformance vs. Funding70% 12,000 10,38760% 10,00050% 8,00040% 6,00030% 4,00020% 2,00010% 0RetentionSoutheasternGrad RatePeers 7,520SoutheasternPeer Avg.Total Dollars Per FTE Student39
- 84%BUDGETGAP 28.9 M – FY 2015 Budget- 4.7 M – FY 2016 Budget*- 24.2 Million* 14.1 Million in Executive Budget Contingent on Tax Rebates
8 Return for Every 1 Louisiana Invests in UL Lafayette 755 MillionAnnual Impact7,783 non-universityjobs created as a result ofUL Lafayette spendingNote: This Economic Impact Study was completed in 2009
University of Louisiana at Lafayette Budget HistoryFY 2009 to FY 2015 76%Tuition & FeesChange in Total Funding- 8,809,779-50%State FundingTuition& FeesTuition & Fee IncreasesTuition& Fees35%FY09State65%Funding65% 3,298 (92%)FY1535%StateFunding
University of Louisiana at LafayettePerformance vs. Funding80% 16,00070% 14,000 13,822 12,00060% 10,00050% 8,977 8,00040% 6,00030% 4,00020% 2,00010% 0RetentionUL LafayetteGrad RatePeersUL LafayettePeer Avg.Total Dollars Per FTE Student43
- 84%BUDGETGAP 43.9 M – FY 2015 Budget- 7.0 M – FY 2016 Budget*- 36.9 Million* 20.5 Million in Executive Budget Contingent on Tax RebatesSource: Legislative Fiscal Office
Additional UL System Economic ImpactsOn average, there are 100 events takingplace every day at UL System campuses.188 research centers and service programs: Created or sustained 26,300 jobs, Generated or saved 3 billion business revenue, Stimulated 132 million investment dollars, & Provided 108 million direct cost savings services.
Question & Answer SessionDr. Sandra K. WoodleyPresidentRachel KincaidVice President of External AffairsDr. Edwin LitolffVice President of Business & Finance
Next BriefingFOCUS ON Friday, April 17, 2015LegislativeBills
Increased Online Courses & Degrees Increased Collaborative Degrees Initiated Sustainability/Green Initiatives . 7 . . 1 Louisiana Invests in Grambling Note: This Economic Impact Study was completed in 2009 . 264 Million Annual Impact 2,778 non-university jobs cre
