Transcription
The ROI ofUsing a PEOLaurie Bassi and Dan McMurrerMcBassi & CompanySeptember 2019
IntroductionThe ROI ofUsing a PEOLaurie Bassi and Dan McMurrer, McBassi & CompanySeptember 2019The areas where PEOs can deliver significant value to their clients can be divided intothree broad categories: Improving clients’ ability to attract, motivate, and retain employees; Enabling clients to focus on their core businesses while PEOs handle all HRmatters; and Lowering HR-related expenditures.The first two categories have been addressed in NAPEO’s previous white papers.Those papers found a wide array of positive differences between PEO clients andtheir non-PEO counterparts in business success, employee-related measures, andother factors.For example, incategory 1, we foundthat PEOs offer a muchANNUAL RETURN ON INVESTMENTbroader array of benefits(COST SAVINGS ALONE)FROM USING A PEOto their employees,such as greater accessto retirement plans.Consistent with this, wefound PEO clients alsohave significantly higheremployee satisfaction aswell as lower rates of employee turnover. In category 2, our analysis found PEO clientsgrow faster and are much more likely to stay in business than other companies.Further, their employees are more likely to describe the business as innovative andtaking the right steps to be competitive.Therefore, in the 2019 white paper, we focused our research on category 3in an effort to fill in some details about that remaining piece of the PEO valueequation. Specifically, if we look only at cost savings (leaving all other PEO-relatedbenefits to the side), what sort of return could the average client expect on its PEO27.2%Contents2What Does an ROI of27.2% Mean?3How We Did theResearch3How ROI Was Calculated4Additional Sources ofValue6Summing Up:Implications for PEOs7Methodology Appendix12About McBassi &Company1
What Does an ROI of 27.2% Meaninvestment?1 Although it is only one component of the overall value deliveredby PEOs, it is still one of the most basic questions prospective clients have whendeciding whether to use a PEO—will they experience sufficient cost savings togenerate a positive return on their investment?The research summarized here indicates that a conservative estimate of the expectedROI for PEO clients—based on cost savings alone—is 27.2 percent per year. This ROIestimate is almost certainly an underestimate and is based only on cost savings (it doesnot incorporate the important benefits noted above in categories 1 and 2).The 27.2 percent estimate is based on calculating cost savings for PEO clients in thefollowing five HR-related areas: HR personnel costs; Health benefits; Workers’ compensation; Unemployment insurance (UI); and Other external expenditures in areas related directly to HR services (payrollservices, benefits, etc.)1We are extremely grateful to the following PEOs and other partner organizations for their invaluableassistance in enrolling clients, members, and other organizations in this research initiative: ADPTotalSource, the U.S. Chamber of Commerce, Delta Administrative Services, The Employer Group,InfinitiHR, Landrum HR, Lyons HR, the National Marine Manufacturers Association, Paychex, ServantHR, Slavic401k, Staff One HR, and SWBC PEO. Without the generous assistance and hard work of theseorganizations, this research would not have been possible.What Does an ROI of 27.2% Mean?Return on investment (ROI) is the net benefit of an investment divided by the cost of the investment. Cost is thekey element in almost all ROI calculations. This is because cost savings are much more tangible and hencemore readily quantifiable than value (benefits) created. As a result, most analytically-responsible ROI estimatestend to underestimate the true value of an investment (as is the case here).For a PEO client, the net cost savings benefit of hiring a PEO is equal to the savings that the clientexperiences as a result of using a PEO minus the cost of being a PEO client. Dividing that by cost yields ROI.We calculated clients’ savings based on five different categories of HR-related costs and compared them tothe average cost of being a PEO client (PEOs’ average gross profit per WSE from NAPEO’s 2018 Financial Ratio& Operating Statistics (FROS) Survey data). By far, the most significant savings that clients experience fromusing PEOs are in the areas of HR personnel costs and health benefits costs.An ROI of 27.2 percent means that for every 1,000 spent on PEO services, an average client would save 1,272, yielding a net (cost savings) benefit of 272 for every 1,000 spent.It is important to understand that the calculated ROI is an average drawn from all PEO clients in ourresearch database. This means that roughly half of prospective clients would be expected to have an ROIgreater than 27.2 percent, while half would be expected to have an ROI lower than that.Prospective clients most likely to have ROIs even higher than 27.2 percent are those that have aboveaverage HR personnel costs and/or above-average health benefits costs per employee. It’s worth notingagain that this ROI is based only on cost savings and does not incorporate the important benefits derived fromimproving clients’ ability to attract, motivate, and retain employees and enabling clients to focus on their corebusinesses, as documented in our prior reasearch.2
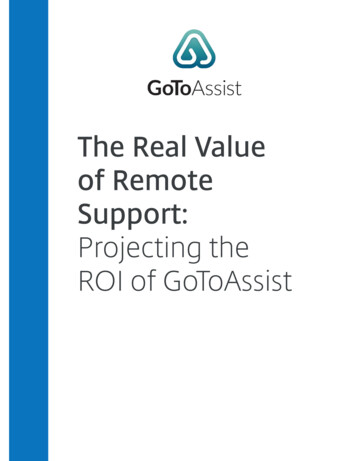
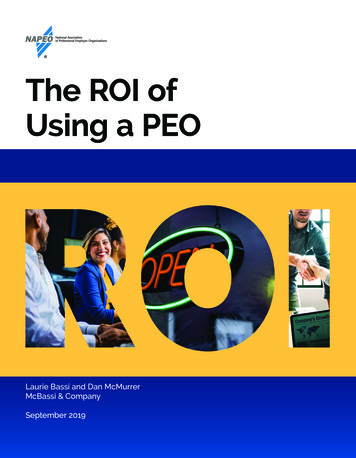
How We Did the ResearchHow We Did The ResearchWe offered organizations (both PEO clients and organizations that do not use PEOs) afree employee survey. To take advantage of this offer, each participating organizationwas required to complete a detailed enrollment form that included a variety ofmeasures that could be used for purposes of our research comparing PEO clients tobenchmarks for other organizations on HR-related expenditures as well as a varietyof other factors we also included in the enrollment form. The cost-based comparisonserved as the basis for the ROI estimate noted above.A total of 132 PEO clients (represented by at least 10 different PEOs) submitted dataas part of this survey/research initiative. We also received data from 44 organizationsthat are not PEO clients.Full details about our research methods are included in the Methodology section atthe end of this paper.How ROI Was CalculatedThe estimated ROI of 27.2 percent per year was derivedAVERAGE ANNUAL COST SAVINGS PERby calculating PEO-related cost savings per employeeEMPLOYEE(FTE) from the five expenditure categories noted aboveInternal HR salaries/benefits 54%4%5%and comparing it with PEO-related costs per worksiteHealth benefits costs 37% 965employee (WSE) from the 2018 NAPEO Financial RatioOther external HR expenditures 5%& Operating Statistics Survey. The average cost savingsWorkers’ compensation costs 4%37%54%from using a PEO is 1,775 per year per employee, whileUnemployment insurance costs 0% 965the average PEO cost per employee (gross profit perTotal average cost savings: 1,775 per FTEWSE in the FROS) is 1,395, yielding an annual ROI of27.2 percent.2Figure 1. Percentage of annual savings per employee (FTE) by costBy percentage, using a PEO results in the savingscategory for PEO clients.included in Figure 1 (all measured on a per FTE basis).Savings on internal HR employees’ salaries/benefits wasdetermined by comparing the number of HR FTEs among PEO clients (mean of 1.6FTEs per 100 employees based on data we gathered through the research initiative)to the mean number of HR FTEs (2.6 per 100 employees) among businesses as awhole (based on a large survey of businesses conducted by the Society for HumanResources Management (SHRM) in 2017) and applying Glassdoor data for average HRsalary/benefits in small businesses.Savings in the three remaining categories—health benefits, workers’ compensation,and unemployment insurance—were calculated using questions from the enrollmentform (using data from new PEO clients only). Respondents were asked howorganizational costs in those categories had changed since starting to use a PEO2 Because these numbers are averages, they can vary significantly based a wide variety of factors.Specifically, using a PEO results in average savings (per FTE) in the following categories: internal HRsalaries/benefits 965; health benefits costs 654; other external HR expenditures 90; workers’compensation costs 66. Although there are savings in unemployment insurance as well, we used avalue of 0 for the ROI calculation due to data limitations that prevented pinpointing the exact amountof UI savings.3
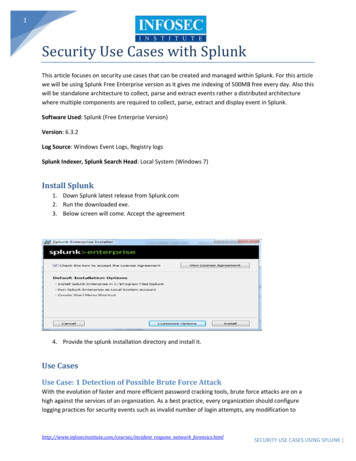
Additional Sources of Value(see Figure 2 for percentages of businesses reportingchanges in costs). They were also asked to provide theexact amount of the difference in costs, if they had onInsuranceinformation available. Respondents provided sufficient63%30%30%data to determine exact savings for health benefits3LOWERand workers’ compensation, but not unemployment31%70%65%insurance. 4 On the health benefits front in particular,ABOUT THE SAMEit is important to note that, on average, PEOs are also6%0%5%HIGHERable to provide a wider range of health benefits optionsto their clients, a benefit that is not reflected whenFigure 2. Differences in costs for new PEO clients by cost category.focusing solely on cost savings.Savings in other HR expenditures were calculatedusing enrollment data for this research project, comparing reported externalHR expenditures between non-PEO businesses and their closest comparison(determined by industry and size) business among PEO clients.% OF NEW PEO CLIENTSWHO SAYS COSTS WITH PEO ARE.Additional Sources of Value PEOs Deliver toTheir ClientsEnrollment submissions provided additional data that we used to complementresearch reported in previous NAPEO white papers on the first two categories of PEOrelated value described at the beginning of this paper (attracting/motivating/retainingemployees and enabling clients to focus on driving core business success).In many cases, we were able to use the 2019 enrollment information as anadditional source of data on key value areas we had examined previously whenusing different data sources. Every time major findings are confirmed by differentdata sources, comparisons, or analytic techniques, the findings can be consideredmore solid and more definitive. Thus, we viewed the enrollment data as an excellentopportunity to re-examine previous areas of our NAPEO white paper research.3It is possible some PEOs may offer temporary introductory health benefits rates to their newestclients. There was no indication of this in our data, however, as we found similar average differences inhealth benefits costs for the newest PEO clients (less than one year with PEO) and clients with longerdurations. Although the data included in our calculations is for clients who have been with their PEOsfor two years or fewer, the numbers would be similar (actually, they would reflect a somewhat higherlevel of savings) if the cutoff were set at five years instead of two years.4 As seen in Figure 1, roughly one-third of respondents said their UI costs were now lower and almostall others said UI costs were about the same. Because almost no respondents were able to providedata on the exact amount of change in that category, however, it is included as 0, although the actualvalue is almost certainly higher than that. This factor also contributes to our ROI estimate being aconservative, lower-bound estimate.5 We examined differences between PEO clients and others across a number of other measures as well(specifically, employee benefits, other less-frequent business challenges, executives’ time on HR, andprofitability rates), but found no clear patterns in the results. Due to the need for comparable measures,we conducted most of the analyses using the enrollment data. We believe the small sample sizesand lack of strong comparability between the organizations in the PEO group and the non-PEO groupcontributed to lack of clarity in those results.4
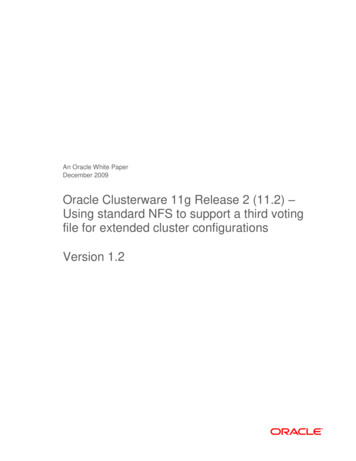
Additional Sources of ValueIn particular, our 2019 analysis revealed the followingfour important findings:5 There is notably lower employee turnover (bothvoluntary and involuntary) among PEO clients;There are higher rates of both employee growthand business revenue growth among PEO clients;Fewer PEO clients expressed moderate or majorconcern about hiring, retaining, and motivatingemployees; andNew PEO clients often add a variety of newbenefits for their employees, with life insurance,retirement plans, and health benefits thecategories most frequently added by new PEOclients.ANNUAL EMPLOYEE TURNOVER 48.929.3-19.6GROWTH RATES (%) 2018 to 2019PEOClients# OFEMPLOYEESNon-PEOClients5.61.413.58.54.25.0Figure 4. Growth rates, PEO clients versus non-PEO clients.% BUSINESS OWNERS CONCERNEDABOUT.HIRINGRETAININGMOTIVATINGHigher Rates of GrowthFewer Concerns About Employee ChallengesDifferenceBUSINESSREVENUESEMPLOYEESWe compared 2018 to 2019 growth rates in actualnumber of employees and in expected change inbusiness revenues and found notably higher growthrates for PEO clients versus non-PEO clients. Detailedresults are included in Figure 4.DifferenceFigure 3. Annual employee turnover percentage, PEO clients versusall businesses.Lower Employee TurnoverWe compared voluntary and involuntary employeeturnover between PEO clients and national averagesfor all non-governmental employers from the Bureau ofLabor Statistics (BLS).We found significantly lower employee turnoveramong PEO clients. Combining voluntary andinvoluntary departures, total employee turnoveramong PEO clients was almost 20 percentage pointslower than turnover nationally. Exact breakdowns areincluded in Figure 6-5.3DifferenceFigure 5. Percentage of business owners with “moderate or major”concerns about employee-related challenges.We asked respondents in the enrollment process aboutwhether they had “moderate or major” concerns abouta wide range of different potential business challenges.Only three categories were identified as concerns by more than half of all respondents:those related to hiring, retaining, and motivating employees. See Figure 5.For each of these challenges, fewer PEO clients expressed concern than non-PEOclients, with a particularly notable difference in concerns about hiring employees (a25 percentage point difference; 72.7 percent of non-PEO clients versus 47.7 percent ofPEO clients).5
Summing Up: Implications for PEOsBENEFITS MOST FREQUENTLYADDED BY NEW PEO CLIENTSEmployee Benefits Added by New PEOClientsWe were also able to use the research database todetermine which types of employee benefits were most26%26%42%frequently added when an organization began workingwith a PEO. Life insurance, retirement plans, and healthHealthRetirementbenefits were the three most frequently added, withLifebenefitsplaninsuranceexact numbers provided in Figure 6.Although this does not directly compare PEO clientsand non-PEO clients, it does provide another exampleFigure 6. Employee benefits most frequently added by new PEOof an advantage that accrues to PEO clients.clients.Finally, the survey enrollment form also asked PEOclients whether they would recommend a PEO to a small business colleague. In afinding that mirrors a result from NAPEO’s 2017 white paper, 98 percent of all PEOclients responded affirmatively that they would recommend a PEO.Summing Up: Implications for PEOsFindings from previous NAPEO white papers had pointed to the significant value thatPEOs deliver to their clients in helping to attract/motivate/retain employees anddeliver better business results. Many of those findings were confirmed using new datafrom this analysis. Most importantly, however, this year’s analysis helped to fill in animportant missing gap in the PEO value equation—cost savings.This year’s research found that the cost savings ROI on a PEO investment isconservatively 27.2percent per year.The cost savingsframework providedin this white paper canserve as the foundationOF PEO CLIENTSfor PEOs to createWOULD RECOMMEND A PEO TO Atheir own, customizedSMALL BUSINESS COLLEAGUEROI calculators(incorporating their owncosts as well as clients’actual costs). This would serve as an excellent tool to help prospective clients quicklyunderstand the cost-related benefits they would experience by working with thatPEO.In sorting through implications for PEOs’ business development efforts and otherstrategic considerations, it is important to keep in mind that the ROI reported here isan average. As mentioned in the box on page 2, roughly half of all prospective clientswould be expected to have a cost savings ROI higher than the average of 27.2 percent(and correspondingly, roughly half would also be expected to have lower ROIs).From a cost-savings perspective, to the extent that it’s possible to target potentialclients with higher-than-average ROIs, business development efforts are likely to bemore successful. In particular, it would make sense to seek prospective clients that98%6
Methodology Appendixhave higher-than-average costs in one (or both) of the two categories of HR-relatedexpenses where PEOs can typically deliver the biggest savings: HR personnel costsand health benefits costs. These are the organizations that would experience thelargest ROI from being PEO clients.Similarly, businesses with higher-than-average employee turnover (or those thathave difficulty attracting or motivating their employees) as well as those that struggleto focus on their core business operations also represent good targets for businessdevelopment, based on findings from both this year’s and previous years’ researchresults. The businesses that can derive maximum value from PEO services, of course,are those that have more than one of the characteristics described above.Methodology AppendixAnalysis SampleThis project (like the NAPEO 2017 white paper) was built around the provision of afree employee survey to small- and mid-sized businesses if they provided detailedbusiness-level data that we would use for research purposes. For purposes of thisproject, we asked interested businesses to provide information about the functioningof their businesses (including HR-related costs, how HR work is done, trends infinancial results, number of employees, business concerns, etc.). All organizations thatcompleted the enrollment form were provided with a free employee survey and freebenchmarking, available to use at any time during calendar year 2019.We used a variety of methods to make the employee survey offer available tobusinesses. PEOs represented the primary vehicle for distributing the offer (mostmaking the offer available widely to any clients who expressed interest, as wellas some prospective clients and other business contacts). PEO outreach effortswere complemented by additional offers sent directly to businesses by McBassi orother partner organizations. At least 14 different organizations (PEOs, partners, etc.)generated one or more participating business for this research project. Outreach andbusiness enrollment ran from April to July 2019.These efforts to enroll businesses yielded a research data sample of 176organizations. This includes 132 PEO clients and 44 businesses that do not use PEOs.Most, but not all, of the PEO clients were enrolled through the outreach efforts fromtheir PEOs. The sample size of PEO clients is thus adequate for analysis purposes.6(Not all participants answered all questions, so sample sizes vary somewhat acrossmeasures.) The comparison (non-PEO client) group is smaller and was therefore usedless frequently; only for those metrics for which no other external comparison data isavailable.6 It should be noted that the average business in the database (median of 34.0 FTEs) is somewhat largerthan an average PEO client based on the median (23.2 WSEs) reported in the 2019 FROS report.7 page
Aug 05, 2019 · & Operating Statistics Survey. The average cost savings from using a PEO is 1,775 per year per employee, while the average PEO cost per employee (gross profit per WSE in the FROS) is 1,395, yielding an annual ROI of 27.2 percent.2 By percentage, using a PEO results in the saving