Transcription
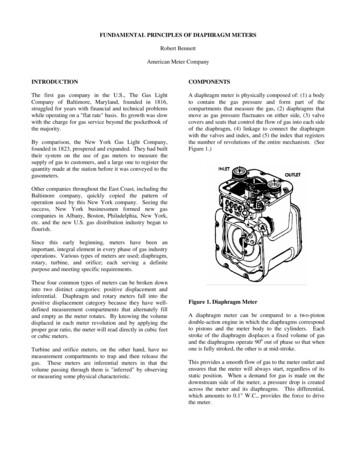
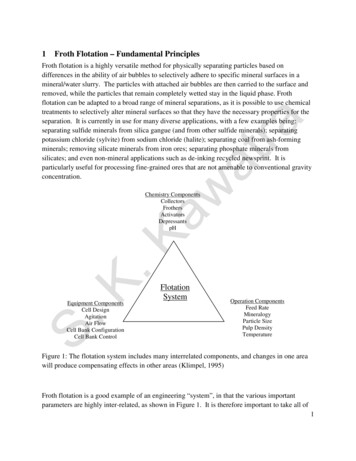
1Froth Flotation – Fundamental PrinciplesFroth flotation is a highly versatile method for physically separating particles based ondifferences in the ability of air bubbles to selectively adhere to specific mineral surfaces in amineral/water slurry. The particles with attached air bubbles are then carried to the surface andremoved, while the particles that remain completely wetted stay in the liquid phase. Frothflotation can be adapted to a broad range of mineral separations, as it is possible to use chemicaltreatments to selectively alter mineral surfaces so that they have the necessary properties for theseparation. It is currently in use for many diverse applications, with a few examples being:separating sulfide minerals from silica gangue (and from other sulfide minerals); separatingpotassium chloride (sylvite) from sodium chloride (halite); separating coal from ash-formingminerals; removing silicate minerals from iron ores; separating phosphate minerals fromsilicates; and even non-mineral applications such as de-inking recycled newsprint. It isparticularly useful for processing fine-grained ores that are not amenable to conventional gravityconcentration.Chemistry HFlotationSystemEquipment ComponentsCell DesignAgitationAir FlowCell Bank ConfigurationCell Bank ControlOperation ComponentsFeed RateMineralogyParticle SizePulp DensityTemperatureFigure 1: The flotation system includes many interrelated components, and changes in one areawill produce compensating effects in other areas (Klimpel, 1995)Froth flotation is a good example of an engineering “system”, in that the various importantparameters are highly inter-related, as shown in Figure 1. It is therefore important to take all of1
these factors into account in froth flotation operations. Changes in the settings of one factor (suchas feed rate) will automatically cause or demand changes in other parts of the system (such asflotation rate, particle size recovery, air flow, pulp density, etc.) As a result, it is difficult tostudy the effects of any single factor in isolation, and compensation effects within the system cankeep process changes from producing the expected effects (Klimpel, 1995). This makes itdifficult to develop predictive models for froth flotation, although work is being done to developsimple models that can predict the performance of the circuit from easily-measurable parameterssuch as solids recovery and tailings solid content (Rao et al., 1995).1.1Performance CalculationsThere is no one universal method for expressing the effectiveness of a separation, but there areseveral methods that are useful for examining froth flotation processes:(a) Ratio of Concentration, the weight of the feed relative to the weight of the concentrate, TheRatio of Concentration is F/C, where F is the total weight of the feed and C is the total weight ofthe concentrate. One limitation with this calculation is that it uses the weights of the feed andconcentrate. While this data is available in laboratory experiments, in the plant it is likely thatthe ore is not weighed and only assays will be available. However, it is possible to express theratio of concentration in terms of ore assays. Starting with the mass balance equations, and thedefinition of the ratio of concentration:F C T,Ff Cc Tt,Ratio of Concentration F/Cwhere F, C, and T are the % weights of the feed, concentrate, and tailings, respectively; and f, c,and t are the assays of the feed, concentrate, and tailings. We now need to eliminate T from theseequations so that we can solve for F/C:Ff Cc Tt, and multiplying (F C T) by t gives us:Ft Ct Tt, so subtracting this equation from the previous eliminates T and gives:F(f - t) C(c - t), and rearranging produces the equation for the ratio of concentration:F/C (c – t)/(f – t)(b) % Metal Recovery, or percentage of the metal in the original feed that is recovered in theconcentrate. This can be calculated using weights and assays, as (Cc)/(Ff)·100. Or, since C/F (f – t)/(c – t), the % Metal Recovery can be calculated from assays alone using 100(c/f)(f – t)/(c –t).(c) % Metal Loss is the opposite of the % Metal Recovery, and represents the material lost to thetailings. It can be calculated simply by subtracting the % Metal Recovery from 100%.2
(d) % Weight Recovery is essentially the inverse of the ratio of concentration, and equals100·C/F 100·(f – t)/(c – t).(e) Enrichment Ratio is calculated directly from assays as c/f, weights are not involved in thecalculation.Example Calculations:Problem: A copper ore initially contains 2.09% Cu. After carrying out a froth flotationseparation, the products are as shown in Table 1. Using this data, calculate:(a) Ratio of concentration(b) % Metal Recovery(c) % Metal Loss(d) % Weight Recovery, or % Yield(e) Enrichment RatioTable 1: Grade/recovery performance of a hypothetical copper ore flotation process.Feedf 2.09% CuF 100% WtConcentratec 20% CuC 10% WtProductFeedConcentrateTailingsTailingst 0.1% CuT 900% Wt% Weight1001090% Cu Assay2.0920.00.1(a) From Table 1, the Ratio of Concentration can be calculated as F/C 100/10 10. If onlyassays are available, the ratio of concentration equals (20 – 0.1)/(2.09 – 0.1) 10So, for each 10 tons of feed, the plant would produce 1 ton of concentrate.(b) Using the example data from Table 1, the % Cu recovery calculated from weights and assaysis:% Cu Recovery [(10·20)/(2.09·100)]·100 95.7%3
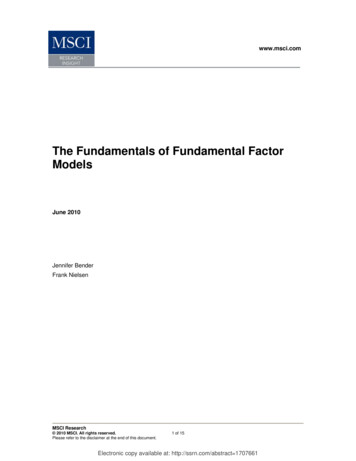
The calculation using assays alone is% Cu Recovery 100(20/2.09)(2.09 – 0.1)/(20 – 0.1) 95.7%This means that 95.7% of the copper present in the ore was recovered in the concentrate, whilethe rest was lost in the tailings.(c) The % Cu Loss can be calculated by subtracting the % Cu Recovery from 100%:% Cu Loss 100 – 95.7 4.3%This means that 4.3% of the copper present in the ore was lost in the tailings.(d) The % Weight Recovery is equal to the % Weight of the concentrate in Table 1. It can alsobe calculated from the assay values given in the table, as follows:% Weight Recovery 100·(2.09 - 0.1)(20 – 0.1) 10%(e) The Enrichment Ratio is calculated by dividing the concentrate assay in Table 1 by the feedassay:Enrichment Ratio 20.0/2.09 9.57This tells us that the concentrate has 9.57 times the copper concentration of the feed.1.1.1Grade/Recovery CurvesWhile each of these single calculated values are useful for comparing flotation performance fordifferent conditions, it is most useful to consider both the grade and the recovery simultaneously,using a “Grade/Recovery Curve”. This is a graph of the recovery of the valuable metal achievedversus the product grade at that recovery, and is particularly useful for comparing separationswhere both the grade and the recovery are varying. A set of grade/recovery curves is shown inFigure 2. If 100% of the feed is recovered to the product, then the product will obviously havethe same composition as the feed, and so the curve starts at the feed composition with 100%recovery. Similarly, if the purest mineral grain that contains the metal of interest is removed, thiswill be the maximum grade that can be produced by a physical separation, and so the 0%recovery end of the curve terminates at an assay less than or equal to the assay of the purestgrains available in the ore. In the graphs shown in Figure 2, points that are higher and to theright show better performance than points that are lower and to the left.4
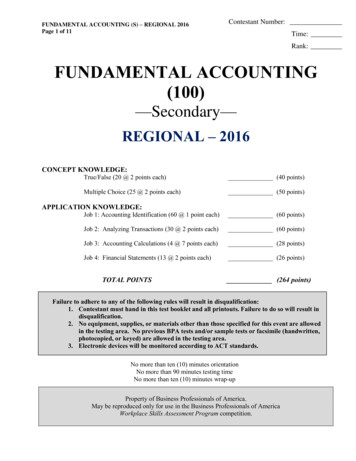
100% Metal igure 2: Typical form of Grade/Recovery Curves for froth flotation1.2Hydrophobicity/hydrophilicityThe basis of froth flotation is the difference in wettabilities of different minerals. Particles rangefrom those that are easily wettable by water (hydrophilic) to those that are water-repellent(hydrophobic). If a mixture of hydrophobic and hydrophilic particles are suspended in water,and air is bubbled through the suspension, then the hydrophobic particles will tend to attach tothe air bubbles and float to the surface, as shown in Figure 3. The froth layer that forms on thesurface will then be heavily loaded with they hydrophobic mineral, and can be removed as aseparated product. The hydrophilic particles will have much less tendency to attach to airbubbles, and so it will remain in suspension and be flushed away (Whelan and Brown, 1956).Particles can either be naturally hydrophobic, or the hydrophobicity can be induced by chemicaltreatments. Naturally hydrophobic materials include hydrocarbons, and non-polar solids such aselemental sulfur. Coal is a good example of a material that is typically naturally hydrophobic,because it is mostly composed of hydrocarbons. Chemical treatments to render a surfacehydrophobic are essentially methods for selectively coating a particle surface with a monolayerof non-polar oil.5
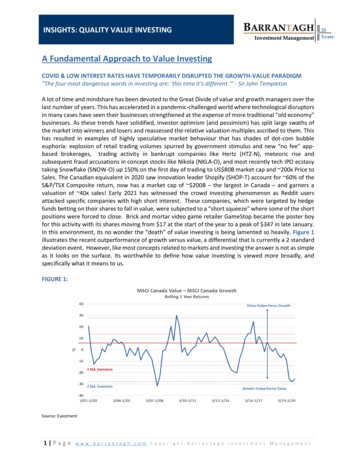
HydrophobicparticlesAir BubblesHydrophilicparticlesFigure 3: Selective attachment of air bubbles to hydrophobic particles. The buoyancy of thebubbles then carries these particles to the surface, leaving the hydrophilic particles behind.The attachment of the bubbles to the surface is determined by the interfacial energies betweenthe solid, liquid, and gas phases. This is determined by the Young/Dupre Equation,γlvcosθ (γsv – γsl)where γlv is the surface energy of the liquid/vapor interface, γsv is the surface energy of thesolid/vapor interface, γsl is the surface energy of the solid/liquid interface, and θ is the “contactangle”, the angle formed at the junction between vapor, solid, and liquid phases, as shown inFigure 4. If the contact angle is very small, then the bubble does not attach to the surface, whilea very large contact angle results in very strong bubble attachment. A contact angle near 90 issufficient for effective froth flotation in most cases.γlvLiquidVapor(or air)γsvθ γslSolidFigure 4: Contact angle between and air bubble and a solid surface immersed in liquid.6
1.3Particle/Bubble ContactOnce the particles are rendered hydrophobic, they must be brought in contact with gas bubbles sothat the bubbles can attach to the surface. If the bubbles and surfaces never come in contact, thenno flotation can occur. Contact between particles and bubbles can be accomplished in a flotationcell such as the one shown schematically in Figure 5.AirStatorFroth OverflowFrothSlurryRotorFigure 5: Simplified schematic of a conventional flotation cell. The rotor draws slurry throughthe stator and expels it to the sides, creating a suction that draws air down the shaft of the stator.The air is then dispersed as bubbles through the slurry, and comes in contact with particles in theslurry that is drawn through the stator.Particle/bubble collision is affected by the relative sizes of the particles. If the bubbles are largerelative to the particles, then fluid flowing around the bubbles can sweep the particles pastwithout coming in contact. It is therefore best if the bubble diameter is comparable to theparticle diameter in order to ensure good particle/bubble contact.1.4Collection in the Froth LayerOnce a particle and bubble have come in contact, the bubble must be large enough for itsbuoyancy to lift the particle to the surface. This is obviously easier if the particles are lowdensity (as is the case for coal) than if they are high-density (such as lead sulfide). The particleand bubble must remain attached while they move up into the froth layer at the top of the cell.The froth layer must persist long enough to either flow over the discharge lip of the cell by7
gravity, or to be removed by mechanical froth scrapers. If the froth is insufficiently stable, thebubbles will break and drop the hydrophobic particles back into the slurry prematurely.However, the froth should not be so stable as to become persistent foam, as a foam is difficult toconvey and pump through the plant.The surface area of the bubbles in the froth is also important. Since particles are carried into thefroth by attachment to bubble surfaces, increasing amounts of bubble surface area allows a morerapid flotation rate of particles. At the same time, increased surface area also carries more waterinto the froth as the film between the bubbles. Since fine particles that are not attached to airbubbles will be unselectively carried into the froth along with the water (entrainment), excessiveamounts of water in the froth can result in significant contamination of the product with gangueminerals.1.5ReagentsThe properties of raw mineral mixtures suspended in plain water are rarely suitable for frothflotation. Chemicals are needed both to control the relative hydrophobicities of the particles, andto maintain the proper froth characteristics. There are therefore many different reagents involvedin the froth flotation process, with the selection of reagents depending on the specific mineralmixtures being treated.1.5.1CollectorsCollectors are reagents that are used to selectively adsorb onto the surfaces of particles. Theyform a monolayer on the particle surface that essentially makes a thin film of non-polarhydrophobic hydrocarbons. The collectors greatly increase the contact angle so that bubbles willadhere to the surface. Selection of the correct collector is critical for an effective separation byfroth flotation. Collectors can be generally classed depending on their ionic charge: they can benonionic, anionic, or cationic, as shown in Figure 6. The nonionic collectors are simplehydrocarbon oils, while the anionic and cationic collectors consist of a polar part that selectivelyattaches to the mineral surfaces, and a non-polar part that projects out into the solution andmakes the surface hydrophobic. Collectors can either chemically bond to the mineral surface(chemisorption), or be held on the surface by physical forces (physical adsorption).1.5.1.1 ChemisorptionIn chemisorption, ions or molecules from solution undergo a chemical reaction with the s
1 1 Froth Flotation – Fundamental Principles Froth flotation is a highly versatile method for physically separating particles based on differences in the ability of air bubbles to selectively adhere to specific mineral surfaces in a