Transcription
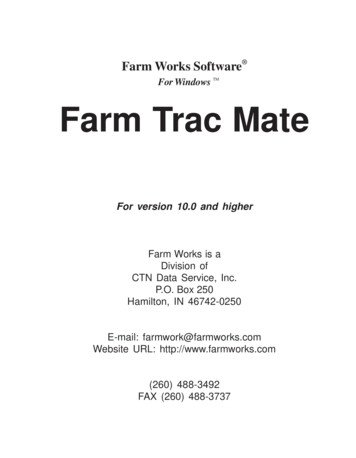
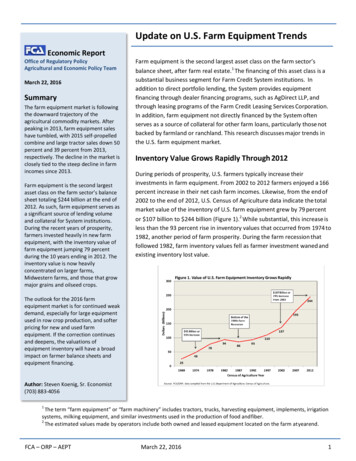
Update on U.S. Farm Equipment TrendsEconomic ReportOffice of Regulatory PolicyAgricultural and Economic Policy TeamMarch 22, 2016SummaryThe farm equipment market is followingthe downward trajectory of theagricultural commodity markets. Afterpeaking in 2013, farm equipment saleshave tumbled, with 2015 self-propelledcombine and large tractor sales down 50percent and 39 percent from 2013,respectively. The decline in the market isclosely tied to the steep decline in farmincomes since 2013.Farm equipment is the second largestasset class on the farm sector’s balancesheet totaling 244 billion at the end of2012. As such, farm equipment serves asa significant source of lending volumeand collateral for System institutions.During the recent years of prosperity,farmers invested heavily in new farmequipment, with the inventory value offarm equipment jumping 79 percentduring the 10 years ending in 2012. Theinventory value is now heavilyconcentrated on larger farms,Midwestern farms, and those that growmajor grains and oilseed crops.Farm equipment is the second largest asset class on the farm sector’sbalance sheet, after farm real estate.1 The financing of this asset class is asubstantial business segment for Farm Credit System institutions. Inaddition to direct portfolio lending, the System provides equipmentfinancing through dealer financing programs, such as AgDirect LLP, andthrough leasing programs of the Farm Credit Leasing Services Corporation.In addition, farm equipment not directly financed by the System oftenserves as a source of collateral for other farm loans, particularly those notbacked by farmland or ranchland. This research discusses major trends inthe U.S. farm equipment market.Inventory Value Grows Rapidly Through 2012During periods of prosperity, U.S. farmers typically increase theirinvestments in farm equipment. From 2002 to 2012 farmers enjoyed a 166percent increase in their net cash farm incomes. Likewise, from the end of2002 to the end of 2012, U.S. Census of Agriculture data indicate the totalmarket value of the inventory of U.S. farm equipment grew by 79 percentor 107 billion to 244 billion (Figure 1).2 While substantial, this increase isless than the 93 percent rise in inventory values that occurred from 1974 to1982, another period of farm prosperity. During the farm recession thatfollowed 1982, farm inventory values fell as farmer investment waned andexisting inventory lost value.The outlook for the 2016 farmequipment market is for continued weakdemand, especially for large equipmentused in row crop production, and softerpricing for new and used farmequipment. If the correction continuesand deepens, the valuations ofequipment inventory will have a broadimpact on farmer balance sheets andequipment financing.Author: Steven Koenig, Sr. Economist(703) 883-40561The term “farm equipment” or “farm machinery” includes tractors, trucks, harvesting equipment, implements, irrigationsystems, milking equipment, and similar investments used in the production of food and fiber.2The estimated values made by operators include both owned and leased equipment located on the farm at yearend.FCA – ORP – AEPTMarch 22, 20161
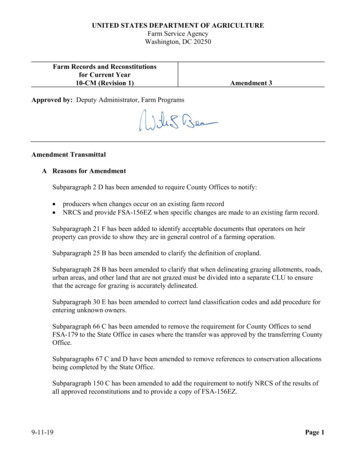
Inventory Value is Greatest on Grain and Oilseed FarmsAt the end of 2012, two-thirds of the 244 billion in equipment inventory was located on crop farms and onethird was located on livestock farms. Figure 2 shows that farms where grains and oilseeds are the primaryenterprises accounted for 46 percent of the total equipment value in 2012. Grain and oilseed farms have evenhigher shares of the inventory of higher powered farm tractors and self-propelled combines. At the end of2012, these farms accounted for 54 percent of all farm tractors with at least 100 horsepower and 75 percent ofall self-propelled combines. Therefore, much of the variability in the demand, supply, and values of farmequipment is tied closely to the economics of the major crop enterprises.Inventory is Geographically Concentrated in the MidwestAs expected from the predominate location of oilseed and grain farms, the total inventory value of farmequipment was concentrated in Midwestern States in 2012. Table 1 shows just over half of the total U.S.inventory value was in just 10 states. California is the only state in the top ten that is outside the Midwest.Iowa and Illinois, the two top corn and soybean producing states, together accounted for over 14 percent ofthe U.S. total. Seven of these top 10 states are within the AgriBank District. Moreover, the 15 states within theAgriBank District accounted for 56 percent of the total value of U.S. farm equipment.Table 1. Top 10 States by Value of Farm Equipment in 2012CumulativeShare of theTotal (%)StateDollar Amount (000)Cumulative DollarAmount 82,11697,802,54240.1NORTH 07,394243,966,685100.0All Other StatesSource: FCA-ORP compiled data from the 2012 Census of Agriculture.FCA – ORP – AEPTMarch 22, 20162
Large Farms Account for Most of the Total ValueGiven the structure of U.S. agriculture, the total value of U.S. farm equipment inventory primarily resides onfarms with large production volumes. Large farms, those farms with at least 500,000 in total farm sales,accounted for nearly half of the total 244 billion value at the end of 2012 (table 2). These 110,000 farmsaccounted for just 5 percent of the total 2.1 million U.S. farms in the Ag Census that year. Large farms haveaverage equipment inventories of nearly 1.1 million, which compares to just 63,000 for the other 2 millionU.S. farms.Not only is the majority of inventory value held on large farms, these farms also accounted for most of the 25percent growth ( 50 billion) in total inventory values that occurred between 2007 to 2012. Equipmentinventory on large farms rose 86 percent from 63.5 billion to 118 billion, whereas inventory value on allother farms actually fell 4 percent over those same five years. The extended period of higher-than-normalequipment investment and resultant upgrading of farm equipment is evident in the data. For example, theinventories of large tractors and combines less than 5 years old grew by 39 percent and 41 percent,respectively, from 2007 to 2012.Table 2. Farm Equipment Inventory Value is Concentrated on Large FarmsShare of TotalAverageInventory Inventory perValueFarm ( )NumberShare of AllFarmsDollar Value ofInventory (000)110,1765.2%118,360,07448.5%1,074,282Farms with less than 500,000 in farm sales1,998,33094.8%125,606,61451.5%62,856All U.S. Farms2,108,506100%243,966,688100%115,7062012 Ag CensusFarms with 500,000 ormore in farm salesSource: 2012 Census of Agriculture.Farm Equipment Sales Tumble after 2013The farm equipment market is dominated by a few full-line manufacturers, such as John Deere, but there arealso a large number of short-line manufacturers serving various market segments. Full-line manufacturersreported that 2014 and 2015 sales of equipment to row crop farms fell across North America, while sales tofarms in the livestock sector were more stable. For example, AGCO (Massey Ferguson Brand) reported inJanuary its farm equipment sales in North America for 2015 fell 16 percent from that of 2014.3 In January, CNHIndustrial (Case IH Brand) indicated that its 2015 North American sales declines were led by a 31 percentdecline in large tractors (over 140 horsepower) and a 28 percent decline in its combines.4 Weak sales carriedinto 2016, with John Deere reporting its worldwide agricultural equipment sales volume slumped 12 percent inits last fiscal quarter, which ended on January 31.5 Global manufacturers report that farm equipment sales arealso particularly weak in South America.3AGCO Fourth Quarter 2015 Earnings News Release (2/2/2016).CNH Industrial 2015 Fourth Quarter and Full 2015 Results Press Release (1/29/2016).5stJohn Deere January 31 2016 Quarterly Earning Media Release (2/19/2016).4FCA – ORP – AEPTMarch 22, 20163
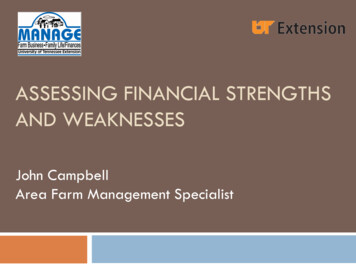
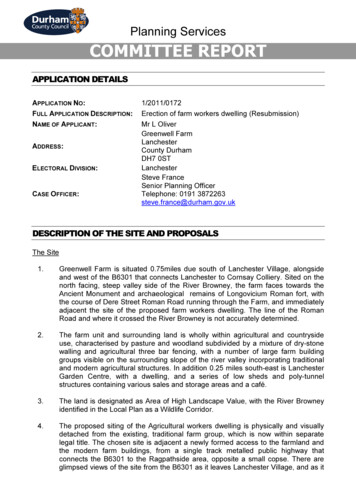
Large Equipment Sales TumbleData from the Association of Equipment Manufacturers provides more detailed information on U.S. farmtractor and self-propelled combine sales. Figure 3 shows the sharp decline in annual unit sales of larger rowcrop tractors (those with at least 100 horsepower motors) and self-propelled combine sales that occurred overthe last 2 years. The decline in self-propelled combines has been particularly steep, with 2015 sales just half ofthe 2013 peak and at the lowest level since 2003. For larger farm tractors, sales fell 39 percent over the past 2years. In general, tractor sales are considered a good barometer of other farm equipment sales by the industry.Large Equipment Sales Driven by Farm IncomesThe long rise of sales from the mid-2000s to 2013 was influenced by a number of factors, including strong farmincomes, federal tax incentives that encourage capital investment, low capitalization rates (low interest rates),and abundant credit. Yet, the biggest driving factor in the rise and the recent collapse in farm equipmentinvestments is farm profitability. Figure 4 shows how sales of large farm equipment closely track changes innet cash farm incomes.FCA – ORP – AEPTMarch 22, 20164
Small Equipment Sales Are More Dependent on the Nonfarm EconomySales geared for small scale farms and the country living segments of the market are more dependent on thelevel of off-farm incomes than the level of farm incomes. This can be seen in the sales of small tractors (40 and100 horsepower) over the last 25 years. Notice in figure 5 that small farm tractor sales plunged nearly 40percent from the start of the last recession in 2008 to a bottom in 2010. This was also a period of poorerreturns for livestock producers, which are also a significant demand source for this segment.New Farm Equipment Prices Show Strength at End of 2015Despite declining sales over the past 2 years, a USDA index of prices paid by farmers for new farm equipmentindicates that equipment prices actually rose through 2015. Figure 6 shows prices rose 85 percent from 2003to 2015 or about 5 percent annually. It also shows that the rise is generally consistent, although less volatile,with an index of commodity prices received by farmers over the same period. In times of weakening demand,manufacturers generally resist cutting prices on new equipment due to fears it will undercut margins and hurtequipment trade-in values. Thus, at least initially, they may try to boost sales with various marketing andfinancing incentive programs as opposed to heavily discounting prices.FCA – ORP – AEPTMarch 22, 20165
The relatively steady rise in new equipment prices is most apparent in the prices paid by farmers for largetractors and self-propelled combines (figure 7). The percentage rise in large tractor prices is in line withincreases experienced for farm equipment in general. However, large 4-wheel drive tractors typically used bylarge grain and oilseed farms saw somewhat greater price increases, rising 75 percent since 2003. New selfpropelled combines nearly doubled in price since 2003, a cyclical low in the sales of this equipment, with thevery largest class reaching 450,000 by 2014 (most currently available data).Per Acre Costs of Farm Equipment Begins to DeclineGrowth in new farm equipment prices and purchase volumes, especially since 2003, has translated into risingproduction costs for producers. When farm equipment is purchased it becomes part of the fixed cost oroverhead of the farm business. This is illustrated in Figure 8 which shows the estimated per acre costs of farmequipment used to grow corn and soybeans in Iowa from 1995 to 2015. The figure shows per acre equipmentcosts used to grow corn or soybeans nearly doubled between 2003 and 2014. This is consistent with the neardoubling of equipment values typically used by larger scale producers. But, note that costs began declining in2015 as machinery depreciation and less investment began to occur.FCA – ORP – AEPTMarch 22, 20166
Industry Outlook Remains WeakMost industry observers anticipate continued weakness in the farm equipment market during 2016, particularlyfor equipment used in row crop production. In February, John Deere, the global leader in farm equipmentmanufacturing, forecasted industry sales in the U.S. and Canada to be down 15 to 20 percent in 2016. JohnDeere indicated that the decline reflects the impact of low commodity prices and stagnant farm incomes, whichthey anticipate will impact sales of higher-horsepower tractors the most. AGCO forecasts call for a 10 to 15percent decline in North American non-compact farm tractor sales.Along with the decline in new sales has been a slide in used equipment sales, a buildup of equipmentinventories, and weaker used machinery prices. Like the new equipment market, high-valued used farmequipment has seen greater declines in sales and in pricing than equipment geared for hobby farmers orcountry living market segments. Weaker farmer demand for used row crop equipment is expected in 2016.Lender Surveys Confirm a Weak Capital Spending OutlookOutside the manufacturing industry, further weakness in the machinery market for 2016 appears in a Januarysurvey of farm bankers within the Chicago Federal Reserve Bank District.6 Farm bankers expect a downwardtrend for capital spending by farmers in 2016, including spending on machinery and equipment. As a result,they expect loan volumes for capital purchases in the first quarter of 2016 to be down compared with a yearearlier. Moreover, a survey of Midwestern bank CEOs conducted by Creighton University continues to showweakness in the farm equipment market.7 In February this Creighton University farm equipment-sales indexsank to a record low of 6.7. Three years prior the index stood at nearly 65. Values below 50 in the indexindicate negative growth is occurring.Inventory Adjustments Are UnderwayMarket observers anticipate more public auctions of farm equipment are likely for 2016. One factor driving thismay be older farmers who had delayed retirement during the extended period of good profits but are nowmoving into retirement. Also, with increasing financial pressures, more farms may move to trim costs andreduce associated debt burdens by selling equipment. While such actions may boost balance sheet liquidityand lower costs, the additional supply would be expected to lower used equipment prices. Some producersmight be able to trim costs by leasing needed equipment rather than buying. Indeed, during the past yearmany manufacturers have been using leasing programs as an alternative to their financing programs as a wayto move equipment out of inventory.In past years, export markets have provided an outlet for some segments of good quality used U.S. farmequipment and thus help prevent a buildup of inventories. This is currently not much of an option. Lowworldwide crop prices coupled with the high value of the U.S. dollar have reduced export demand for bothnew and used farm equipment. In addition, equipment with new Tier 4 low emission engines now required inthe United States have minimal demand in countries where these standards are not required.Favorable Tax Rules PassedIn 2002 Congress made a series of changes to income tax deduction provisions (both new and used purchases)under Section 179 of the U.S. Tax Code and introduced a bonus depreciation allowance for qualified new67Federal Reserve Bank of Chicago, AgLetter, No. 1971 (February 2016).Creighton University, The Mainstreet Economy Report (March 2016).FCA – ORP – AEPTMarch 22, 20167
property that was placed into service by businesses, including farm business.8 Use of the provisions can reducetaxable income in the year of purchase and hence lower tax liabilities. Therefore, these tax rules encouragecapital investments by producers facing significant income tax liabilities. These tax provisions were a significantfactor in influencing equipment purchases during the years of heightened row crop profitability prior to 2014.Since first introduced, Section 179 and the bonus depreciation provisions were temporary rules that requiredfrequent reauthorization by Congress. In many years the reauthorization came late within the tax year andmade retroactively. In late December 2015, Congress passed the Power of Protecting Americans from TaxHikes Act of 2015, making Section 179 provisions permanent and extending the bonus depreciation provisionsthrough 2019. The new Section 179 provision allows a first-year depreciation deduction of up to 500,000,which begins to phase out as annual asset purchases exceed 2 million. The thresholds are inflation adjustedfor the first time. A 50 percent bonus provision was authorized through 2017 with a 40 percent amount for2018 and 30 percent for 2019.Rising Interest Rates Going ForwardFarm equipment values are affected by interest rates through increased financing costs and the opportunitycost of capital. Historically low interest rates since 2008 have reduced the cost of ownership of capital assetsand hence bolstered both purchase demand and values. A significant uptick in interest rates would have anopposite effect on equipment demand and valuations. The Federal Reserve made the first step in raisinginterest rates last December after holding rates constant for 7 years. If U.S. economic growth and inflationaccelerate, further rate increases are more likely to occur.ConclusionsFarm equipment financing and leasing is a substantial business segment for FCS institutions and is often aprimary source of collateral for agricultural loans. Farmer purchases of farm equipment, along with the valueof equipment inventory, rose rapidly for an extended period beginning in the mid-2000s, encouraged by heftyfarm profits, historically low interest rates, ample credit, and tax policies.After peaking in 2013, farm equipment markets began to retract in 2014 as farm income dropped sharply. Likethe farmland market, farm equipment markets are in a period of correction. The correction is being drivenprimarily by a large decline in farm earnings (particularly for crop producers). The outlook for the 2016 farmequipment market is for continued weak demand, especially for large equipment used in row crop production,and softer pricing for new and used farm equipment. If the correction continues and deepens, futurevaluations of equipment will have a broad impact on farmer balance sheets and the financing of farmequipment.8For agriculture, qualified property includes farm machinery, specialized ag buildings, grain storage bins, farm drainagesystems, fencing, certain livestock, and other similar assets.FCA – ORP – AEPTMarch 22, 20168
The farm equipment market is dominated by a few full-line manufacturers, such as John Deere, but there are also a large number of short-line manufacturers serving various market segments. Full-line manufacturers reported that 2014 and 2015 sales of equipment to row crop farms fell across North America, while salesto