Transcription
Tech ClustersWilliam R. KerrFrederic Robert-NicoudWorking Paper 20-063
Tech ClustersWilliam R. KerrHarvard Business SchoolFrederic Robert-NicoudUniversity of GenevaWorking Paper 20-063Copyright 2019, 2020 by William R. Kerr and Frederic Robert-Nicoud.Working papers are in draft form. This working paper is distributed for purposes of comment and discussion only. It maynot be reproduced without permission of the copyright holder. Copies of working papers are available from the author.Funding for this research was provided in part by Harvard Business School.
Tech ClustersWilliam R. Kerr and Frederic Robert-NicoudWilliam R. Kerr is the Dimitri V. D'Arbeloff—MBA Class of 1955 Professor of BusinessAdministration, Harvard Business School, Boston, Massachusetts and Research Associate,National Bureau of Economic Research, Cambridge, Massachusetts. Frederic Robert-Nicoud isProfessor of Economics, Geneva School of Economics and Management (GSEM), University ofGeneva, Geneva, Switzerland, and Research Fellow, Centre for Economic Policy Research,London, United Kingdom. Kerr is the corresponding author at wkerr@hbs.edu.Keywords: clusters, agglomeration, innovation, entrepreneurship, patents.Abstract: Tech clusters like Silicon Valley play a central role for modern innovation, businesscompetitiveness, and economic performance. This paper reviews what constitutes a tech cluster,how they function internally, and the degree to which policy makers can purposefully foster them.We describe the growing influence of advanced technologies for businesses outside of traditionaltech fields, the strains and backlash that tech clusters are experiencing, and emerging researchquestions for theory and empirical work.The authors thank Harald Bathelt, Neil Coe, Ed Glaeser, Gordon Hanson, Enrico Moretti, RamanaNanda, Will Strange, Timothy Taylor, and Heidi Williams for their insightful thoughts, comments,or feedback on this paper. The authors also thank Brad Chattergoon, Maggie Dalton, BradDeSanctis, and Louis Maiden for excellent research assistance.1
While Silicon Valley houses less than 0.1 percent of the world’s population, its shadow loomslarge. Many cities aspire to be a tech cluster: for example, an astounding 238 US cities jumpedthrough hoops in 2017-18 to enter Amazon’s infamous “bidding” process for where it wouldestablish a second headquarters. Wikipedia lists more than 25 efforts to brand a US location as“Silicon Something,” along with many foreign ones (at https://en.wikipedia.org/wiki/List oftechnology centers#United States). Our personal favorite names are Silicon Peach (Atlanta) andSilicon Spuds (Idaho), whereas Silicon Prairie has at least four contenders. Other US examplesinclude Silicon Anchor, Basin, Desert, Forest, Hill, Holler, Mountain, Shire and Surf.This paper examines the tech cluster phenomenon by considering three only partially answeredquestions. We first ask how we might define a tech cluster—that is, what properties are requiredto be a tech cluster? This delineation is harder than it first looks and raises some key questionsand issues. We start with the scale and density of local activity and then extend into the frontiernature of the work being undertaken and its ability to impact multiple sectors of the economy.We illustrate our definition through some common metrics like patents, venture capital funding,and employment in R&D intensive sectors or digital-connected occupations. We also note someinteresting clues from emerging metrics (e.g., high-growth entrepreneurship, artificialintelligence researchers) and recent efforts to measure tech clusters globally.We then ask how tech clusters function, with a focus on traits that extend beyond thoseassociated with traditional industrial clusters. Not surprisingly, knowledge spillovers are apowerful force in tech clusters, and recent work explores how knowledge transmits across firmssituated in a tech cluster and how density impacts the types of innovations created. Tech clustersfacilitate powerful scaling for the best designs when they combine modular product structureswith high-velocity labor markets. Universities, high-skilled immigration, and global productionlinkages also feature prominently in the functioning of leading US centers.Finally, we turn to the roots of tech clusters and inquire into the mix of initial ingredientsrequired for their formation. Leading tech clusters are far from permanent and have frequentlyemerged in new places following the advent of new general purpose technologies. Today, therapid growth of Toronto as an artificial intelligence cluster suggests that there may be limits ofSilicon Valley’s grip on this frontier. Yet, despite the government having played an importantrole in this history of many tech clusters, top-down attempts to re-create Silicon Valley havemostly failed (Lerner 2009). Our historical examples suggest that local officials may insteadwant to facilitate the scaling of nascent industries that have taken root, even if due to randomchance, rather than attempt to engineer a cluster from scratch.We conclude with some thoughts on future research opportunities, including the question ofwhether tech clusters are at their high-water mark or are likely to strengthen further. Theimplications of the ongoing COVID-19 crisis for tech clusters could be profound. Our discussionfocuses primarily on the US economy, but much of what we describe applies to other countriesas well. We ground our discussion firmly within the economics and management disciplines,occasionally reaching out in incomplete ways to other social sciences as we go.2
Defining Tech ClustersWhile it is easy to point to high profile examples of tech clusters, such as Seattle or Austin,developing even a semi-formal definition is tricky. “Clusters” traditionally indicate an importantoverall scale of local activity, complemented by spatial density and linkages among local firms(e.g., Marshall 1890, Porter 1998). As discussed further below, the specific linked activities fortech clusters might include engineer mobility across employers, flows of technical knowledge,and reliance on shared local inputs like a research university. In addition to these traditionaldimensions, we define “tech” clusters to be locations where new products (be they goods orservices) and production processes are created that impact multiple parts of the economy. That is,a tech cluster must have a frontier edge to it, and it must extend beyond refinements to a singleindustry.These criteria suggest that tech clusters are not a new phenomenon nor a permanent fixture. USeconomic history shows a continual movement of leading tech centers: for example, Lowell,Massachusetts, for textile mills reliant on water power in the 1800s; Cleveland, Ohio, forelectricity and then steel in the early 1900s; and Detroit, Michigan, for automobiles in the earlymid 1900s (Lee and Nicholas 2012; Lamoreaux et al. 2004). Our definition puts early 19thcentury technology advances for engines in Detroit on par with the cluster of artificialintelligence firms in the Toronto area today, which seems conceptually useful.An historical perspective also suggests that tech clusters may cease to be. For example, Detroitwas the Silicon Valley of the first half of the 20th century. At some point, the auto industrymatured and Detroit with it, and we would have taken away Detroit’s tech cluster badge. ShouldDetroit’s mojo return with electric or autonomous vehicles, perhaps in 2030 we will declareDetroit a tech cluster again. Over its relatively short history, Silicon Valley has also experienceddoldrums after technology waves crested before the next major path emerged.Our definition also suggests drawing a line between specific industries which make heavy use oftechnology (which include traditional industrial districts), and a true tech cluster with a broaderimpact across the economy. For example, should Wall Street and the surrounding area of lowerManhattan be considered a tech cluster? After all, Goldman Sachs in 2020 employs moreengineers than the total combined workforces of LinkedIn and Twitter. The iconic bank has evenbeen recently shedding traditional practices like dress codes to attract technical workers. Frontierquantitative hedge funds are at the bleeding edge of artificial intelligence, and fintech advancesmay reshape commerce. So maybe the Wall Street of the 1980s was not a tech cluster, but theWall Street of 2030 might be. Using the framework of Duranton and Puga (2005), perhaps WallStreet is evolving from being a cluster specialized in a sector—financial services—into a clusterspecializing in a function—(fin)tech?These definitional challenges reflect how advanced technology and its leading firms are enteringmany parts of the economy in a variety of ways. Technology is becoming less of a segmentedindustry—for example, less focused on manufacturers of personal computers or shrink-wrappedsoftware—and more ubiquitous and general purpose. There also exists a blurring of industryboundaries, especially as incumbent firms seek to move out of stagnating industries and towardsnew profitable opportunities. As robotics and cognitive automation advance, this ambiguity will3
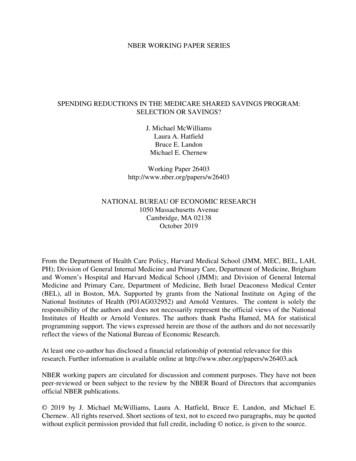
grow. Technology is becoming so pervasive that one can be tempted to resort to phrasings like“talent clusters” to focus on frontier activity by sector in human-capital focused industries (forexample, Kerr 2019).Data to Measure US Tech ClustersEmpirically studying tech clusters requires making choices about what to measure and theappropriate scale of activity. Most analyses use patents, high-growth entrepreneurship supportedby venture capital firms, and/or employment in R&D-intensive industries or occupations. Inchoosing a geographic unit, most empirical analyses of the US economy analyze the fulldistribution of states or cities, which is helpful for getting a workable sample size (for example,Acs et al., 2002; Delgado et al. 2010; Glaeser et al. 2015). An alternative method is to conductcase studies or sub-city empirical analyses of a recognized tech cluster like Silicon Valley (forexample, Saxenian 1994, Kenny 2000, Bresnahan and Gambardella 2001). These choices shouldfollow the type of economic linkage under study: for example, focusing on very short-distanceknowledge spillovers in the area around Kendall Square near MIT vs. the labor mobility ofengineers across the entire Boston metropolitan area.Patents and venture capital data are popular with researchers due to the existence of detailedmicro-data regarding individual inventions and funding transactions. Thus, in addition tomeasuring spatial concentration, researchers can use the same data to learn how the clustersoperate by, for example, following the careers of inventors or entrepreneurs over time, modelinglocal networks and spillovers, etc. These data also offer a foothold for assessing whether theinnovative work of the city touches multiple aspects of the economy. The central liability withboth approaches is that many forms of innovative activity are not captured; moreover, theintellectual property and financing environment changes over time (e.g., greater recognition ofsoftware or business method patents). Researchers must carefully consider limits tocomparability across industries (and therefore across cities, too) and longitudinally (see literaturein Feldman and Kogler 2010 and Carlino and Kerr 2015).With some exceptions, such as Carrincazeaux et al. (2001) and Carlino et al. (2012), locationspecific R&D data are difficult to acquire. Industry- and occupation-level employment data offeranother tactic. As an example, we use below micro-data from the 2014-2018 AmericanCommunity Survey that records for individuals their metropolitan area, industry of employment,salary, education level, and so forth. We map R&D intensity by industry, as documented by theNational Science Foundation (2017), to measure how much of a city’s employment base is inR&D-intensive fields. This approach avoids some of the liabilities noted for patenting andventure data but also sacrifices many of the advantages that micro-data provided.Table 1 documents several measures for cities using data from around 2015-2018 (the notes tothe table provide details on sources and preparation). We list the top 15 MSAs in terms ofventure capital investment, in descending rank, and then provide two aggregate categories for theother 266 MSAs and for rural areas. In this table and the figures to follow, we use consolidatedMSAs, such that the San Francisco/San Jose/Oakland area is just referred to as San Francisco.4
Table 1: Spatial concentration of US tech activityEmploymentin computerEmployment Employmentand digitalin top 10 R&D in top 20 R&D connectedindustries,industries, all entin STEMconnectedoccupations,all tents(1)(2)(3)(4)(5)(6)(7)San Francisco48.1%18.4%11.7%4.9%8.6%5.5%2.5%New 5%2.4%3.4%2.7%1.6%Los 4.2%2.4%3.5%2.5%1.2%San 2%3.2%3.9%3.2%2.9%Washington 3%1.7%Minneapolis-St. 1.4%1.7%0.8%1.2%1.0%0.5%Share in top 15 VC MSAsShare in other .8%41.2%47.9%31.3%48.0%Share in non-metro 730.660.310.930.670.710.650.32Consolidated metro areaCorrelation to VC shareCorrelation to patent share0.98Notes: Table lists the top 15 (consolidated) MSAs in terms of venture capital investment in descending rank.Venture capital investments are for 2015-2018 based upon location of new investments in ventures and are takenfrom Thomson One. Patents are for 2015-2018 based upon the most frequent location of inventors and applicationdate of utility patents and are taken from patents granted by the USPTO through end of 2019. Employment columnsare for 2014-2018 using the combined American Community Survey 1% files. ACS sample includes those aged 1865 who are working and with positive wage earnings, not in group quarters, with usual hours worked greater than 30per week, and with usual weeks worked per year greater than 40. High-skilled workers are those with collegedegrees or higher in education and earning 50,000 or more. The 10 industries with the highest R&D per worker aslisted by NSF (2017) are Software publishers; Pharmaceuticals and medicines; Other computer and electronicproducts; Data processing, hosting, and related services; Communications equipment; Semiconductor and otherelectronic components; Navigational, measuring, electromedical, and control instruments; Pesticide, fertilizer, andother agricultural chemicals; Aerospace products and parts; Scientific research and development services. Theseindustries in some cases map into more than one NAICS industry in the ACS for employment data. Population dataare 2015-2018 based upon counties that comprise MSAs and are taken from the Census Bureau. There are 281MSAs identified in the venture capital, patent, and population data and 261 identified in the ACS data. Populationdistributions in the ACS are very similar, with the one noticeable difference of LA being a 4.2% share.This table speaks best to the scale of tech activity across cities and, through a comparison to thepopulation share in Column 7, the implied density of tech efforts. The top 15 MSAs as ranked byventure capital investment hold 94 percent of venture capital activity in Column 1 and 57 percentof patenting in Column 2, compared to just 31 percent of population. If we instead rank onpatents, Detroit, Portland, Dallas-Ft. Worth, and Houston feature in the 15 largest centers, withWashington, Miami, Atlanta, and Raleigh-Durham dropping out. Either way, patenting and5
especially venture capital investment are under-represented outside of leading tech centers.Looking across MSAs listed in Table 1, shares for venture capital and patent have a 0.98correlation, while shares for venture capital and population have a 0.31 correlation.Columns 3 and 4 of Table 1 next provide two measures of local employment in leadingindustries for R&D investment as measured by National Science Foundation (2017). We firstshow a restrictive definition, where we identify college-educated workers earning more than 50,000 (short-hand labelled as “high-skilled”) and working in a top 10 R&D-intensive sector—11.7% of such individuals work in the San Francisco area, compared to 5.9% of them beingoutside metropolitan areas. The second measure broadens to any full-time employee (noeducation or salary restriction) among the 20 most R&D-intensive sectors. This makes anoticeable difference, with San Francisco’s share now 4.9% and much smaller than the 14.8% innon-metro locations. Column 5 similarly looks at high-skilled workers in occupations incomputer- and digital-connected work, and Column 6 expands to all full-time workers in abroader class of STEM-connected occupations.This table shows the potential and challenges of defining tech clusters using the scale and densityof local tech activity. Six cities appear to qualify under any aggregation scheme: San Francisco,Boston, Seattle, San Diego, Denver, and Austin all rank among top 15 locations for venturecapital and for patents (scale) and hold shares for venture capital, patents, employment in R&Dintensive sectors, and employment in digital-connected occupations that exceed their populationshares (density). They also pass the highly rigorous “sniff test” that they make sense!Washington, Minneapolis-St. Paul, and Raleigh-Durham would join the list if relaxing theexpectation that that share of venture investment exceed population share (which is hard due tothe very high concentration in San Francisco).New York and Los Angeles are more ambiguous: they hold large venture capital markets (andventure investors frequently declare them leading tech clusters), but their patents andemployment shares in key industries and fields are somewhat less than their population shares.Were we to disaggregate these huge metro areas, we would likely identify a sub-region thatwould independently make this short list by still holding sufficient scale and yet having moreachieved a more recognizable density. Said differently, there is surely a part of New York andLA that would be stand-alone equal to or greater than Austin (e.g., Egan et al. 2017). Chicago’sactivity is mostly equal to its population share or less.At the other end of the city size distribution, it is hard to be a robust-yet-small tech cluster onboth venture investment and patent metrics due to the concentration of innovation. If one onlyrequires that a tech cluster achieve a venture capital and patent share that is 1.5x the localpopulation share, the one new city would be Provo, UT, with Denver dropping out. In summary,San Francisco and Boston are extreme cases, and we are probably looking at 5-10 additionalleading centers across the country depending upon definition of scale and density.At the start of this section, we conceptualized tech clusters as being positioned in frontier sectorsand having a broad-based impact. Patents provide a preliminary example of these traits. We firstconsider new technology areas by isolating patent technology classes that the USPTO introducedin 1995 and afterwards. On average, cities have 7.8 percent of their patents during 2015-2018 in6
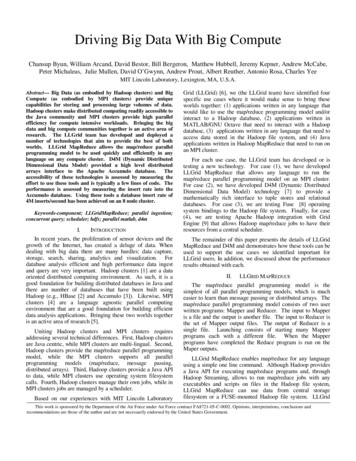
the newest classes, while the average for San Francisco, Boston, Seattle, San Diego, Denver, andAustin is 27.8 percent. When looking at patent classes introduced after 1980, these shares are29.8 percent and 60.2 percent, respectively. Patents in these six cities also display higher forwardand backward citations, with a greater measure of generality to the work (Hall et al. 2001). Wereturn below to recent research describing differences in the type of innovation across clusters.How is this picture changing over time? For the most part, the rich are getting richer. Figure 1shows city patenting (presented in annual terms) from 1975-1980 to 2013-2018. The axes are inlog format and a 45-degree line is included. There has been an overall increase in patent grantssince the late 1970s, visible in the figure with more cities being above the 45-degree line thanbelow. Cities that are farthest above the 45-degree line have the biggest percentage gains, andbig patenting centers in the late 1970s show the most consistent increases. Consequentially, anEllison and Glaeser (1997) index of patenting concentration relative to population distributiongrows over ten-fold from an index value of 0.002 in the late 1970s to 0.028 in 2018.Figure 1: Growth in Annual Patenting by Metropolitan Statistical AreaNotes: Figure presents for metropolitan areas the average annual patent count for 1975-1980 and 2013-2018. Patentsare grouped by application year and all patents granted by the USPTO through end of 2019 are used. Axes are in logformat and a 45-degree line is included. Some cities are labelled for illustrative purposes only.Researchers have recently developed new empirical methods to measure tech clusters, as well.One approach focuses on measuring high-growth entrepreneurship independent of venturecapital data. Guzman and Stern (2019) use state-level business registration data and developtechniques to identify whether new firms are targeting rapid growth, such as how the venture isnamed (e.g., Infinity Global Technologies vs. Fred’s Bicycle Repair) and its legal form ofincorporation. The most intense areas for entrepreneurial potential are places like Silicon Valley,Boston, and Austin, where they also measure booms in local high-growth activity through 2019.7
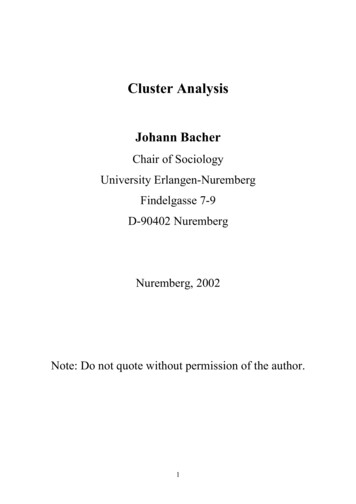
In another approach, using LinkedIn data on employment, Gagne (2019) estimates that morethan a third of artificial intelligence researchers are located in the San Francisco Bay Area—afact due in part to the presence of tech giants like Microsoft, IBM, and Google in that area.Global Tech ClustersAn emerging frontier is to map out global tech clusters. This combination of data across bordersgets complicated fast, and Table 2 shows metrics do not always point in the same way. Forventure capital investment, the last decade shows the remarkable rise of Chinese tech clusters.The top 10 global cities include Beijing, Shanghai and Shenzhen, plus London, in addition to sixcities from the United States. Looking instead at the post 2009 formation of unicorn start-ups(valued at 1 billion or more), the four non-US cities are similarly Beijing, Shanghai, andHangzhou, plus London (Kerr 2018).Table 2: Global Tech Clusters as Measured by Total SizeVenture Capital Investment(Thomson One, 2009-2018)San FranciscoBeijingShanghaiNew YorkBostonLos AngelesLondonShenzhenSan DiegoSeattleUnicorn Startup Companies(CB Insights, 2009-2018)San FranciscoBeijingNew YorkLos atent Cooperation Treaty Filings(WIPO, 2010-2015)Tokyo-YokohamaShenzhen-Hong KongSan FranciscoSeoulOsaka-Kobe-KyotoSan DiegoBeijingBostonNagoyaParisNotes: Table lists the 10 largest global tech clusters in terms of various metrics in descending rank. Venture capitalinvestments are for 2009-2018 based upon location of new investments in ventures and are taken from ThomsonOne. Unicorn startup companies are counts of new ventures exceeding a billion dollars in valuation during 20092018 and are taken from CB Insights. Patent Cooperation Treaty filings are for 2010-2015 and are taken from theWorld Intellectual Property Organization. Geographic boundaries of clusters are defined by each data source anddiffer to some extent across columns.While measures of tech clusters using venture capital and patents provide mostly similar picturesacross US cities, globally this is not the case. In a World Intellectual Property Organizationreport (Bergquist et al. 2017) that aggregates over many patent offices, Tokyo-Yokohama holdstwice the patent count to second place, Shenzhen-Hong Kong; the San Francisco Bay Area isthird and Seoul is fourth. Moreover, the top 10 cities span three in Japan, three in America, twoin China, and one each in Korea and France. For more specific frontiers like research in artificialintelligence, the leading roles of America and China are clear, but relative shares dependsubstantially on the yardstick employed and data source.Building a stronger foundation for these comparisons is an important ongoing task. So far, weare only tackling the scale of local tech activity, but not the extra nuances about density, frontierstatus, and so forth. International settings also raise the interesting question of whether measures8
of a tech center should be context specific. Many speak of Bangalore as a “tech cluster,” butwhile it is technologically advanced when compared to other locations in India, much of itsactivity is substantially lower tech and labor intensive relative to tech clusters in advancedeconomies.Is a Tech Cluster Different from Other Clusters?Industry clusters arise due to the production advantages of local specialization combined withsubsequent trade across locations. Marshall (1890) famously described three forces of what wenow call agglomeration economies: knowledge spillovers, labor market pooling, and customersupplier interactions. Economic research over the last two decades has shown all three forces,along with natural advantages of areas for certain industries (e.g., harbors, coal mines), areimportant for explaining industrial clusters, with the most recent research quantifying theheterogeneity across industries and co-agglomeration dynamics over time (for example, Ellisonet al. 2010; Faggio et al. 2017). While most studies of the Marshallian forces have focused onindustrial settings, they also apply to tech clusters, if often in distinctive ways.1Knowledge Spillovers and Forms of InnovationOur definition of tech clusters emphasized settings with a frontier edge, and many companiesseek insights on emerging possibilities, either through first access to codified knowledge or totacit knowledge that cannot be so easily written down. Marshall famously described knowledgediffusion inside an industrial cluster in poetic terms: “The mysteries of the trade become nomysteries; but are as it were in the air, and children learn many of them unconsciously.”Researchers have since catalogued these knowledge transfers in many settings, such asSwitzerland’s watchmaking industry, and they appear particularly important for tech clusters(Audretsch and Feldman, 1996). Olson and Olson (2003) document very tight bands forcollaborative interactions. In an ethnographic study of Silicon Valley, Saxenian (1994, p. 33)describes many formal and informal channels facilitating knowledge transfer, including adepiction of Wagon Wheel, a Mountain View bar that novelist Tom Wolfe dubbed the“fountainhead of the semiconductor industry”:[M]embers of an ‘esoteric fraternity’—the young men and women of the semiconductorindustry—would head after work to have a drink and gossip and brag and trade warstories about phase jitters, phantom circuits, bubble memories, pulse trains, bouncelesscontracts, burst modes, leapfrog tests, p‐n junctions, sleeping sickness modes, slow‐deathepisodes, RAMs, NAKs, MOSes, PCMs, PROMs, PROM blowers, PROM blasters, andteramagnitudes, meaning multiples of a million millions.More recently, then-CEO Jeff Immelt described in 2016 why General Electric was moving itsheadquarters from Fairfield, Connecticut, to Boston: “To look out the window [in Connecticut]Duranton and Puga (2004) recast Marshall’s forces to emphasize higher-order functions like sharing and matchingthat occur within clusters. See Markusen (1996) and Porter (1998) for complementary approaches.19
and see deer running across, I don't care about that. I want some 29-year-old [graduate of] MITto punch me right in the nose and say all of GE's technologies are wrong and you're about tolose. That's the challenge.” (as reported in Singer 2016; Kerr 2018 discusses the subsequent upsand downs of General Electric’s move).More formally, economists since Jaffe et al. (1993) have most frequently used patent citations toquantify the higher rate of knowledge flow within cities versus across them (for example, seeMurata et al. 2014, and the references cited therein). The use of patent citations is only animperfect proxy for knoweldge flows (e.g., Jaffe et al. 2000), and many of the capturedinformation flows are due to inventor networks, licensing agreements, and so forth (e.g.,Almeida and Kogut 1999; Breschi and Lissoni 2009). These citation metrics thus aggregateunpriced knowledge spillovers that are “in the air” alongside regular forms of economic activity.Citation patterns have been confirmed with co-authorship networks among inventors, andFleming and Marx (2006) identify that leading tech clusters became more connected during the1990s.Recent applications focus on using patent data to open the black box of how clusters operate.Kerr and Kominers (2015) model localized spillovers within tech clusters. Firms interact withtheir closest neighbors, but the costs of interaction prevent direct spillover benefits from moredistant members of the cluster. For example, a firm in Oakland may have useful information fora startup in East Palo Alto, but the search and acquisition costs for that information prevent itfrom diffusing directly, requiring instead indirect transfer via other firms. These conditions leadto overlapping zones of interaction, such that nearby interactions are direct, while those fartheraway happen through the underlying network of the cluster. (Ar
Over its relatively short history, Silicon Valley has also experienced doldrums after technology waves crested before the next major path emerged. Our definition also suggests drawing a line between specific industries which make heavy use of technology (which include traditional industrial districts), and a true tech cluster with a broader .