Transcription
Foundation Design Principles and Practices 3rd Edition Coduto Solutions ManualFull Download: ions-manualChap. 2Uncertainty and Risk in Foundation Design2.1Classify the uncertainty associated with following items as either aleatory or epistemic andexplain your reason for your classification: average wind speed over a 30 day period, location ofa certain applied load, change in strength of a soil caused by sampling method, capacitydetermined by a certain analysis method, magnitude of live load caused by vehicles travelling ona bridge, soil shear strength as measured by a certain method.Solution Uncertainty of the average wind speed is aleatory. This is a random process that wecannot affect. Uncertainty of location of an applied load is mostly aleatory. There is a certain accuracywith which a structure can be built and the designer had little or no control over thisaccuracy. In theory there is some epistemic uncertainty in that could be reduced withbetter construction techniques, but from a practical standpoint this uncertainty is aleatory. Uncertainty in the change in strength of a soil caused by sampling method is an epistemicuncertainty. Improved sampling techniques can reduce this uncertainty. Uncertainty in the capacity determined by a certain design method is generally epistemic.With improved analytical tools we can reduce this uncertainty. Uncertainty in magnitude of live load caused by vehicles travelling on a bridge isinherently aleatory. This is a random process which we cannot affect. The uncertainty in the soil shear strength as measured by a certain method is acombination of epistemic and aleatory uncertainty. The uncertainty caused by the qualityof the equipment used and the care of the technician making the measurement isepistemic and can be reduced by the use of more precise equipment and better training ofthe technician. However, there is aleatory uncertainty in the soil strength inherent in thenatural processes that created the soil.Solutions ManualFoundation Engineering: Principles and Practices, 3rd Ed2-1 2016 Pearson Education, Inc., Upper Saddle River, NJ. All rights reserved. This publication is protected by Copyright and written permission should be obtained fromthe publisher prior to any prohibited reproduction, storage in a retrieval system, or transmission in any form or by any means, electronic, mechanical, photocopying,FulldownloadallForchaptersplease go toSolutionsManual,TestBank site:testbanklive.comrecording,or likewise.informationinstantlyregarding permission(s),writeto: Rights andPermissionsDepartment,PearsonEducation, Inc., Upper Saddle River, NJ 07458.
Chap. 22.2Uncertainty and Risk in Foundation DesignFigure 2.1 shows the PDF for a normal distribution determined from the unconfined compressiontests shown in the histogram. Does the mean and standard deviation of this PDF representaleatory or epistemic uncertainty? Explain.SolutionThe mean and standard deviation of this PDF contain both aleatory and epistemic uncertainty.The mean of 20.8 and standard deviation of 7.30 are estimate valued of the true mean andstandard deviation of the unconfined compressive strength of this sandstone. The epistemicuncertainty is associated with the number of samples used to estimate the parameters. If we hadtaken more samples, we would have better estimates. However, this particular sample obviouslycontains a large number of measurements. Therefore the estimated standard deviation isprobably very close to the aleatory uncertainty and testing more specimens is unlike to reducethe uncertainty significantly.Solutions ManualFoundation Engineering: Principles and Practices, 3rd Ed2-2 2016 Pearson Education, Inc., Upper Saddle River, NJ. All rights reserved. This publication is protected by Copyright and written permission should be obtained fromthe publisher prior to any prohibited reproduction, storage in a retrieval system, or transmission in any form or by any means, electronic, mechanical, photocopying,recording, or likewise. For information regarding permission(s), write to: Rights and Permissions Department, Pearson Education, Inc., Upper Saddle River, NJ 07458.
Chap. 22.3Uncertainty and Risk in Foundation DesignList three sources of epistemic uncertainty associated with determining the soil strength at agiven site and describe how you might reduce these uncertainties.SolutionSourceSmall sample sizeSloppy laboratory techniquesOld or poor quality testing equipmentDisturbance of soil samples before orduring testingMixing up results from different samplesHow do reduceTake and test more samplesImprove laboratory methodsAcquire improved testing equipmentUse better sampling and testing methodsImprove documentation methodseliminate mixing up samplesSolutions ManualFoundation Engineering: Principles and Practices, 3rd Edto2-3 2016 Pearson Education, Inc., Upper Saddle River, NJ. All rights reserved. This publication is protected by Copyright and written permission should be obtained fromthe publisher prior to any prohibited reproduction, storage in a retrieval system, or transmission in any form or by any means, electronic, mechanical, photocopying,recording, or likewise. For information regarding permission(s), write to: Rights and Permissions Department, Pearson Education, Inc., Upper Saddle River, NJ 07458.
Chap. 22.4Uncertainty and Risk in Foundation DesignUsing a random number generator create a sample of 4 relative densities using the PDFpresented in Figure 2.2. Repeat the exercise to create 3 different sample sets. Compute the meanand standard deviation of your sample. Compute the mean and standard deviation of eachsample set. Compare the means and standard deviations of your samples with each other andwith the mean and standard deviation of the original distribution. Discuss the differences amongthe sample sets and the original distribution, including the type of uncertainties you are dealingwith. How many samples do you think are needed to reliably determine the mean and standarddeviation of the relative density of this particular soil?SolutionThere are an infinite number of solutions to this problem. The table below shows Excelspreadsheet formula that can be used to generate the random sample sets.123456Aµ94.9Bσ5.7CN NORM.S.INV(RAND()) NORM.S.INV(RAND()) NORM.S.INV(RAND()) NORM.S.INV(RAND())µσDZ A 2 B 2*C2 A 2 B 2*C3 A 2 B 2*C4 A 2 B 2*C5 AVERAGE(D2:D5) STDEV.S(D2:D5)The table below shows three sample sets generated with the Excel spreadsheet shown above.Note that the average of the samples ranges from 6.5 below the distribution mean to 6.8 above it.Also one estimate of the standard deviation is nearly twice that of the original distribution. It ispossible, using sampling theory, to determine the number of sample required to have a certainconfidence level in the estimated parameters. However, this is well beyond the scope of this text.Students should note that increasing the sample size to 3 to 7, significantly reduces the variabilityof the estimated mean and standard deviation.Sample #1234Sample meanSample Standard DeviationTrial 1107.3498.75101.5099.02101.653.99Trial 292.4478.47100.55102.0793.3810.80Trial 395.7983.1083.9590.8088.416.01Solutions ManualFoundation Engineering: Principles and Practices, 3rd Ed2-4 2016 Pearson Education, Inc., Upper Saddle River, NJ. All rights reserved. This publication is protected by Copyright and written permission should be obtained fromthe publisher prior to any prohibited reproduction, storage in a retrieval system, or transmission in any form or by any means, electronic, mechanical, photocopying,recording, or likewise. For information regarding permission(s), write to: Rights and Permissions Department, Pearson Education, Inc., Upper Saddle River, NJ 07458.
Chap. 22.5Uncertainty and Risk in Foundation DesignA certain column will carry a dead load estimated to be 400 k with a COV of 0.1 and a live loadof 200 k with a COV of 0.25. What is the mean and standard deviation of the total column load?What is the probability that this load will exceed 750 k?SolutionFirst we must compute the standard deviation of each random variable from their mean and COVusing Equation 2.10. σ D 0.1(400) 40 σ L 0.25(200) 50Then we compute the mean and standard deviation of the total column load using Equations 2.17and 2.18µTotal 400 200 600σ Total 402 502 64Then using Equation 2.15 we compute the probability that the load exceeds 750 and 1 minus theprobability that it is less than 750 750 600 3P ( Load 750 ) 1 Φ 1 Φ ( 2.34 ) 9.5 1064 Solutions ManualFoundation Engineering: Principles and Practices, 3rd Ed2-5 2016 Pearson Education, Inc., Upper Saddle River, NJ. All rights reserved. This publication is protected by Copyright and written permission should be obtained fromthe publisher prior to any prohibited reproduction, storage in a retrieval system, or transmission in any form or by any means, electronic, mechanical, photocopying,recording, or likewise. For information regarding permission(s), write to: Rights and Permissions Department, Pearson Education, Inc., Upper Saddle River, NJ 07458.
Chap. 22.6Uncertainty and Risk in Foundation DesignA simply supported beam has a length of 3 m and carries a distributed load with a mean of 5kN/m and a COV of 0.2. What is the mean and standard deviation of the maximum moment inthe beam? What is the probability the maximum moment will exceed 7 kN-m?SolutionThe equation for the maximum moment in a simply supported beam subject to a distributed loadisM maxwl 232 w 1.125w88Using Equations 2.10, 2.17 and 2.18 the mean and standard deviation of Mmax ismM max 1.125w 5.62 σ M max 1.125 σ M max 1.125 ( COVw mw ) 1.125 ( 0.2 5) 1.125Then using Equation 2.15 we compute the probability that the load exceeds 750 and 1 minus theprobability that it is less than 750 7 5.62 P ( M max 7 ) 1 Φ 1 Φ (1.23) 0.11 1.125 Solutions ManualFoundation Engineering: Principles and Practices, 3rd Ed2-6 2016 Pearson Education, Inc., Upper Saddle River, NJ. All rights reserved. This publication is protected by Copyright and written permission should be obtained fromthe publisher prior to any prohibited reproduction, storage in a retrieval system, or transmission in any form or by any means, electronic, mechanical, photocopying,recording, or likewise. For information regarding permission(s), write to: Rights and Permissions Department, Pearson Education, Inc., Upper Saddle River, NJ 07458.
Chap. 22.7Uncertainty and Risk in Foundation DesignUsing the data shown in Figure 2.5, determine the probability that tangent of the friction anglefor the mudstone at the Confederation Bridge site is less than 0.25.SolutionThe data in Figure 2.5 is lognormally distributed with µ -1.09 and σ 0.270. Using Equation2.16 ln 0.25 ( 1.09) P ( tan φ 0.25) Φ Φ ( 1.097 ) 0.1360.270 Or there is a 13.6% chance that tanφ will be less than 0.25.Solutions ManualFoundation Engineering: Principles and Practices, 3rd Ed2-7 2016 Pearson Education, Inc., Upper Saddle River, NJ. All rights reserved. This publication is protected by Copyright and written permission should be obtained fromthe publisher prior to any prohibited reproduction, storage in a retrieval system, or transmission in any form or by any means, electronic, mechanical, photocopying,recording, or likewise. For information regarding permission(s), write to: Rights and Permissions Department, Pearson Education, Inc., Upper Saddle River, NJ 07458.
Chap. 22.8Uncertainty and Risk in Foundation DesignThe capacity for a certain foundation system is estimated to be 620 kN with a COV of 0.3. Thedemand on the foundation is estimated to be 150 kN with a COV of 0.15. Compute the meanfactor of safety of this foundation and its probability of failure.SolutionThe mean factor of safety is µF620 4.1150The standard deviation of demand and capacity are computed using Equation 2.10σ D 0.15 (150) 22.5σ C 0.3 ( 620) 186The mean and standard deviation of the safety margin, m, are computed using Equations 2.17and 2.18mm 620 150 470σm 1862 22.52 187And the probability that m 0 is computed using Equation 2.15 0 470 3P ( m 0 ) Φ Φ ( 2.51) 6 10187 Solutions ManualFoundation Engineering: Principles and Practices, 3rd Ed2-8 2016 Pearson Education, Inc., Upper Saddle River, NJ. All rights reserved. This publication is protected by Copyright and written permission should be obtained fromthe publisher prior to any prohibited reproduction, storage in a retrieval system, or transmission in any form or by any means, electronic, mechanical, photocopying,recording, or likewise. For information regarding permission(s), write to: Rights and Permissions Department, Pearson Education, Inc., Upper Saddle River, NJ 07458.
Chap. 22.9Uncertainty and Risk in Foundation DesignWe wish to design a shallow foundation with a probability of failure of 10-3. The footingsupports a column carrying a dead load with a mean of 30 k and COV of 0.05 and a live loadwith a mean of 10 k and COV of 0.15. Based on the uncertainty of soil properties and ouranalysis method, we estimate the COV of the foundation capacity to be 0.2. For what meancapacity does the foundation need to be designed?Solution mm m We want to select a value of µC such that Pf 10-3 or Φ C10 3 . From Equations 2.10, σm 2.17, and 2.18mmmmm C D LσC σ C2 σ D2 σ L2 ( COVC mmmC ) ( COVD D ) ( COVD L )222And Φ µC ( µD µL )( COVC µC ) ( COVD µD )22 ( COVD µ L )2 10 3 Substituting know values of for the COVs and means Φ µC ( 30 10 )( 0.2 µC ) ( 0.05 30)22 ( 0.15 10 )2 10 3 Solving this equation iteratively using Excel we getµC 106 kSolutions ManualFoundation Engineering: Principles and Practices, 3rd Ed2-9 2016 Pearson Education, Inc., Upper Saddle River, NJ. All rights reserved. This publication is protected by Copyright and written permission should be obtained fromthe publisher prior to any prohibited reproduction, storage in a retrieval system, or transmission in any form or by any means, electronic, mechanical, photocopying,recording, or likewise. For information regarding permission(s), write to: Rights and Permissions Department, Pearson Education, Inc., Upper Saddle River, NJ 07458.
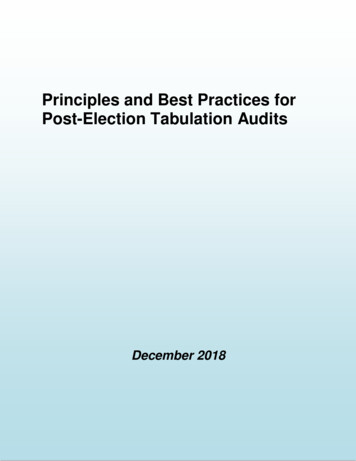
Chap. 2Uncertainty and Risk in Foundation Design2.10 Assume the foundation in Problem 2.9 was to support a high voltage transmission line near theDanish city of Århus. If the transmission line fails it will potentially kill 50 people. If thecomputed probability of failure is for a design life of 100 years, is risk associated with the failureof design acceptable based on the Danish guidance in Figure 2.8? Explain.SolutionThe probability of failure in Problem 2.9 was set to 10-3. If this is the total probability of failureover 100 years, then the annual probability of failure is approximately 10-3/100 10-5. The pointwith 50 deaths and an probability of 10-5 is plotted on Figure 2.8 below. This point lies betweenthe negligible line and limit of tolerability for the Danish code. In this zone the project mustinclude mitigations to make the risk “as low as reasonably practicable” or the probability offailure must be reduced to an annual probability of 10-6.1.E-0310 -3Annual ProbabilityLimit ofTolerability (1)1.E-0410 -4Negligible (1)1.E-05-51010-3)(50,Limit ofTolerability (2)Negligible (2)1.E-06-610Area ofIntenseScrutiny (2)1.E-07-7101.E-08-8101.E 0010 01.E 0110 11.E 021.E 0310 210 3Total Deaths1.E 0410 41.E 0510 5Solutions ManualFoundation Engineering: Principles and Practices, 3rd Ed2-10 2016 Pearson Education, Inc., Upper Saddle River, NJ. All rights reserved. This publication is protected by Copyright and written permission should be obtained fromthe publisher prior to any prohibited reproduction, storage in a retrieval system, or transmission in any form or by any means, electronic, mechanical, photocopying,recording, or likewise. For information regarding permission(s), write to: Rights and Permissions Department, Pearson Education, Inc., Upper Saddle River, NJ 07458.
Chap. 2Uncertainty and Risk in Foundation Design2.11 For the footing in Example 2.2, compute factor of safety required for a probability of failure of5 10-4 assuming the COV of the demand is 0.15SolutionFrom Example 2.2 we know that the mean capacity is 11,910 lb/ft2 with a standard deviation of2,280 lb/ft2. The question is what is the greatest mean demand that will give us a probability offailure of 5 10-4. To compute this we must compute the mean and standard deviation of thesafety margin, m, as a function of the mean and standard deviation of the demand, D.mmmmm C D 11,910 Dσm σ C2 σ D2 2, 280 COVD mm2, 280 0.15 DDAnd mm (11,910 D ) mm m 5 10 4 Φ DΦ D 2, 280 0.15m σm D 2 m D 11,9105 10 4 Φ 2, 280 0.15mD Solving the above equation iteratively using Excel, we computeµD 4135And the mean factor of safety, F, is then F11,910 2.94,135Solutions ManualFoundation Engineering: Principles and Practices, 3rd Ed2-11 2016 Pearson Education, Inc., Upper Saddle River, NJ. All rights reserved. This publication is protected by Copyright and written permission should be obtained fromthe publisher prior to any prohibited reproduction, storage in a retrieval system, or transmission in any form or by any means, electronic, mechanical, photocopying,recording, or likewise. For information regarding permission(s), write to: Rights and Permissions Department, Pearson Education, Inc., Upper Saddle River, NJ 07458.
Foundation Design Principles and Practices 3rd Edition Coduto Solutions ManualFull Download: ions-manualChap. 2Uncertainty and Risk in Foundation Design2.12 If the ASD design method has work satisfactorily for over 50 years, what’s the value in changingto LRFD method?SolutionThere are two major advantages to LRFD when compared to ASD. First, since LRFD usesmultiple partial factors of safety, it is more flexible and produces designs with more consistentprobabilities of failure for different load combinations, and different material property variability.Second, the partial safety factors in LRFD are selected based on an optimization process thatuses probability theory explicitly include the variability of the loads, material properties, andanalysis methods.Solutions ManualFoundation Engineering: Principles and Practices, 3rd Ed2-12 2016 Pearson Education, Inc., Upper Saddle River, NJ. All rights reserved. This publication is protected by Copyright and written permission should be obtained fromthe publisher prior to any prohibited reproduction, storage in a retrieval system, or transmission in any form or by any means, electronic, mechanical, photocopying,FulldownloadallForchaptersplease go toSolutionsManual,TestBank site:testbanklive.comrecording,or likewise.informationinstantlyregarding permission(s),writeto: Rights andPermissionsDepartment,PearsonEducation, Inc., Upper Saddle River, NJ 07458.
Chap. 2 Uncertainty and Risk in Foundation Design , 2.4, Using a random number generator create a sample of 4 relative densities using the PDF presented in Figure 2.2. Repeat the exercise to create 3 different sample sets. Compute the mean and standard deviation of your sample. Compute the mean and standard deviation of each sample set.