Transcription
Impaired Central Processing of Emotional Faces in Anorexia NervosaOLGA POLLATOS, MD, PHD, BEATE M. HERBERT, PHD, RAINER SCHANDRY, PHD,ANDKLAUS GRAMANN, PHDObjectives: To elucidate the potential relationship between classification of emotional faces and impaired central processing ineating disorders and to investigate the potential mediatory role of alexithymia and depression in this relationship. Methods:Visual-evoked potentials (VEPs) to emotional faces and classification performance were assessed in 12 anorexic females andmatched healthy controls. Results: Patients with anorexia nervosa showed no modulation of emotional face processing anddisplayed significantly increased N200 amplitudes in response to all emotional categories and decreased VEPs in response tounpleasant emotional faces in the P300 time range as compared with healthy controls. They also made more mistakes in emotionalface recognition, in particular, for neutral, sad, and disgusted content. Conclusions: There are marked differences in evokedpotentials and emotion recognition performances of patients with anorexia nervosa and controls in facial processing. Differencesin brain dynamics might contribute to difficulties in the correct recognition of facially expressed emotions, deficits in socialfunctioning, and in turn the maintenance of eating disorders. Key words: anorexia nervosa, emotional faces, emotional processing,VEPs, EEG, alexithymia.ED ! eating disorder; ERP ! event-related potential; VEP !visual-evoked potential; AN ! anorexia nervosa; MDD ! majordepressive disorder; EEG ! electroencephalography; TAS ! Toronto Alexithymia Scale; BMI ! body mass index; BDI ! BeckDepression Inventory; STAI ! State Trait Anxiety Inventory.INTRODUCTIONating disorders (EDs) are the most prevalent psychiatricdisorders in females aged 14 to 26 years and are associatedwith considerable physical and psychological morbidity (1–4). With prevalence rates of up to 0.3% to 1% among youngfemales (5), these disorders represent a great challenge forphysicians of various specialties and significantly affect healthcare in the female population (6).There is evidence that the recognition of emotionalstates is affected in eating disorders. The human face represents a powerful medium for social signaling and theability to decode complex facial expressions is essential tosocial behavior (7). Kucharska-Pietura and co-workers (8)reported difficulties in recognizing emotions from facialexpression in patients with anorexia nervosa (AN) andsuggested that this impairment may contribute to poorinterpersonal communication and a lack of empathy, bothof which have been shown to be associated with AN.Zonnevijlle-Bender and colleagues (9) also demonstratedthat patients with eating disorders perform worse on anemotion recognition test as compared with healthy controls.However, results are not univocal. Still other studies(10,11) have found comparable facial recognition performance in patients with EDs. To date, the question as towhether possible deficits are accompanied by differences inthe central processing of emotional faces as measured byEFrom the Departments of Neurology (O.P.) and Psychology (O.P., R.S.),Ludwig-Maximilians-University of Munich, Germany; Department of Clinical and Cognitive Neuroscience (B.M.H.), University of Heidelberg, CentralInstitute of Mental Health; and Swartz Center for Computational Neuroscience (K.G.), Institute for Neural Computation, University of California,San Diego, California.Address correspondence and reprint requests to Olga Pollatos, Leopoldstr.13, 80802 Munich, Germany. E-mail: pollatos@psy.uni-muenchen.deSupported in part by a grant supplied by the “Förderung im Rahmen desHochschul-und Wissenschaftsprogramms (HWP)” (O.P.).Received for publication August 22, 2007; revision received March 19,2008.DOI: 10.1097/PSY.0b013e31817e41e6Psychosomatic Medicine 70:701–708 (2008)0033-3174/08/7006-0701Copyright 2008 by the American Psychosomatic Societyvisual-evoked potentials (VEPs) and their components inresponse to emotional faces remains open.An important variable in the possible interrelation betweeneating disorders and emotion recognition is alexithymia, asyndrome marked by the inability to identify, describe, regulate, and express one’s emotions (12,13). Several studies haveshown that ED patients are characterized by high alexithymiascores (9 –11,14,15). This variable might contribute to or, tosome extent, help to explain the observed difficulties in recognizing emotional states in EDs and should therefore betaken into account when investigating the processing of emotional faces in EDs.Brain processes accompanying the perception of emotionalfaces can be studied by means of event-related potentials(ERPs). Especially components like the N200 and the P300are of interest and were studied in relationship to EDs (16).The N200 has an anterior scalp distribution (17,18) and issensitive to deviations from the long-term context that rendersa stimulus unfamiliar and difficult to encode (18). Furthermore, the N200 is related to the inhibition of executive functions (17,19). The P300 amplitude is one index of attentionand processing capacity (20) and reflects cognitive resourcesallocated to the evaluation of relevant information (21,22), theperformance of cognitive processing (23) and target detection(24). It covaries with both reported arousal (25–27) and peripheral indices of cardiovascular reactivity (28) to emotionalstimuli. Previous research has also indicated that differencesbetween emotional and neutral faces and between differentemotional facial expressions are reflected in brain activity inthe time range of 200 to 500 milliseconds (2,29) post stimulus,which includes the N200 and the P300 time window. Thesecomponents might therefore represent a possible indicator ofdifferences in processing of emotional faces in EDs.The objective of the present study was to investigate emotional face processing and recognition in patients with AN bymeans of ERPs. More specifically, we hypothesized that anorexic patients would show differential central processing, asmeasured by the N200 and the P300, and decreased emotionrecognition performance of emotional faces in comparisonwith healthy controls. The second aim was to investigate thepotential mediatory role of alexithymia and depression in thishypothesized relationship.701
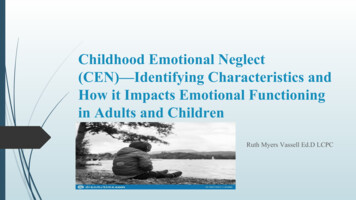
O. POLLATOS et al.MATERIALS AND METHODSParticipantsFifteen female patients with AN were recruited from patient self-helpgroups (Anorexia Nervosa and Associated Disorders (ANAD) e.V., Pathways, Cinderella e.V., Caritas Self-Help Centre, Max-Planck-Institute ofPsychiatry) in Munich between October 2006 and May 2007. All femalepatients met the Diagnostic and Statistical Manual of Mental Disorders, 4thEdition (DSM-IV) (30) criteria for AN as assessed by the Structured ClinicalInterview for DSM-IV Axis I Disorders (SCID) (31). Exclusion criteriaincluded past or present psychotic disorders, any current medication (exceptcontraceptives), and substance abuse (tobacco use was allowed). A systematicevaluation of past neurological problems (e.g., head injuries) was not performed.Mean " standard deviation age in the AN group was 22.6 " 5.6 years.Mean body mass index (BMI) was 16.3 " 1.1 kg/m2 and mean duration ofillness was 3.7 " 3.2 years. Four (27%) patients received an additional AxisI diagnosis. Of these, two had major depressive disorder (MDD) with nocomorbid anxiety disorder, one had MDD with a comorbid anxiety disorder(panic disorder), and one had social phobia with no other comorbid anxiety ordepressive disorder. Due to the possible impact of MDD on the results, thethree patients with MDD were excluded from all further analyses. All otherparticipants with AN were of the restricting subtype.Patients with AN were matched for gender, age, and educational levelwith healthy controls. Controls had a mean age of 24.1 " 5.5 years, a meanBMI of 22.0 " 4.8 kg/m2; they were recruited in universities, vocationalschools, and technical colleges. They were also assessed using the SCID (31).None of the control participants had an Axis I diagnosis or currently receivedmedication (except contraceptives). Participants were paid 30 Euros for takingpart in the study.ProcedureExperiments were conducted in accordance with the Declaration of Helsinki. Ethical approval was obtained from an Institutional Review Board.Participants were provided with written information about the experiment andinformed consent was obtained. Height and weight were measured and allparticipants completed a series of questionnaires including the Beck Depression Inventory (BDI), the State Trait Anxiety Inventory (STAI), the TorontoAlexithymia Scale (TAS), and a questionnaire assessing personal data, suchas age and schooling.A total of 240 emotional faces selected from the Karolinska DirectedEmotional Faces (32) were presented. This set of 240 comprised 40 faces ineach of the following categories: neutral, sad, happy, fearful, angry, anddisgusted. All pictures were presented in random order and the subjects wererequested to classify the faces according to the six emotional categories. Tothis end, a forced-choice procedure with six possible categories was presentedafter each picture presentation. For each emotional category, half of the facesdepicted were female and half were male. A single trial began with a fixationcross followed by an emotional face which was presented for 2 seconds.Participants were instructed to avoid exploratory eye movements and eyeblinks and to attentively observe the pictures. Immediately after picture offset,participants were given 10 seconds in which to classify the emotional qualityof the stimuli by pressing one of six response buttons corresponding to the sixemotional categories. They were instructed to be as accurate as possible butto also carry out classification in the case of uncertainty. If a response was notprovided within 8 seconds, a second command appeared on the screen whichprompted the subject to enter his/her classification. After the response or amaximal interval of 10 seconds, a variable time interval of 1.5 to 3 secondsfollowed before the next trial commenced. Over the course of the experiment,two short 5-minute breaks took place. The experiment lasted approximately 1hour.Electroencephalography (EEG) Recordingand ReductionEEG activity was recorded using 64 Ag-AgCl leads according to the 10 to10 system with a band-pass of 0.01 to 100 Hz (SynAmps, CompumedicsNeuroscan, Charlotte, North Carolina) and digitized at a sampling rate of7021000 Hz. Electrode positions were determined using an electrode cap (FalkMinow Services, Herrsching-Breitbrunn, Germany). The recordings werereferenced to Cz and re-referenced offline to linked mastoids. Horizontal andvertical eye movements were recorded using electrodes placed at the outercanthus of each eye (EOGH) and above and below the left eye (EOGV).Electrode resistance was maintained below 5 K #.Blinks were corrected using the Gratton and Coles algorithm implementedin the analysis software (Brain Vision Analyzer, Brain Products, Gilching,Germany). The EEG was examined for muscle activity and other sources ofartifacts. Trials contaminated by artifacts were eliminated before averaging,and accounted for approximately 8% of the trials. There were no systematicdifferences in the amount or distribution of artifacts between patients andcontrols. Finally, EEG was filtered (30 Hz) and averaged for each categorywith onset of picture presentation. Epochs extended from 200 millisecondsbefore trigger onset to 1000 milliseconds after trigger onset. Only epochs withcorrect recognition of face category were included in the VEPs analyses.Data AnalysisSociodemographic and questionnaire data were entered into analyses ofvariance (ANOVAs) with the between-factor Group.Task performance was examined as the proportion of correct responses foreach emotional category and entered into a mixed design analysis of covariance (ANCOVA) with six levels of Emotional Condition as repeated measureand two levels of Group as between-subject measure. Alexithymia andDepression were included as covariates. In the Results section, uncorrected Fvalues are reported together with Greenhouse-Geiser epsilon values andcorrected probability levels.VEPs were averaged for 12 regions, formed by crossing hemisphere(right/left) with horizontal plane (anterior, medial, posterior), and verticalplane (inferior, superior) (33,34). Concerning the N200, peak amplitudes(peak "20 sampling points) and peak latencies in the time range between 180and 300 milliseconds were calculated. With regard to the P300 and its broadwaveform, mean voltages were assessed in the time window of the P300(280 – 450 milliseconds) as well as peak latencies. EEG data were analyzedusing ANCOVAs with two levels of Hemisphere (right/left), six levels ofRegion (antero-inferior, antero-superior, medial-inferior, medial-superior,postero-inferior, postero-superior), six levels of Emotional Condition (neutral,happy, sad, fearful, angry, disgusted), and two levels of Group (anorecticversus control) with Alexithymia and Depression as covariates.Finally, correlations between questionnaire data and both task performance and VEPs were assessed, using Pearson correlation coefficients andpartial correlation coefficients.RESULTSSample Description and Questionnaire DataSociodemographic features (age, BMI) and questionnairedata obtained for each of the two participant groups arepresented in Table 1. Group comparisons revealed a significantly lower BMI for participants with AN and no differenceswith respect to schooling or age (Table 1). Patients with ANscored significantly higher in depression (BDI), trait anxiety(STAI), and alexithymia (in subscores 1: “ability to identifyfeelings” and 2: “ability to describe feelings” as well as intotal score). To rule out possible interactions between emotional face processing and alexithymia, the TAS subscores 1and 2, in which significant differences between both groupsoccurred, were included as covariates in further analyses.Also, depression measured by the BDI score was included asfurther covariate.Face Recognition PerformanceFigure 1 summarizes performance on the face recognitiontask for patients with AN and controls separately.Psychosomatic Medicine 70:701–708 (2008)
ANOREXIA NERVOSA AND EMOTIONAL FACESTABLE 1. Comparison Between the Two Groups With Respect to Sociodemographic and Questionnaire DataAnorexics (mean " SD)Controls (mean " SD)F (df ! 1,28)p23.86 " 4.254.09 " 0.9516.34 " 1.1418.42 " 8.2541.42 " 5.6849.58 " 10.0221.16 " 5.4018.92 " 3.9917.67 " 3.4266.52 " 13.4422.39 " 4.784.27 " 0.4622.95 " 4.523.07 " 3.1037.73 " 9.6536.73 " 10.0414.91 " 4.6313.81 " 5.6018.67 " 4.6447.39 " ateSTAI-traitTAS 1TAS 2TAS 3TAS totalSD ! standard deviation; BMI ! body mass index; BDI ! Beck Depression Inventory; STAI ! State Trait Anxiety Inventory; TAS ! Toronto AlexithymiaScale.** p .01; *** p .001.100*******Percent gure 1.AngryDisgustedControlsRecognition performance contrasting controls and anorexic patients. Bars represent standard error of means. * p .05; ** p .001.The ANCOVA revealed a significant main effect of FaceCategory (F(5,110) ! 2.79, p ! .04, !2 ! 0.11, " ! 0.69),indicating differential performance in the six face categories.Post hoc least significant difference tests showed that happy(correct response rate: 99.3%) and angry faces (93.0%) wererecognized significantly better than sad (81.7%), fearful(82.3%), neutral (81.6%), and disgusted faces (78.9%; allcomparisons, p .05). Furthermore, a significant main effectof Group (F(1,22) ! 5.31, p ! .03, !2 ! 0.19, " ! 0.59)showed that females with AN made significantly more mistakes (mean correct response rate ! 81.6%) than healthycontrols (90.8%). These main effects were qualified by asignificant interaction of Face Category % Group (F(5,110) !4.06, p ! .008, !2 ! 0.16, " ! 0.86). Post hoc t tests revealedsignificantly lower recognition performance in anorexic females for neutral (p .001), sad (p ! .02), and disgusted (p !.007) faces (Figure 1).With respect to the covariates alexithymia and depression,no significant main or interaction effects were observed. TASsubscores 1 (“ability to identify feelings”) and 2 (“ability toPsychosomatic Medicine 70:701–708 (2008)describe feelings”) as well as depression were therefore excluded as covariates from the detailed error analyses.The misclassifications of emotional faces were analyzed,using repeated-measures ANOVAs. No significant interaction effects occurred, indicating that patients with AN andcontrols made the same types of errors within all emotionalcategories.Correlation coefficients were computed for emotion recognition performance and alexithymia subscales 1 and 2 as wellas with depression score of the BDI. Significant negativecorrelation coefficients were observed between correct response rate and the degree of alexithymia for neutral faces(TAS 1, r ! &.61, p ! .001; TAS 2, r ! &.55, p ! .003) aswell as between the depression scores and the correct responserate for neutral (r ! &.61, p ! .001) faces.To investigate the role of the clinical variables like the BMIand the duration of illness on the face identification performance, correlation analyses were performed. These two variables did not correlate significantly with the correct responserates for emotional faces.703
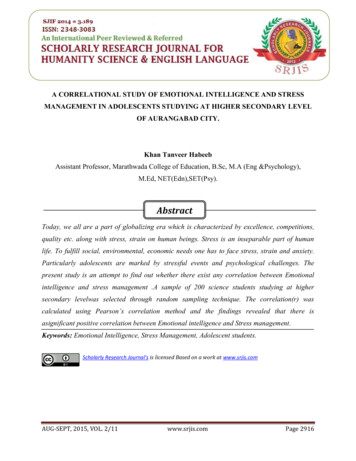
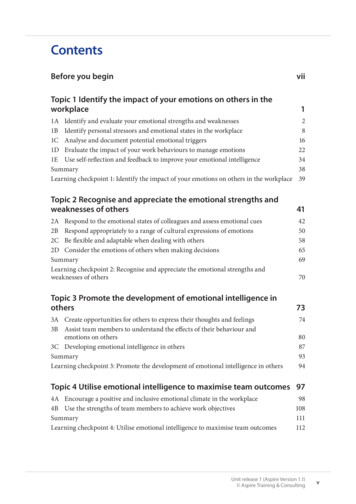
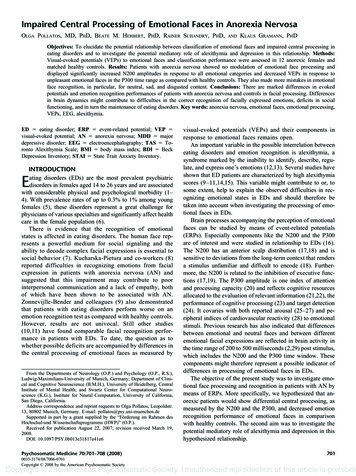
O. POLLATOS et al.Figure 2.VEPs to the six emotional face categories within controls and anorexic patients.VEPs to Emotional FacesAs seen in Figure 2, VEPs substantially differed across thesix face categories as well as between healthy and anorexicparticipants in the time window starting at 200 milliseconds(depicted at right medial-superior electrode cluster). Figure 3contrasts the two groups with respect to each of the sixemotional categories (at medial-superior electrode cluster corresponding to the used statistical analyses based on 12-electrode clusters).In accordance with latency ranges reported in earlier studies using emotional pictures (33–36) or emotional faces (3)and based on visual inspection of the grand average, peakamplitudes (peak "20 sampling points) and peak latencies inthe time window of 180 to 300 milliseconds for the N200, andmean amplitude and peak latencies in the time range of 280 to704450 milliseconds for the P300 were examined. Alexithymia(TAS subscores 1 and 2) and depression were included ascovariates in subsequent analyses. Results are presented witha focus on the between-subject factor Group.N200 Statistical AnalysesPeak AmplitudeA significant main effect of Group (F(1,22) ! 9.25, p !.006, !2 ! 0.30, " ! 0.83) was observed indicating morenegative N200 amplitudes for anorectic patients as comparedwith healthy controls (mean &1.11 versus 1.47 #V). Additionally, there was a significant effect of the covariate Depression (F(1,22) ! 7.42, p ! .01, !2 ! 0.25, " ! 0.74). TheGroup % Face Category interaction was not significant(F(5,110) ! 1.43, p ! .23).Psychosomatic Medicine 70:701–708 (2008)
ANOREXIA NERVOSA AND EMOTIONAL FACESFigure 3.VEPs contrasting controls and anorexic patients for the six face categories.Peak LatencyMean N200 peak latencies did not differ significantly withregard to Group (F(1,22) ! 0.37, p ! .55) or the addedcovariates.P300 Statistical AnalysesMean AmplitudeThe ANCOVA revealed a significant main effect of Group(F(1,22) ! 9.36, p ! .006, !2 ! 0.30, " ! 0.83) andPsychosomatic Medicine 70:701–708 (2008)significant interaction effects Group % Region (F(5,110) !3.18, p ! .047, !2 ! 0.13, " ! 0.60) and Group % FaceCategory (F(5,110) ! 2.81, p ! .03, !2 ! 0.11, " ! 0.73).Mean P300 activity was significantly higher in healthy controls as compared with females with AN (mean 4.53 #Vversus 2.70 #V) whereas the observed Group % Face Category interaction indicated that this effect was only present forspecific emotional categories (see subsequent analyses). Thisdifference was most pronounced over antero-superior, antero705
O. POLLATOS et al.inferior, and medial-superior regions. Neither main effects(TAS 1: F(1,22) ! 0.03, p ! .86; TAS 2: F(1,22) ! 0.01, p !.91; BDI: F(1,22) ! 0.41, p ! .53) nor interactions effects,including the covariates Alexithymia and Depression, wereobserved and these variables were therefore excluded fromfurther analyses.Based on the significant Group % Face Category interaction effect, post hoc ANOVAs were calculated to determine inwhich of the emotional face categories the two groups significantly differed and whether VEPs were modulated as a function of face content for both healthy controls and patients.ANOVAs computed separately for each emotional category revealed that females with AN exhibited lower P300mean amplitudes in response to sad (mean 4.62 #V versus2.44 #V; F(1,25) ! 10.33, p ! .004), fearful (mean 4.62 #Vversus 2.44 #V; F(1,25) ! 12.78, p ! .001), angry (mean5.20 #V versus 2.65 #V; F(1,25) ! 24.91, p .001), anddisgusted (mean 5.32 #V versus 3.28 #V; F(1,25) ! 12.82,p ! .001) faces and significantly higher mean amplitudes inresponse to neutral faces (mean 2.56 #V versus 3.56 #V;F(1,25) ! 4.74, p ! .04).ANOVAs conducted for each of the two participant groupsrevealed a significant main effect of Face Category (F(5,70) !8.17, p .001, !2 ! 0.37, " ! 0.99) in healthy controls withhigher mean P300 activity for sad, angry, and disgusted facesas compared with neutral faces (all post hoc tests, p .05). Nosignificant modulation of the P300 according to Face Category (F(5,55) ! 2.05, p ! .14) was observed in the AN group.Peak LatencyNeither Group (F(1,22) ! 0.16, p ! .70) nor the interactioneffects Group % Region (F(5,110) ! 0.66, p ! .49) andGroup % Face Category (F(5,110) ! 1.42, p ! .24) weresignificant.Relationship Between Face Recognition Performance,N200 and P300 AmplitudeCorrelation coefficients were computed between the correct response rate for each emotional face category and thecorresponding mean P300 amplitudes as well as N200 peakamplitudes at antero-superior, antero-inferior, medial-superior, medial-inferior, postero-superior and postero-inferiorelectrode pools.For the N2 component, significant correlations were observed between task performance and amplitude for sad facesat medial-superior (r ! .40, p ! .04) electrode location, forfearful faces at antero-superior (r ! &.40, p ! .01) andpostero-inferior (r ! .50, p ! .01) locations, and for disgustedfaces at antero-superior (r ! .54, p ! .004) and antero-inferior(r ! .49, p ! .009) electrode locations. In accounting for thedegree of alexithymia (TAS subscales 1 and 2) and depressionby assessing partial correlations, all observed correlation coefficients remained significant (sad: medial-superior, r ! .41,p ! .04; fearful: antero-superior, r ! &.54, p ! .006, posteroinferior, r ! .59, p ! .002; disgusted: antero-superior, r ! .48,p ! .03, antero-inferior, r ! .51, p ! .01).706Concerning the P300, significant correlations were observed between task performance and P300 amplitude for sadfaces at antero-superior (r ! .46, p ! .02) and medial-superior(r ! .41, p ! .04) electrode locations, for fearful faces atantero-superior at (r ! &.39, p ! .04) and postero-inferior(r ! .49, p ! .01) locations, and for disgusted faces atantero-superior (r ! .54, p ! .004) and antero-inferior (r !0.51, p ! .007) electrode locations. In accounting for thedegree of alexithymia (TAS subscales 1 and 2) and depressionby assessing partial correlations, all observed correlation coefficients remained significant (sad: antero-superior, r ! .40,p ! .04, medial-superior, r ! .41, p ! .03; fearful: anterosuperior, r ! &.54, p ! .006, postero-inferior, r ! .59, p !.002; disgusted: antero-superior, r ! .49, p ! .02, anteroinferior, r ! .51, p ! .01).DISCUSSIONOur data provide evidence of differential processing ofemotional faces in subjects with AN as compared with healthycontrols. Anorexic females not only made more mistakes inclassifying neutral, sad, and disgusted faces, but they alsoexhibited increased N200 amplitudes to all face categories anddecreased P300 amplitudes in response to unpleasant emotional faces. In the P300 time range, patients with AN showedless modulation of the VEPs in connection with the emotionalvalence of the facial expression as was the case in healthyparticipants. These effects are not attributable to differences inalexithymia and depression as these variables were controlledfor. Possible shortcomings of the present study include itsrelative small sample size and a missing participants’ evaluation of neurological history including head injuries.With respect to the observed differences in N200 amplitudes, it can be suggested that patients with AN have greaterdifficulty to encode facial expressions. According to Dennisand Chen (37), enhanced N200 amplitudes may specificallyreflect reduced resources available for attention performanceand fewer attentional control resources. Consistent with thisview, enhanced N200 amplitudes were correlated with lowertask performance in the subsequent categorization task. However, another more likely explanation for the differences inN200 amplitudes might be a general increase in attentionaldemands for the classification of emotional faces for subjectswith AN. It was shown that the frontocentral N200 is sensitiveto visual novelty and mismatch between perceived andexpected (template) information (17,18,38). Because the continuous presentation of faces in the present experiment isunlikely to provoke a novelty reaction, increased N200 amplitudes might rather reflect a general impairment in patientswith AN to provide an adequate template for the efficientprocessing of facial expressions. Thus, processing of facialexpression in these patients would lead to an increase inattentional demands or the need to shift attentional resourcesto the appropriate emotional category. The comodulation ofthe N2 component by depression as measured by the BDIpoints to an influence of depression on the visual-evokedN200 component in processing facial expressions. However,Psychosomatic Medicine 70:701–708 (2008)
ANOREXIA NERVOSA AND EMOTIONAL FACESERP studies in individuals with depression are scarce andshow equivocal results. Whereas a study by el Massioui andLesèvre (39) showed a weak attention effect on the N200component in patients with unipolar depression, more recentstudies imply normal attention effects in depressed patients(40,41). Further studies with larger sample sizes have tosystematically investigate the role of depression on the visualevoked N200 component.The present study revealed decreased P300 amplitudes inresponse to unpleasant emotional faces. This result is not inaccordance with data from Dodin and co-workers (16), showing that subjects with AN had larger P300 amplitudes andlonger P300 latencies in an oddball task, using body imagesand geometrical shapes. The discrepancy can be partly explained by differences in the task and differences in the stimuliused in both studies, namely, emotional faces as comparedwith geometric shapes and body images. In our opinion, thepresent study used a more complicated task as compared withthat of Dodin and co-workers (16) in that we forced participants to attentively categorize the emotional content of eachface presented. This very specific and attentional demandingtask might interfere with the postulated nonspecific hyperarousal in AN as suggested by Dodin and co-workers (16). Weargue that the observed differences in the P300 amplitudewere not caused by decreased attentional capacity in patientswith AN for the following reasons: first, patients with ANperformed comparably with controls in several of the emotional categories; second, we did not observe a general decrease in P300 amplitude in the group with AN—their VEPsdid not differ for happy faces and were even increased forneutral faces as compared with healthy controls. This resultthus substantially extends former research reporting a decreased ability to recognize the expression of emotional facesin AN (8,9) by showing that central indices of negative emotional face processing are also affected in AN. Importantly,statistically significant modulation of the P300, according tothe emotional expression of the presented faces, was absent inpatients with AN. Bearing in mind that emotion recognitionperformance was related to the amplitude of the P300 for mostof the unpleasant emotional categories, it is conceivable thatthe lack of modulation of this component in response to theseemotional contents is accompanied by higher rates of facialmisclassification in AN.Empirical data suggest that emotional face recognitioninvolves the amygdala for fear and anger, the insula and basalganglia for disgust, and cingulate, medial frontal and parietalcortices for happiness (7). Although imaging and ERP data onemotional face perception in EDs are still lacking, other neuroimaging studies on AN have reported functional abnormalities in prefrontal, cingulated, and temporal structures duringthe processing of food, emotional or body images (42– 45). Itcan be hypothesized that the observed reduced P300 responseto negative facial expressions might reflect a dysfunctionalactivation pattern in underlying brain structures, such as thecingulate. Further data are required in examining the thus farPsychosomatic Medicine 70:701–708 (2008)unanswered question concerning differences in the centralprocessing of emotional faces in AN.In this context, it is initially astonishing that patients withAN exhibited greater P300 amplitudes to neutral faces ascompared with controls. Across all six face categories, theVEPs to neutral faces were most pronounced in patients withAN whereas this category caused the least activity in controls,which in turn might ex
Impaired Central Processing of Emotional Faces in Anorexia Nervosa OLGA POLLATOS, MD, PHD, BEATE M. HERBERT,PHD, RAINER SCHANDRY,PHD, AND KLAUS GRAMANN,PHD Objectives: To elucidate the potential relationship between classification of emotional faces and impaired central processing in eating disorders and to investigate the potential mediatory role of alexithymia and depression in this .