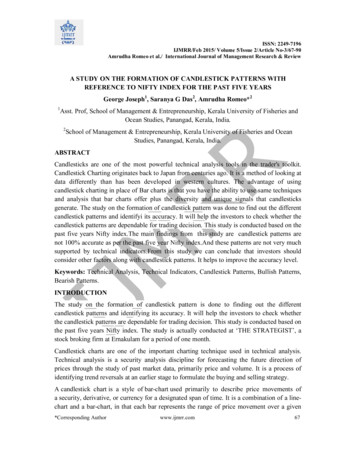
Transcription
Japanese CandlestickPrimerwww.fxtradersedge.com 2014 FX Trader’s EDGE TM All Rights Reserved
DisclaimerThe candlestick patterns explained in this presentation are for informationpurposes only. Candlestick patterns are used to supplement your chart analysisand are not meant to be used on their own without other confirmations.FX Traders EDGE cannot be held responsible for any consequences that mayresult from the use of these candlestick patterns or any other information inthis presentation. This presentation is for Educational Purposes only.www.fxtradersedge.com 2014 FX Trader’s EDGE TM All Rights Reserved
Reversal Chart PatternsNotesWe learned that there are two types of patterns: Continuation and Reversal. Reversal patterns occur atthe end of a trend. Continuation patterns occur during the trend and are merely pauses or consolidationsin the trend.Several things occur at market reversal points: At market tops, traders are greedy and at market bottoms,traders and investors are fearful – both sentiments lead to market extremes, even in currencies!At either extreme, there is a major trend line break – so plot those trend lines! Also, price tends todeviate from the moving averages so look for the rubber band effect! Certain candlestick patternsemerge at the end of the trend – this is where you tend to see long wicks and patterns such as bullishand bearish engulfing, morning and evening stars, hammers, shooting stars, and tweezer tops andbottoms.Finally, the longer the pattern takes to materialize, and the larger the pattern, the further the prices willmove outside of that pattern, and the greater its importance. That doesn’t mean that these patternsaren’t found on shorter time frames – they are, but they need to be traded nimbly with definitive profitobjectives and stop losses.www.fxtradersedge.com 2014 FX Trader’s EDGE TM All Rights Reserved
Reversal Chart PatternsMarkets are fractal, meaning that chart patterns formrepeating arrangements or shapes in any time frame.Classical technical analysis books defined chart patterns inthe 70’s that are still true today.Reversal Chart PatternsCorrectly identify these patterns to determine futuretrading opportunities.Reversal chart pattern recognition helps determinechange in market sentiment and time entries and exits.All chart patterns have measured objectives.www.fxtradersedge.com 2014 FX Trader’s EDGE TM All Rights Reserved
Reversal Candle PatternsReversal Days are also called Top or BottomReversal Days, Buying or Selling Climaxes, andKey Reversal Days. Learning how to trade themcan get you into a trend reversal early.Reversal Candle PatternsTwo Day Reversals are also quite common, assometimes it takes two days for the market toreverse itself.Topping and bottoming fractals are 3-dayformations found at the top and bottom ofmarkets and can get you into the new trendearly.www.fxtradersedge.com 2014 FX Trader’s EDGE TM All Rights Reserved
Reversal Candle PatternsReversal Candles – Reversal DaysSIn the case of a market top, a new high forms that period, butprice closes in the bottom 25% of that period’s trading range.The longer the wick, the more powerful the move will be inthe opposite direction.In the case of a market bottom, a new low forms that period,but price closes in the top 25% of that period’s trading range.BTrade entry: For a market top, place a sell stop order below the low of the reversalday. For a market bottom, place a buy stop order above the high of the reversal day.Place the stop just above the high of the top or below the low of the bottom.www.fxtradersedge.com 2014 FX Trader’s EDGE TM All Rights Reserved
Reversal Candle PatternsReversal Candles – Topping and Bottoming FractalsSBIn the case of a market top, the fractal high (candle 2) ishigher than the high of the previous candle (candle 1) and thehigh of the subsequent candle. (candle 3)In the case of a market bottom, the fractal low is lower thanthe low of the previous candle and the low of the subsequentcandle.Trade entry: For a market top, place a sell stop order below the low of candle 3. Thestop is above the candle 2 or 3 highs, preferably above the candle 2. For a marketbottom, place a buy stop order above the high of candle 3. The stop is below thecandle 2 or 3 lows, preferably below the candle 2.www.fxtradersedge.com 2014 FX Trader’s EDGE TM All Rights Reserved
Candlestick PatternsThe Japanese have used candlesticks as acharting and analysis technique for centuries.Candlestick PatternsCandlesticks mostly help pick tops and bottomsand are most powerful when they confirm awestern indicator.Candlestick patterns are psychological imprintsof what traders are thinking at any given time.There are approximately 40 reversal candlepatterns that vary from single candlesticks togroupings of up to five candlesticks.www.fxtradersedge.com 2014 FX Trader’s EDGE TM All Rights Reserved
Candlestick PatternsReal BodyReal Bodywww.fxtradersedge.com 2014 FX Trader’s EDGE TM All Rights Reserved
Candlestick PatternsUnderstanding Candlestick Patterns"A" – wide range body with no tails or shadows – verybullish or bearish for a trend move"B" - opening and closing prices are practically identical –no real control – a pause"C" shows a very small trading range with a narrow-rangebody – a pause with no major follow-through"D" shows the opening and closing near the high with along bottoming tail or shadow"E" shows the opening and closing near the low with along topping tail or shadowwww.fxtradersedge.com 2014 FX Trader’s EDGE TM All Rights Reserved
Candlestick PatternsUnderstanding Candlestick PatternsWhich is ‘most’ bullish or bearish of these candles?www.fxtradersedge.com 2014 FX Trader’s EDGE TM All Rights Reserved
Candlestick PatternsUnderstanding Candlestick PatternsWhich is ‘most’ bullish or bearish of thesecandles?You might say that “A” is the most bullish or bearish candle.And it is very bullish or bearish in a strong up- or downtrend. But in some cases, “D” on the left can be more bullishand “E” on the right can be more bearish.In the case of “D”, a battle was fought, and at one point, theshorts were in control. By the end of the bar, the longsfought all the way back and actually brought the marketabove the opening price. This candle, if located at thebottom of a down-trend, can potentially signal a reversal inthe trend. The same is true for the sellers in “E” on the right.www.fxtradersedge.com 2014 FX Trader’s EDGE TM All Rights Reserved
Reversal Candlestick PatternsBullish and Bearish PatternsCandlestick Patterns:Illustrated Examplesthat are opposites ofeach otherBullish PatternsBearish PatternsBullish EngulfingMorning StarHammerInverted HammerPiercing PatternTweezer BottomBearish EngulfingEvening StarHanging ManShooting StarDark Cloud CoverTweezer TopDojis – Candles of IndecisionPerfect, Long-legged, Dragonfly, Gravestonewww.fxtradersedge.com 2014 FX Trader’s EDGE TM All Rights Reserved
Reversal Candlestick PatternsBullish and Bearish PatternsBullish and Bearish PatternsBullish Engulfing PatternMarket is in a definable downtrend.Candle 1 has a small red real body.Candle 2 reverses where the green body completelyengulfs the previous day’s red body.A stronger signal occurs when the green reversalcandle body engulfs two or more bodies.www.fxtradersedge.com 2014 FX Trader’s EDGE TM All Rights Reserved
Reversal Candlestick PatternsBullish and Bearish PatternsBearish Engulfing PatternMarket is in a definable uptrend.Candle 1 has a small green body in an uptrend.Candle 2 reverses where the red body completelyengulfs the previous day’s green body.A stronger signal occurs when the red reversalcandle body engulfs two or more bodies.www.fxtradersedge.com 2014 FX Trader’s EDGE TM All Rights Reserved
Reversal Candlestick PatternsBullish and Bearish PatternsBullish Morning Star PatternBullish three-candle pattern at swing lows.Candle 1 has a tall red real body.Candle 2 has a small red or green body.Candle 3 closes at least 50% into the first real bodyand is a tall green candle.www.fxtradersedge.com 2014 FX Trader’s EDGE TM All Rights Reserved
Reversal Candlestick PatternsBullish and Bearish PatternsBullish and Bearish PatternsBearish Evening Star PatternCandlestick Pattern:Evening StarBearish three-candle pattern at swing highs.Candle 1 has a tall green real body.Candle 2 has a small green or red real body.Candle 3 closes at least 50% into the first real bodyand is a tall red candle.www.fxtradersedge.com 2014 FX Trader’s EDGE TM All Rights Reserved
Reversal Candlestick PatternsBullish and Bearish PatternsBullish HammerBullish HammerSmall real bodies (either green or red).Real bodies are near high of the session with verylong lower shadows (at least 2-3 times the height ofthe real body).Bearish Hanging ManA hammer appears at the bottom of the decline(market hammering out a base). It is bullish.Bearish Hanging ManHanging man appears after an uptrend. It is bearish.www.fxtradersedge.com 2014 FX Trader’s EDGE TM All Rights Reserved
Reversal Candlestick PatternsBullish and Bearish PatternsInverted HammerCandlestick Pattern:Shooting StarShooting StarBullish Inverted HammerThe Inverted Hammer is a bottom reversal candle,and the following day is a strong bullish day, thatconfirms the reversal signal.Bearish Shooting StarThe Shooting Star is a top reversal candle, just likethe hanging man. However, it displays a long uppershadow, and its small real body is at or near the lowsof the session.The Japanese say that the shooting star shows“trouble overhead”. Because of the bearish longupper shadow, we don’t need as much bearishconfirmation as we do with a hanging man.www.fxtradersedge.com 2014 FX Trader’s EDGE TM All Rights Reserved
Reversal Candlestick PatternsBullish and Bearish PatternsPiercing Line(not 24 hour Forex)Candlestick Pattern:Shooting StarDark Cloud Cover(not 24 hour Forex)Bullish Piercing LineThe body of the first candle is red where the sellersare in control and the body of the second candle isgreen. In non-Forex markets, the 2nd candle gapsdown to open lower than the previous candle close,and ends up closing more than half-way through thefirst candlestick. In Forex markets, the candle opensat the close of the previous candle, trades lower andends up closing more than 50% higher.Bearish Dark Cloud CoverThe 2nd candle gaps open above the 1st candle closeand ends up closing at least 50% into the body of the1st candle. In 24 hour Forex markets there are nogaps so this pattern looks different in Forex.www.fxtradersedge.com 2014 FX Trader’s EDGE TM All Rights Reserved
Reversal Candlestick PatternsBullish and Bearish PatternsTweezer BottomCandlestick Pattern:Bullish Tweezer BottomAny two candles qualify as Tweezer Bottomsproviding they have the same price low and aresituated in a downward price trend. The twin lowprice signals support for the market traded.Shooting StarTweezer TopBearish Tweezer TopAny two candles qualify as Tweezer Tops providingthey have the same price high and are situated in anupward price trend. The twin high price signalsoverhead resistance for the market traded.www.fxtradersedge.com 2014 FX Trader’s EDGE TM All Rights Reserved
Reversal Candlestick PatternsBullish and Bearish PatternsBullish and Bearish ternsIndecisionPatternsof ofIndecision:DojisDojisCharacterized by equal open and close prices.When the Doji appears at a major trend line,channel line, key support and resistance, it is anindication of a potential reversal.www.fxtradersedge.com 2014 FX Trader’s EDGE TM All Rights Reserved
The candlestick patterns explained in this presentation are for information purposes only. Candlestick patterns are used to supplement your chart analysis . In non-Forex markets, the 2nd candle gaps down to open lower than the previous candle close, and ends up closing more than half-way through the first candlestick. In Forex markets, the .