Transcription
MARKETING ENGINEERING FOR EXCEL TUTORIAL VERSION 1.0.8TutorialBass ForecastingMarketing Engineering for Excel is a Microsoft Excel add-in. The software runs fromwithin Microsoft Excel and only with data contained in an Excel spreadsheet.After installing the software, simply open Microsoft Excel. A new menu appears,called “ME XL.” This tutorial refers to the “ME XL/Bass Forecasting Model”submenu.OverviewThe Bass forecasting model is an tool for forecasting the adoption of newproducts and new product categories. It implements the original Bass model(Bass 1969), as well as its extended version, the generalized Bass model(Bass, Krishnan, and Jain 1994). The generalized model expands on theoriginal Bass model by including the effects of advertising and price changes.The software provides two modes for calibrating the model: (1) by analogyand subsequent refinement (i.e., visual tracking) and (2) by fitting the Bassmodel to past data using nonlinear least squares (Srinivasan and Mason1986).Firms thus can use the Bass forecasting model to develop marketing programsthat estimate product sales rates for future periods on the basis of historicalsales data of the product or comparisons of the product to adoption rates ofsimilar products.BASS FORECASTING TUTORIAL1/13
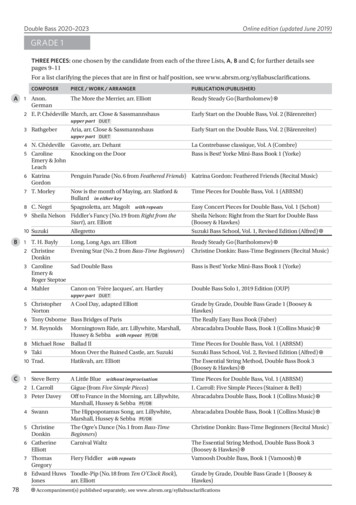
Getting startedThe Bass forecasting model allows you to use your own data directly or apreformatted template.Because Bass forecasting models require a specific data format, users withtheir own data should review the preformatted template to become familiarwith the appropriate structure.This section explains how to create an easy-to-use template to enter your own data.If you want to run Bass forecasting immediately, open the example file “OfficeStarData (Bass Forecasting, calibrated).xls” and jump to “Step 5: Running analyses.” Bydefault, the example files install in “My Documents/My Marketing Engineering/.”Step 1Creating a templateIn Excel, if you click on ME XL BASS FORECASTING MODEL CREATE TEMPLATE,the following dialog box appears. This box represents the first step in creatinga template for running the Bass forecasting model.The options are as follow: Generalized Bass Model. Click the checkbox if you want to set up thegeneralized Bass model, which includes two advanced decision variables,pricing and advertising, that determine the speed of diffusion. If thegeneralized Bass option is not checked, the template will exclude thepricing and advertising decision variables. BASS FORECASTING TUTORIALAdvertising Coefficient. The generalized Bass model assumes thatrelative changes in advertising affect the speed of adoption. If theadvertising level increases (compared with a base advertising level atthe start), potential adopters adopt faster than they would havewithout the increase in advertising. Research shows that theadvertising coefficient usually falls between 0.3 and 1.0.2/13
Price Coefficient. The generalized Bass model assumes relativechanges in price also affect the speed of adoption. If the relative pricedecreases, potential adopters adopt faster. Documented values for theprice coefficient typically range between 1.0 and 2.0. Number of Periods to Forecast. Enter the number of periods youwant to forecast. Notice that this option simply creates placeholdersfor anticipated price and advertising levels; it does not generateforecasts. Forecasting Scenarios. Running the Bass forecasting model usingdifferent estimates for adoption parameters and market potential providescomparative forecasts. This control enables you decide how manyforecasting scenarios you want to compare and creates placeholders in thespreadsheet. Past Data. This function indicates the number of periods for which youhave past data about adoption rates. If you have no past data, enter 0;you still can parameterize the model using an analogy.After completing the dialog box, click OK to generate the data template, asshown below for a generalized Bass model with 10 available past data periods.BASS FORECASTING TUTORIAL3/13
Step 2Entering your dataIn this tutorial, we use the example file “OfficeStar (Bass Forecasting).xls,” which bydefault appears in “My Documents/My Marketing Engineering/.”To view a proper data format, open that spreadsheet in Excel. A snapshot isreproduced below.A Bass forecasting spreadsheet contains different areas in which data must beentered or populated after estimations.Bass parameters Total Market Potential is the total estimated number of adopters, thatis, the total number of customers who eventually will adopt the product.This key figure needs to be supplied by the user but can be affected byother factors (see Market Growth Rate and Market Price Elasticity). Market Penetration Before Period 1 represents the total number ofpotential adopters who already have adopted. Market Growth Rate is the estimated growth rate per period. If themarket growth rate is 2% and market potential (supplied by the user)initially is 100, then market potential will be 102 in period 1, 104 in period2, 106.1 in period 3, and so forth.BASS FORECASTING TUTORIAL4/13
Market Price Elasticity (generalized Bass model only) is the percentageincrease of market potential with a 1% decrease in price. If pricedecreases, the model assumes that the product becomes more affordable,and more people become potential adopters, which then increases thetotal market potential. Advertising Coefficient (generalized Bass model only) is the percentageincrease in speed of market penetration with a 1% increase in advertising.The advertising coefficient does not change the number of potentialadopters but rather the speed at which they effectively adopt; it reflectsthe percentage increase in the speed of market acceptance with a 1%increase in advertising. (Recall that documented values for the advertisingcoefficient typically range between 0.3 and 1.) Price Coefficient (generalized Bass model only) is the percentageincrease in speed of market penetration with a 1% decrease in price. Theprice coefficient reflects the percentage increase in speed of marketacceptance with a 1% decrease in price. (Recall that documented valuesfor the price coefficient typically range between 1 and 2.)Forecasting scenarioA forecasting scenario is a placeholder that enables users to store differentparameter values for the three key elements of the Bass model and thencompare adoption forecasts. Total Market Potential is the total market size in units for the market.By default, any change in cell C3 automatically gets reported here; youthus can change the value manually in this cell. Parameter p represents the propensity to adopt, independent of howmany customers have previously adopted, also referred to as the“innovation” component of the model. Parameter q represents the propensity to adopt as a function of thenumber of existing adopters, also referred to as the “imitation” componentof the model.The Bass forecasting model provides two forms of assistance for completing theestimated values for p and q. The first method analyzes past data and infers actualvalues through statistical estimation. The second approach uses analogy, that is, pand q values estimated from other products that resemble the one underinvestigation. Please refer to sections “Step 3: Estimating parameters using analogy”and “Step 4: Estimating parameters from past data.”Past dataPast data placeholders appear only if you previously selected the Past Dataoption. For each period, enter the number of adoptions for that period; thetotal (accumulated adoptions) through that period get updated automatically.Price and advertising dataThese placeholders appear only if you previously selected the generalized Bassmodel. For each prior period (if past data exist) and future period (ifforecasting periods are greater than 0), enter the relative price and advertisinglevels compared with the first period. A relative price level of 1.2 indicates thatprice increased by 20% compared with the price level of 1.0 during the firstperiod. The first row reveals the “level” of price and advertising. All otherentries are relative to the first row. For example, if price is set to 50 in the firstrow, it might be 49 (decrease) or 51 (increase) in the next period.BASS FORECASTING TUTORIAL5/13
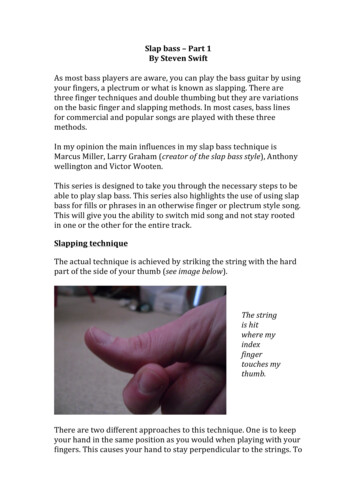
Step 3Estimating parameters using analogyThe Bass forecasting model in ME XL provides two methods of estimating thenecessary values for p and q. The first method estimates parameters usinganalogies to other products for which the parameters already have beenestimated.In Excel, if you click on ME XL BASS FORECASTING MODEL ESTIMATEPARAMETERS USING ANALOGY, the following dialog box will open:Use the scroll bar to move through the product categories and select a productthat is close in characteristics to the product you are forecasting. Click OK toaccept the p and q values for that product. You can also search subcategoriesof products, such as “Consumer Electronics,” to find more analogous productsto the one for which you want to estimate the penetration rate.When you click OK, you must select a forecasting scenario placeholder, or cellrange, to copy the p and q parameters in your spreadsheet. If using aMarketing Engineering for Excel template, the destination cells for yourselection will be preselected within the Forecasting Scenario portion of thetemplate. If you are not using a template, you must select the appropriatedestination cells.If you want to run the analysis with different parameters estimated fromvarious products, repeat these steps for each scenario in your model topopulate the p and q values for forecasting.BASS FORECASTING TUTORIAL6/13
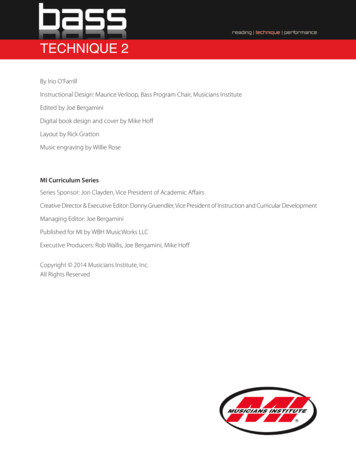
Step 4Estimating parameters from past dataThe second way to estimate p and q parameters analyzes past data (ifavailable) and statistically infers parameter estimates. In Excel, if you click onME XL BASS FORECASTING MODEL ESTIMATE PARAMETERS FROM PAST DATA, thefollowing dialog box opens:This dialog box begins the analysis process of determining the appropriate pand q values for your model on the basis of the past data you have available.Determine whether you want to generate a diagnostic workbook at the end ofthe analysis and whether you are using the generalized Bass model, and thenclick Next to begin the analysis.Several dialog boxes ask you to select the Bass parameters (three rows in thesimple Bass model; six rows in the generalized Bass model), past data(including relative price and advertising levels in the generalized Bass model),and the destination cell range for the output (estimated) parameters.BASS FORECASTING TUTORIAL7/13
If you have selected the Generate Template option of Marketing Engineeringfor Excel, the appropriate ranges are preselected.If you select the option and click OK, the newly generated workbook includestabs showing the values generated by the Bass forecasting model on the basisof your past data. The p and q values are stored automatically in the cells youselected in your original (template) workbook. (Note: You may use acombination of data by analogy and past data to complete your forecastingscenario and then compare the different parameterizations.)Step 5Running analysesTo run the forecasting analyses, your spreadsheet should now contain: Bass parameters: A list of three key parameters (or six for thegeneralized Bass model, as shown below). Forecasting scenario: Different parameter estimates of total marketpotential, p and q, for which the parameters have been estimated eitherusing analogy (see Step 3) or statistical analysis of past data (see Step 4). Past data, if available. Relative price and relative advertising: Levels (in the generalized Bassmodel) reflecting not only past data (if available) but also future periods(estimations) to indicate the effects of the most likely future changes inprice and advertising levels on rate of adoption and market potential.BASS FORECASTING TUTORIAL8/13
After entering the data in an Excel spreadsheet with the appropriate format,click on ME XL BASS FORECASTING MODEL RUN ANALYSIS. The dialog box thatappears enables you to set the options to perform a Bass forecasting analysisof your data.BASS FORECASTING TUTORIAL9/13
Options Generalized Bass Model is preselected if you previously specified thegeneralized Bass model. Plot adoptions from past periods are available if your spreadsheetcontains past data. If this option is checked, generated charts contain notonly forecasts but also past data. You must select the cell ranges thatcontain this data. If you specified Past Data in your template, these cellswill be preselected. Forecasting specifies the number of periods being forecast. For thesimple Bass model, you may enter as many periods as you would like, butin the generalized Bass model, the forecasts require additional data aboutfuture price and relative advertising levels, so the highest levels of thisfield should equal the number of periods for which you have supplied suchdata. Sensitivity analysis allows you to run forecasting analyses by slightlyperturbing p, q, and/or the market potential variables for each forecastingscenario. This feature is particularly useful in cases in which you want todetermine if the forecasts are highly sensitive to small changes in someparameters. The chosen sensitivities get charted in the output.After selecting the desired options, click “Next ”. The software presents threedialog boxes that enable you to select the data on which to perform theanalysis. If you have used the Generate Template option, the cell ranges arepreselected.BASS FORECASTING TUTORIAL10/13
If you are running the generalized Bass model, a fourth and final dialog boxwill prompt you to select future relative price and advertising levels. Thesimple Bass model does not require such data to run.After clicking OK, a diagnosis spreadsheet is created, with the forecasts madeby the Bass model.Step 6Interpreting the resultsForecasting scenariosThe first sheet contains forecasts for the different scenarios, along with pastdata when available.BASS FORECASTING TUTORIAL11/13
The results are also plotted on the next chart.BASS FORECASTING TUTORIAL12/13
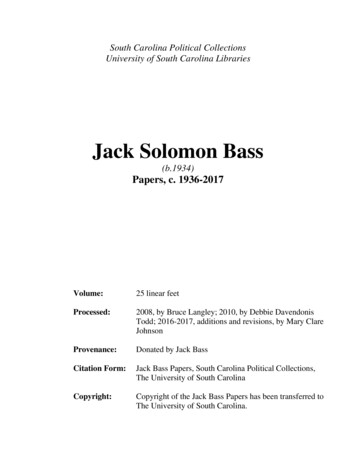
Sensitivity analysisIf the option is checked, several charts also output the forecasts by varyingsome parameters. This analysis helps identify those parameters that mostaffect the forecasts.In the above chart, slightly varying the p parameter (fuchsia and yellow lines)drastically change the rate of adoptions, while modifying the q parameter haslittle impact.BASS FORECASTING TUTORIAL13/13
Tutorial Bass Forecasting Marketing Engineering for Excel is a Microsoft Excel add-in. The software runs from within Microsoft Excel and only with data contained in an Excel spreadsheet. After installing the software, simply open Microsoft Excel. A new menu appears, called "ME XL." This tutorial refers to the "ME XL/Bass Forecasting Model"