Transcription
Alcohol intake, wine consumption and thedevelopment of depression: the PREDIMED studyGea et al.Gea et al. BMC Medicine 20132013, 92
Gea et al. BMC Medicine 2013, 2RESEARCH ARTICLEOpen AccessAlcohol intake, wine consumption and thedevelopment of depression: the PREDIMED studyAlfredo Gea1, Juan J Beunza2, Ramón Estruch3,4, Almudena Sánchez-Villegas3,5, Jordi Salas-Salvadó3,6,Pilar Buil-Cosiales7, Enrique Gómez-Gracia3,8, María-Isabel Covas3,9, Dolores Corella3,10, Miquel Fiol3,11,Fernando Arós3,12, José Lapetra3,13, Rosa-María Lamuela-Raventós3,14, Julia Wärnberg3,8, Xavier Pintó3,15,Lluis Serra-Majem3,5 and Miguel A Martínez-González1,3*, for the PREDIMED GROUPAbstractBackground: Alcoholic beverages are widely consumed. Depression, the most prevalent mental disorderworldwide, has been related to alcohol intake. We aimed to prospectively assess the association between alcoholintake and incident depression using repeated measurements of alcohol intake.Methods: We followed-up 5,505 high-risk men and women (55 to 80 y) of the PREDIMED Trial for up to sevenyears. Participants were initially free of depression or a history of depression, and did not have any history ofalcohol-related problems. A 137-item validated food frequency questionnaire administered by a dietician wasrepeated annually to assess alcohol intake. Participants were classified as incident cases of depression when theyreported a new clinical diagnosis of depression, and/or initiated the use of antidepressant drugs. Cox regressionanalyses were fitted over 23,655 person-years.Results: Moderate alcohol intake within the range of 5 to 15 g/day was significantly associated with lower risk ofincident depression (hazard ratio (HR) and 95% confidence interval (95% CI) 0.72 (0.53 to 0.98) versus abstainers).Specifically, wine consumption in the range of two to seven drinks/week was significantly associated with lowerrates of depression (HR (95% CI) 0.68 (0.47 to 0.98)).Conclusions: Moderate consumption of wine may reduce the incidence of depression, while heavy drinkers seemto be at higher risk.Keywords: Wine, Alcohol, Depression, CohortBackgroundMost cultures and countries include alcoholic beveragesas part of their usual diet. Alcohol intake is differentover world regions regarding the habitual type of beverageand the pattern of consumption (frequency and averageintake). In general terms, the consumption of alcoholicbeverages is increasing worldwide [1]. Unipolar depressionis the most prevalent mental disorder in the world and itis increasing steadily [2].The simultaneous presence of alcohol-related problemsand depression is common [3]. However, problematic* Correspondence: mamartinez@unav.es1Department of Preventive Medicine and Public Health, Medical SchoolClinica Universidad de Navarra, Pamplona, Spain3CIBER Fisiopatología de la Obesidad y Nutrición (CIBERObn), Instituto deSalud Carlos III, Madrid, SpainFull list of author information is available at the end of the articleintake needs to be distinguished from moderate intake.Problematic alcohol intake may be associated with depression not only because of increased intake of ethanol butalso because of other alcohol-related unhealthy lifestyles orbecause of the social environment surrounding problematicdrinkers (job loss, family problems, financial problems orother addictions). Any of these circumstances may be apotential trigger for depression, even in the absence of aspecific detrimental role for ethanol.Unipolar depression and cardiovascular disease are likelyto share some common pathophysiological mechanisms.Moderate alcohol intake, especially alcohol from wine, hasbeen repeatedly reported to be inversely associated withthe incidence of cardiovascular disease [4-6]. Some of theresponsible mechanisms for this inverse association arelikely to be involved also in a reduced risk of depression 2013 Gea et al.; licensee BioMed Central Ltd. This is an Open Access article distributed under the terms of the CreativeCommons Attribution License (http://creativecommons.org/licenses/by/2.0), which permits unrestricted use, distribution, andreproduction in any medium, provided the original work is properly cited.
Gea et al. BMC Medicine 2013, 2Page 2 of 10[7,8]. In the existing literature about non-problematicalcohol use and depression, longitudinal studies are inconsistent [9-20]. However, none of them has investigated thespecific role of each beverage. Neither have they usedrepeated measurements on alcohol intake during follow-upto update the information on exposure to alcohol.We prospectively evaluated the incidence of depressionamong light to moderate drinkers from an older Mediterranean cohort at high cardiovascular risk using repeatedmeasurements of intake. An interesting characteristicof this population is that wine was the most frequentlyconsumed alcoholic beverage. We also evaluated specifically the association of wine with incident depression, usingrepeated measurements of wine consumption.with the number ISRCTN 35739639 [24]. All participantsprovided written informed consent.Out of 7,447 participants, we excluded 153 participantswith total energy intake out of predefined limits (800 and4,000 Kcal/day for men and 500 and 3,500 Kcal/dayfor women) [25]. Another 1,579 subjects who reported atbaseline prevalent depression, previous history of depressionor use of antidepressant drugs were also excluded (toensure the temporal sequence and, therefore, avoid reversecausation bias). Additionally, 210 participants were lost tofollow-up or did not have alcohol information andwere also excluded. Finally, a subsample of 5,505 participants was included in the analyses of the present study(Additional file 1).MethodsExposure assessmentSubjectsWe assessed participants from the PREDIMED Study(“Prevención con Dieta Mediterránea” (Prevention withMediterranean Diet)), which is a large, parallel-group,randomized, multicenter, controlled, clinical trial conductedin Spain. The aim of the PREDIMED trial was to assessthe effect of the Mediterranean diet on the primaryprevention of cardiovascular disease (www.predimed.es;www.predimed.org) [21].Participants were men and women aged 55 to 80 and 60to 80 years, respectively. They were free of cardiovasculardisease at baseline and met at least one of the two followingcriteria: type 2 diabetes mellitus or the presence of threeor more coronary heart disease risk factors.Previous history of cardiovascular disease, any severechronic illness, history of food allergy, intolerance toolive oil or nuts, drug addiction or chronic alcoholismwere exclusion criteria in the PREDIMED trial. Subjectswere screened for problematic use of alcohol using theCAGE questionnaire (a four-item screening tool) [21] andthey were not included in the trial if they answeredpositively to at least two questions on this questionnaire.Participants who met the previous inclusion criteria(n 7,447) were randomly assigned to three interventions:Mediterranean diet supplemented with extra virgin oliveoil, Mediterranean diet supplemented with mixed nuts ora control group. They were annually interviewed by adietician, obtaining information about lifestyle, diet andincident diseases. Further aspects of the methods anddesign of the PREDIMED trial have been reported elsewhere in detail [22,23]. The Research and Ethic Committeeof the Hospital Clínic (Barcelona, Spain), accredited by theDepartment of Health and Human Services and regulatedby the Federalwide Assurance for the Protection of HumanSubjects of International (Non-US) Institutions # 00000738approved the study protocol on 16 July 2002. This trial hasbeen registered in the London Current Controlled TrialsAlcohol intake was assessed at baseline with a validated137-item semi-quantitative food-frequency questionnaire(FFQ), which included nine questions on consumptionof different alcoholic beverages (different types of wine,beer and spirits). In the validation study for the Spanishversion of this questionnaire, the intra-class correlationcoefficient between alcohol intake from the FFQ andrepeated food records was 0.82 [26]. This FFQ wasrepeatedly administered each year during follow-up.In order to update alcohol information, we consideredalcohol intake using repeated measurements of diet fromall available FFQs. Participants were divided into fourgroups according to their alcohol intake: abstainers,those who reported drinking less than 5 g/day, those withan intake ranging from 5 to 15 g/day, and the fourthgroup with an intake higher than 15 g/day.To assess the specific role of wine, participants weredivided into five groups according to their average numberof weekly drinks of wine: abstainers, less than one drink/week, one to less than two drinks/week, two to sevendrinks/week, and more than seven drinks/week. Participants who did not drink wine but drank other types ofalcoholic beverages were excluded from these specificanalyses.Outcome assessmentAn incident case of depression was defined as a diagnosisof depression made by a physician and reported by participants in any of the follow-up interviews, or a positivereport of habitual use of antidepressant drugs.Confounder assessmentWe obtained information about medical, socio-demographic, anthropometric and lifestyle variables withstandardized questionnaires (see www.predimed.es) atthe baseline interview.
Gea et al. BMC Medicine 2013, 2Statistical analysisCox regression models were used to assess the relationshipbetween categories of baseline alcohol intake and thesubsequent incidence of depression during follow-up.Hazard ratios (HR) and their 95% confidence intervals(95% CI) were calculated using the abstainers group asthe reference category. Entry time was defined as thedate at recruitment. Exit time was defined as the date atdiagnosis of depression for cases and, for participants whodid not develop depression, as the date when completingthe last interview, 1 December 2010, or date at death,whichever came first. We adjusted the multivariable modelsfor the following potential confounders: age, sex, smokingstatus (non-smokers, ex-smokers and current smokers),physical activity (MET-min/d), total energy intake (Kcal/day), baseline body mass index (kg/m2), marital status(married or not), intervention group (Mediterranean diet virgin olive oil, Mediterranean diet nuts, low fat diet),recruiting center (14 centers), educational level (in fivecategories from illiterate to university graduate), andnumber of persons living at home (living alone or not).We evaluated the interaction between sex and alcoholintake on the development of depression by calculatingthe likelihood ratio test between the fully adjusted modeland the same model adding the interaction product-term.To take advantage of the yearly repeated measurements ofdiet, we updated the calculation of alcohol intake forparticipants every year from baseline to the incidence ofdepression from the repeated FFQs. To update alcoholintake with all available longitudinal data, and to analyzethe association between alcohol intake and depressionat all time-points simultaneously, we used generalizedestimating equations (GEE) with Stata 12.0 (StataCorp,College Station, TX, USA). We assumed a binomial distribution with logit models and the unstructured matrixas the working correlation structure [27]. We definedthe cohort risk as participants who remained free ofdepression at the beginning of each two-year follow-upperiod. Participants who had been classified as incidentcases were excluded from subsequent follow-up. Then,only the first incident case of depression was consideredas outcome. In the analysis of repeated measurements,to allow for a sufficiently long follow-up period, wemodeled the incidence of depression in relation to thecumulative average alcohol intake from all availabledietary questionnaires up to the start of each two-yearfollow-up interval, but we excluded cases occurring inthe first year of that period and took into account onlynew cases occurring after one year. For example, for aparticipant recruited in 2005 the incidence of depressionfrom 2007 through 2008 was related to the alcohol intakereported on the 2005 and 2006 questionnaires. Therefore,we assumed, an induction period longer than one yearbut not longer than two years and alcohol intake wasPage 3 of 10considered as the cumulative average of all available FFQs,from baseline to the beginning of each two-year follow-upperiod. Several sensitivity analyses were conducted refitting Cox regression analyses after a) establishing the 1stand the 99th or b) the 5th and 95th percentiles of energyintake as allowable limits, c) after excluding diabetics, d)after excluding participants older than 75 years, e) afterexcluding participants younger than 65 years, f ) afterdepurating the abstainers’ group (excluding participantswho reported any alcohol intake throughout their life butnot currently at baseline), g) after including participantswith a prior history of depression at baseline and includingthis variable in the multiple adjusted model, and h) afterestablishing a two- to three-year induction period (insteadof one to two years) between exposure and outcome inthe repeated measurement analyses. Moreover, to assessthe influence of wine consumption on the development ofdepression, we conducted both Cox regression and GEEanalyses, using abstainers as the reference category. In theseanalyses, we adjusted for the same potential confounders asmentioned above, and also for alcohol intake from othersources. Additionally, we re-ran the analyses for wineconsumption among only-wine drinkers to control forconfounding by other alcoholic beverages.Moreover, we evaluated the potential non-linear association between alcohol intake and incident depression withthe use of restricted cubic splines, for participants drinkingno more than 80 grams of alcohol per day (99.42% ofparticipants) [28].Finally, we examined the incidence and recovery fromdepression applying fixed-effects regression as suggestedby Fergusson et al. [29] to control for observed and nonobserved factors that do not vary for a subject over time.ResultsThe main characteristics of the 5,505 participants (2,683males and 2,822 females) according to their total alcoholintake are shown in Table 1. As mentioned before, thisMediterranean population consisted of older men and women, with a mean age of 67 years. Higher alcohol intakewas positively associated with being male (88% of participants drinking more than 15 g/day were male), practicingmore leisure-time physical activity, being a current or former smoker, having higher total energy intake, being married, but it was inversely associated with educational level.A total of 443 incident cases of depression were identified during the follow-up period, which accrued 23,655person-years.The Cox regression analysis using baseline alcohol intakeas exposure showed an inverse association between totalalcohol intake and the incidence of depression, with no significant linear or quadratic trend in the multiple-adjustedanalyses. In the multiple-adjusted model, only the association for the category of low-to-moderate intake ( 5 to 15
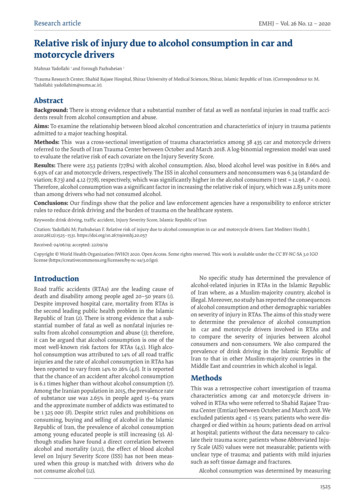
Gea et al. BMC Medicine 2013, 2Page 4 of 10Table 1 Baseline characteristics of participants according to baseline alcohol intakeAlcohol intake categories (g/day)N0 0 to 5 5 to 15 151,8181,3561,2791,052Sex (female %)78593812Age (years)68.5 (6.1)67.0 (6.1)66.4 (6.2)65.6 (6.1)BMI (kg/m2)30.3 (4.1)30.0 (3.9)29.4 (3.5)29.3 (3.3)Leisure time physical activity (MET-min/d)201 (210)230 (232)267 (276)318 (270)Secondary school or higher (%)13232836Current smokers (%)7121729Former smokers (%)15243644Marital status (% married)71788489Living alone (%)12975Total energy intake (Kcal/day)2,054 (511)2,184 (509)2,330 (511)2,595 (533)Alcohol (g/day)-2.0 (1.4)9.8 (2.7)35 (17)Wine (g alcohol/day)-1.3 (1.4)7.4 (3.7)25 (16)Beer (g alcohol/day)-0.5 (0.9)1.7 (2.7)4.8 (8.4)Spirits (g alcohol/day)-0.2 (0.5)0.6 (1.5)4.2 (8.8)Mean and Standard Deviations, or %. The PREDIMED Study 2003 to 2010. BMI, body mass index; MET, metabolic equivalent task.g/day) remained statistically significant (HR (95% CI) 0.72 (0.53 to 0.98)) (Table 2). Examining the association forthose participants who drank more than 40 g/day, wefound that they were at higher risk but this association wasnot statistically significant, probably due to the small number of heavy drinkers (HR (95% CI 1.34 (0.69 to 2.59)).In the repeated-measurement analyses using as exposurethe yearly updated information on alcohol intake, weobserved a stronger inverse association. We found astatistically significant inverse association for light drinkers( 0 to 5 g/day) with a relative risk (95% CI) of 0.73 (0.57 to0.95) and also for low-to-moderate drinkers ( 5 to 15g/day) with a relative risk of 0.69 (0.50 to 0.96). Wefound no effect modification of alcohol intake by sex(P 0.45). Although the interaction was non-significant,we re-ran the analyses separately for men and women totake into account biological differences between the sexes.The results are available in the supplementary material(Additional file 2).To account for a non-linear association, we used restricted cubic spline analysis. The U-shaped associationfound, represented in Figure 1, showed a consistent protection against incident depression for baseline moderatealcohol intake.Table 2 Risks of depression according to categories of daily alcohol intakeAlcohol intake categories (g/day)0 0 to 5 5 to 15 1579/5,39055/4,760P for liner trendaBaseline alcohol intakeCases/Person-years195/7,777114/5,728Crude model1 (Ref.)0.79 (0.63 to 1.00)0.59 (0.46 to 0.77)0.44 (0.33 to 0.60) 0.001Age and sex-adjusted1 (Ref.)0.91 (0.72 to 1.15)0.81 (0.62 to 1.07)0.81 (0.58 to 1.14)0.347Multiple-adjusted modelc1 (Ref.)0.97 (0.75 to 1.25)0.72 (0.53 to 0.98)0.79 (0.53 to 1.16)0.522Updated alcohol intakebCrude model1 (Ref.)0.63 (0.49 to 0.81)0.49 (0.37 to 0.66)0.37 (0.26 to 0.52) 0.001Age and sex-adjusted1 (Ref.)0.73 (0.56 to 0.94)0.71 (0.52 to 0.97)0.71 (0.48 to 1.05)0.727Multiple-adjusted modelc1 (Ref.)0.73 (0.57 to 0.95)0.69 (0.50 to 0.96)0.69 (0.46 to 1.04)0.773aHazard ratios (95% confidence intervals) for incident depression according to categories of baseline daily alcohol intake.bRelative risks (95% confidence intervals) for categories of updated alcohol intake, using repeated measurements of diet during follow-up. To avoid reversecausality bias, an induction period of at least one year, but no longer than two years was assumed. We considered as incident cases of depression those occurringonly during the second year of every two-year follow-up interval.cAdjusted for age, sex, smoking, physical activity (MET-min/d), total energy intake (Kcal/day), baseline body mass index (kg/m2), marital status, intervention group,recruiting center, educational level and the number of persons living at home.The PREDIMED Study 2003 to 2010.
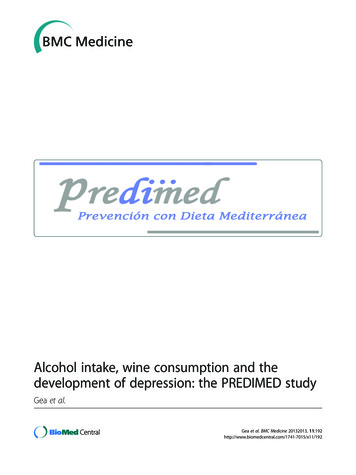
Gea et al. BMC Medicine 2013, 2Figure 1 Dose–response relationship between alcohol intake(g/day) and depression risk (HR and 95% CI). Restricted cubicspline model. The PREDIMED Study 2003 to 2010. The black linerepresents the HR and the dashed lines represent the 95%confidence interval. Adjusted for age, smoking, physical activity(MET-min/d), total energy intake (Kcal/day), baseline body massindex (kg/m2), marital status, intervention group, recruiting center,educational level and the number of persons living at home.Drinking wine (two to seven drinks/week) was inverselyassociated with the incidence of depression (Table 3). Inthe multiple-adjusted model, we found a HR (95% CI) of0.68 (0.47 to 0.98) for the baseline consumption of two toseven drinks/week of wine. Using repeated measurementsto update wine consumption, we also observed a strengthening of this inverse association with a relative risk of 0.57(0.40 to 0.79) for those who drank two to seven drinks/week of wine. In our sample, 1,350 participants were onlywine drinkers. Among them the results were consistentwith those previously discussed (Table 3). Wine consumption accounted for 82% of alcohol intake variability in thissample. The number of only-beer drinkers was just 308and the number of only-spirits drinkers was 61. Only1.63% of participants drank more than one drink/day ofbeer, and only 0.09% of spirits. Consequently, we couldnot do for beer or spirits the type of separate analysis thatwe did for wine. In order to investigate possible sources ofbias in the estimation of the relationship between alcoholintake and depression, we conducted several sensitivityanalyses (Table 4). Results did not substantially changeexcept when excluding diabetics and for other analyseswith a substantial number of exclusions, probably due to alack of statistical power.Results were also consistent when we investigated theincidence and recovery from depression using fixed-effectsmodels (Additional file 3).DiscussionWe found that total low-to-moderate alcohol drinking(5 to 15 g/day) was associated with lower risk of depression.Page 5 of 10A stronger inverse association was found for low-to-moderate wine-drinkers (two to seven glasses/week).These results seem paradoxical as previous studies founda direct association between alcohol in higher amounts,especially Alcohol Use Disorders (AUD), and depressivesymptoms, [11,17-20,30]. However, lower amounts of alcohol intake might exert a protection as it has been observedfor coronary heart disease (CHD). In fact, it is believed thatdepression and CHD share common pathophysiologicalmechanisms [30,31]. Only one previous cohort, includingparticipants with a high educational level, assessed lowto-moderate levels of intake and found a similar inverseassociation (HR (95% CI); 0.65 (0.49 to 0.86)) for thesame range of exposure 5 to 15 g/day that we have observed [9]. The results of our study and that previouscohort are, therefore, closely consistent. The practicalabsence of heavy drinkers in our sample and in that cohort, together with the large proportion of participantsexposed to low-to-moderate intakes are likely explanations for the diverging results with respect to cohortsincluding heavy drinkers. The results of those studieshave to be carefully interpreted. In several previouscross-sectional studies, a strong positive association wasfound. Therefore, the definition of a clear temporal sequence is necessary to preclude the possibility of a reversecausation bias [3]. Some longitudinal studies have assessedthe reverse direction of this association, that is, the consequences of depression on alcohol intake. They have founddirect associations; subjects with depression tend to increase their alcohol intake as a consequence of their mooddisorder [2]. Therefore, in some cross-sectional analyses,the positive association found is likely to be the result ofthe direct effect of depression on alcohol intake, which mayovercome the possible inverse association between low-to-moderate alcohol intake and depression risk. They canalso capture the detrimental effects of higher amounts ofalcohol intake on depression risk. In contrast, in a longitudinal analysis, the temporal sequence is preserved, and reverse causation bias is less likely. In order to minimizethe risk of that bias, we assumed an induction period of atleast one year and we conducted a sensitivity analysis assuming an alternative induction period of two to threeyears in the repeated measurement analyses. Early casesmay be subclinical cases of depression at the beginning ofthe interval and may correspond to subjects who changedtheir alcohol intake before developing overt clinical depression. The fact that the results of these sensitivity analysesare consistent with the main results gives further supportto our findings. Moreover, incident cases of depression didnot change their alcohol intake differently from those whowere not incident cases (P 0.1; data not shown).The differences between our results and those of previousstudies could also be explained by the different averagealcohol intake between populations, the different pattern
Gea et al. BMC Medicine 2013, 2Page 6 of 10Table 3 Risks of depression according to weekly wine consumptionWine: drinks/weekAbstainers 11 to 22 to 7 7Baseline wine 1,70857/3,18332/6,828Age and sex-adjusted model1 (Ref.)1.05 (0.78 to 1.42)0.82 (0.55 to 1.22)0.75 (0.54 to 1.05)0.79 (0.60 to 1.04)Multiple-adjusted modelc1 (Ref.)1.00 (0.72 to 1.39)0.93 (0.61 to 1.43)0.70 (0.48 to 1.00)0.78 (0.57 to 1.06)Multiple-adjusted modeld1 (Ref.)0.99 (0.71 to 1.37)0.92 (0.60 to 1.41)0.68 (0.47 to 0.98)0.76 (0.56 to 1.04)bUpdated wine consumptionAge-adjusted model1 (Ref.)0.64 (0.46 to 0.89)0.86 (0.58 to 1.27)0.59 (0.43 to 0.82)0.70 (0.48 to 1.02)cMultiple-adjusted model1 (Ref.)0.64 (0.46 to 0.89)0.87 (0.58 to 1.29)0.57 (0.41 to 0.80)0.68 (0.46 to 1.01)Multiple-adjusted modeld1 (Ref.)0.63 (0.46 to 0.89)0.86 (0.58 to 1.28)0.57 (0.40 to 0.79)0.66 (0.45 to 0.99)25/1,36326/2,236aBaseline wine consumption (Only 3/752Age-adjusted model1 (Ref.)1.13 (0.80 to 1.59)0.79 (0.45 to 1.38)0.86 (0.56 to 1.30)0.59 (0.39 to 0.90)Multiple-adjusted modelc1 (Ref.)1.18 (0.81 to 1.72)0.91 (0.49 to 1.69)0.81 (0.50 to 1.30)0.55 (0.35 to 0.87)Updated wine consumption (Only wine-drinkers)bAge-adjusted modelcMultiple-adjusted model1 (Ref.)0.54 (0.34 to 0.87)0.93 (0.52 to 1.66)0.58 (0.36 to 0.92)0.52 (0.24 to 1.14)1 (Ref.)0.55 (0.34 to 0.87)0.93 (0.52 to 1.66)0.57 (0.36 to 0.92)0.52 (0.23 to 1.18)aHazard ratios (95% confidence intervals) for incident depression according to categories of baseline daily alcohol intake.bRelative risks (95% confidence intervals) for categories of updated alcohol intake, using repeated measurements of diet during follow-up. To avoid reversecausality bias, an induction period of at least one year, but no longer than two years was assumed. We considered as incident cases of depression those occurringonly during the second year of every two-year follow-up interval.cAdjusted for age, smoking, physical activity (MET-min/d), total energy intake (Kcal/day), baseline body mass index (kg/m2), marital status, intervention group,recruiting center, educational level and the number of persons living at home.dAdding alcohol from sources other than wine to the previous multiple-adjusted model.The PREDIMED Study 2003 to 2010.of consumption and especially because the predominanttype of beverage consumed is different, wine being thepreferential beverage in our cohort. The PREDIMEDtrial includes an older, traditional Spanish Mediterraneanpopulation, that consumed chiefly wine, and mainly in acontext of socialization with family or friends. Subjectswith problematic use of alcohol ( 2 positive answers inthe CAGE questionnaire) [21] were explicitly excludedfrom this trial because this was one of the exclusion criteria.Moreover, they were in a trial where an intervention witha Mediterranean diet was done, including the advice toconsume wine moderately only for those who werealready wine drinkers at inception. However, the intervention designed for this trial did not attain any significantTable 4 Sensitivity analysesTotal cases/person-years 5 to 5 g/dayOverall443/23,6550.72 (0.53 to 0.98)Energy limits: percentiles 5 to 95403/21,6810.78 (0.57 to 1.06)Energy limits: percentiles 1 to 99444/23,6750.71 (0.53 to 0.96)Excluding diabetics227/11,6530.96 (0.64 to 1.44)Excluding participants older than 75389/21,2000.73 (0.56 to 1.25)Excluding participants younger than 65307/14,7850.75 (0.52 to 1.06)Depurating abstainers’ groupa422/22,8820.75 (0.55 to 1.02)Including participants with prior depression at baseline817/25,8680.72 (0.57 to 0.90)Updated alcohol intake assuming induction period: 1 to 2 yearsb-0.69 (0.50 to 0.96)Updated alcohol intake assuming induction period: 2 to 3 yearsb-0.68 (0.47 to 1.00)aAfter excluding those participants who reported any alcohol intake throughout their life but not currently at baseline.bRepeated-measurement analysis. Relative risks (95% confidence interval) for incident depression according to yearly updated measurements of alcohol intake.Considering incident cases during the last year of every two-year follow-up interval.The PREDIMED Study 2003 to 2010.All adjusted for age, sex, smoking, physical activity (MET-min/d), total energy intake (Kcal/day), baseline body mass index (kg/m2), marital status, interventiongroup, recruiting center, educational level, the number of persons living at home and alcohol intake at baseline.
Gea et al. BMC Medicine 2013, 2change in average levels of alcohol intake ( 1.4 g/day, 1.4g/day, and 0.9 g/day in the Mediterranean diet virginolive oil, Mediterranean diet nuts and control groups, respectively) without any between-group significant difference. In addition, the Mediterranean diet has also beenassociated with lower incidence of depression [32]. Therefore, dummy variables for the two active interventiongroups were included in the multiple-adjusted model aspotential confounders.The relationship between alcohol intake and depressionis biologically different among men and women [20,33,34].For instance, alcohol bioavailability is different betweensexes [35], and women seem to be more likely to developdepression [36]. Therefore, we presented the analyses stratified by sex despite there being no evidence of statisticalinteraction by sex.Besides the sensitivity analysis mentioned above, weconducted eight other sensitivity analyses to explorefurther potenti
Mediterranean diet supplemented with extra virgin olive oil, Mediterranean diet supplemented with mixed nuts or a control group. They were annually interviewed by a dietician, obtaining information about lifestyle, diet and incident diseases. Further aspects of the methods and design of the PREDIMED trial have been reported else-where in detail .