Transcription
Wang et al. Lipids in Health and Disease(2020) SEARCHOpen AccessA high fat diet with a high C18:0/C16:0ratio induced worse metabolic andtranscriptomic profiles in C57BL/6 miceLiqiang Wang1†, Fei Xu1,2†, Zhenfeng Song3, Dan Han1, Jingyi Zhang1,2, Linjun Chen1 and Lixin Na1,2,3*AbstractBackground: Differential effects of individual saturated fatty acids (SFAs), particularly stearic acid (C18:0), relative tothe shorter-chain SFAs have drawn interest for more accurate nutritional guidelines. However, specific biologic andpathologic functions that can be assigned to particular SFAs are very limited. The present study was designed tocompare changes in metabolic and transcriptomic profiles in mice caused by a high C18:0 diet and high palmiticacid (C16:0) diet.Methods: Male C57BL/6 mice were assigned to a normal fat diet (NFD), a high fat diet with high C18:0/C16:0 ratio(HSF) or an isocaloric high fat diet with a low C18:0/C16:0 ratio (LSF) for 10 weeks. An oral glucose tolerance test,72-h energy expenditure measurement and CT scan of body fat were done before sacrifice. Fasting glucose andlipids were determined by an autobiochemical analyzer. Blood insulin, tumor necrosis factor-α (TNF-α), andinterleukin-6 (IL-6) levels were measured by enzyme-linked immunosorbent assay methods. Free fatty acids (FFAs)profiles in blood and liver were determined by using gas chromatography-mass spectrometry. Microarray analysiswas applied to investigate changes in transcriptomic profiles in the liver. Pathway analysis and gene ontologyanalysis were applied to describe the roles of differentially expressed mRNAs.Results: Compared with the NFD group, body weight, body fat ratio, fasting blood glucose, insulin, homeostasismodel assessment of insulin resistance (HOMA-IR), triglyceride, IL-6, serum and liver FFAs including total FFAs, C16:0and C18:0 were increased in both high fat diet groups and were much higher in the HSF group than those in theLSF group. Both HSF and LSF mice exhibited distinguishable long non-coding RNA (lncRNA), microRNA and mRNAexpression profiles when compared with those of NFD mice. Additionally, more differentially expressed lncRNAsand mRNAs were observed in the HSF group than in the LSF group. Some biological functions and pathways, otherthan energy metabolism regulation, were identified as differentially expressed mRNAs between the HSF group andthe LSF group.(Continued on next page)* Correspondence: nalixin2003@163.com†Liqiang Wang and Fei Xu contributed equally to this work.1Food Hygiene and Nutrition Department, Shanghai University of Medicine &Health Science, Shanghai 201318, P. R. China2Collaborative Innovation Center for Biomedicine, Shanghai University ofMedicine & Health Science, Shanghai 201318, P. R. ChinaFull list of author information is available at the end of the article The Author(s). 2020 Open Access This article is licensed under a Creative Commons Attribution 4.0 International License,which permits use, sharing, adaptation, distribution and reproduction in any medium or format, as long as you giveappropriate credit to the original author(s) and the source, provide a link to the Creative Commons licence, and indicate ifchanges were made. The images or other third party material in this article are included in the article's Creative Commonslicence, unless indicated otherwise in a credit line to the material. If material is not included in the article's Creative Commonslicence and your intended use is not permitted by statutory regulation or exceeds the permitted use, you will need to obtainpermission directly from the copyright holder. To view a copy of this licence, visit http://creativecommons.org/licenses/by/4.0/.The Creative Commons Public Domain Dedication waiver ) applies to thedata made available in this article, unless otherwise stated in a credit line to the data.
Wang et al. Lipids in Health and Disease(2020) 19:172Page 2 of 13(Continued from previous page)Conclusion: The high fat diet with a high C18:0/C16:0 ratio induced more severe glucose and lipid metabolicdisorders and inflammation and affected expression of more lncRNAs and mRNAs than an isocaloric low C18:0/C16:0 ratio diet in mice. These results provide new insights into the differences in biological functions and relatedmechanisms, other than glucose and lipid metabolism, between C16:0 and C18:0.Keywords: High fat diet, Palmitic acid, Stearic acid, Metabolic profile, Transcriptomic profile, Long non-coding RNA,microRNA, mRNAIntroductionExcessive intake of a high fat diet commonly leads to obesity, abnormal blood lipid profiles and even insulin resistance [1, 2]. Increased plasma saturated fatty acids (SFAs),induced by a high fat diet, are mainly responsible for thesepathologic progresses [3–5]. Therefore, control of dietarySFAs intake has been widely applied to prevent metabolicrisks and cardiovascular diseases [6, 7].However, some studies have suggested that dietary fattyacid composition rather than dietary fat content contributesmore to insulin sensitivity and health. For example, palmiticacid (C16:0) and C18:0 are the most common and abundant long chain SFAs in food and the human body, andC16:0 can be converted to C18:0 in the body [8]. A high fatdiet with an increase in C18:0 has been found to induce ametabolic state favoring lower oxidative metabolism and severe hepatic insulin resistance in mice compared with anisocaloric high fat diet [9]. In mice deficient for Elovl6, agene encoding the elongase that catalyzes the conversion ofC16:0 to C18:0, the level of C18:0 decreased while the levelof C16:0 increased in serum and liver, and the mice becameobese and developed hepatosteatosis but were protectedfrom insulin resistance when fed a high fat diet [10]. Therefore, differential effects of individual SFAs, particularly stearic acid (18:0), relative to the shorter-chain SFAs havedrawn much interest for accurate nutritional guidelines[11]. However, specific biologic and pathologic functionsthat can be assigned to particular SFAs are very limited,and further research needs to be carried out [12].According to the current evidence, there are likely tworeasons for the different effects on insulin resistance ofC18:0 and C16:0. On one hand, C18:0, compared toC16:0, is poorly incorporated into triacylglycerol in theliver [13]. On the other hand, the efficiency of SFA oxidation has been demonstrated to be related to its chainlength: the longer the chain length of the SFAs is, theslower the rate of oxidation would become [14, 15].Thus, when C18:0 increases in the body, intermediatelipid metabolites, such as diacylglycerols and ceramides,are more likely to accumulate and have been reported tointerfere with the insulin signaling pathway [16–19].As the structure and metabolism between C16:0 andC18:0 are not exactly the same, they may play many different roles in the body, except for some similarfunctions in energy metabolism [20]. In the presentstudy, the mice were fed isocaloric high fat diets withdifferent C18:0/C16:0 ratios to induce obesity and insulin resistance. Metabolic parameters in serum and liverwere determined, and microarray analysis of the liverwas done to investigate the changes in long non-codingRNA (lncRNA), microRNA and mRNA expression. Theaim of this study was: (1) to systematically compare thedifferent effects between C16:0 and C18:0 at the metabolic and even gene transcriptional levels in mice inorder to provide more details regarding their pathophysiological activities, and (2) to provide supportingevidence to control the dietary C18:0/C16:0 ratio for accurate nutrition and health.Materials and methodsAnimalsEight-week-old male C57BL/6 mice (18–22 g) were purchased from Beijing Vital River Laboratory AnimalTechnology Co., Ltd. (Beijing, China). The mice werehoused individually in pathogen-free metabolic cages inan environmentally controlled room at 21 2 C and50 5% humidity with 12-h light/dark cycles; lights wereon at 0700 h and off at 1900 h. The study was approvedby the Institutional Animal Care Committee from Harbin Medical University and conducted in accordancewith the University guidelines for the care and use of laboratory animals (approval number:12–0003).TreatmentsThe mice had ad libitum access to water and standardlaboratory chow (Beijing Keao Xieli Feed CO., LTD.,Beijing, China). After acclimation for 1 week, the micewere randomly divided into 3 groups (n 20 for eachgroup). The mice in the normal fat diet group (NFD)were fed a normal standard laboratory chow diet (15% ofthe energy in the form of fat). The mice in the high C18:0/C16:0 group (HSF) were fed a high fat diet (36% of theenergy in the form of fat) with lard as the major sourceof C18:0. The mice in the low C18:0/C16:0 group (LSF)were fed a high fat diet (36% of the energy in the formof fat) with palm oil as the major source of C16:0 (TableS1). The C18:0/C16:0 ratio in high fat diets was determined by a gas chromatography-mass spectrometry. The
Wang et al. Lipids in Health and Disease(2020) 19:172C18:0/C16:0 ratio was 1:2 in HSF diet and 1:8 in LSFdiet. Food intake and body weight were measured dailyand weekly, respectively. At the end of the 10th week,blood was collected directly from the heart by cardiacpuncture under deep anesthesia. Livers and pancreaswere weighed and stored at 80 C for further use.Page 3 of 13low density lipoprotein cholesterol (LDL-c) were determinedwith a Hitachi 7100 auto-biochemical analyzer (HitachiAloka Medical, Tokyo, Japan). Blood insulin (R&D Systems,Abnova, USA), tumor necrosis factor-α (TNF-α) (Sigma-Aldrich.com, St. Louis, MO, USA), and interleukin-6 (IL-6)(Sigma-Aldrich.com, St. Louis, MO, USA) were measured byenzyme linked immunosorbent assay methods.Energy expenditure measurementEnergy expenditure was assessed using the TSE PhenMaster system (TSE Systems GmbH, Bad Homburg,Germany). At the end of the 9th week, six mice wererandomly picked from each group and placed in themetabolic chambers and acclimated for 24 h. Energy expenditure analysis was performed for consecutive 72 h.Oxygen consumption (VO2) and carbon dioxide production (VCO2) were measured at 27-min intervals. VO2and VCO2 values were in mL/h. The total energy expenditure (EE) was calculated from the sum of fat andcarbohydrate oxidation. Respiratory exchange rate (RER)was calculated as VCO2/VO2. Fat and carbohydrate oxidation rates were calculated according to the followingequation [9]:Carbohydrate oxidation rate ðkcal hÞ¼ ðð4:585 VCO2 Þ‐ð3:226 VO2 ÞÞ 4 1000Fat oxidation rate ðkcal hÞ ¼ ðð1:695 VO2 Þ‐ð1:701 VCO2 ÞÞ 9 1000Measurement of fatty acids profile in serum and liverThe levels of fatty acids in serum and liver of mice weredetected by a Gas Chromatography-Mass Spectrometry(TRACE GC/PolarisQ MS, Thermo Finnigan, San Jose,USA) as previously described [21] (Suppl. Methods- GCMS conditions and method performance).Detection of cell ultra-structural changes in liver andpancreasLiver and pancreas tissues were fixed by 2.5% glutaraldehyde solution and 1% osmium acid solution. After dehydration using ethanol and acetone, tissues were embedded inacetone and embedding solvent. Ultra-thin sections wereprepared by a Reichert-Jung Ultracut E ultramicrotome(Reichert, Vienna, Austria) and stained with uranyl acetateand lead citrate solution. Transmission electron microscopywas employed to observe and analyze the changes of mitochondria in liver and insulin granules in pancreas.Analysis of lncRNA/microRNA/mRNA expression in liverBody fat distribution analysisAt the end of the 10th week, six mice were randomlypicked from each group and were scanned with aLatheta LCT-200 (Hitachi-Aloka Medical, Tokyo, Japan)in a prone position to image the fat distribution. Visceralfat, subcutaneous fat, and muscle mass were calculatedbased on the scanned CT value. Total fat ratio total fatmass/(total fat mass muscle mass) 100%. Liver fat ratio (muscle CT value–liver CT value)/(muscle CTvalue–fat CT value) 100%.Oral glucose tolerance test (OGTT) and homeostasismodel assessment of insulin resistance (HOMA-IR) indexAt the end of the 10th week, OGTT was done in eachgroup before sacrifice. Following a 15-h fasting, 25% glucose (w/v) was given by gavage at a dose of 0.2 mL/10g·BW. Blood sample was collected from the tail vein at0, 30, 60, 90 and 120 min. Insulin resistance was estimated by HOMA-IR based on fasting glucose and insulin levels as follows: HOMA-IR fasting glucose (mmol/L) fasting insulin (mU/L)/ 22.5.Measurement of blood biochemical parameters andinflammatory markersFasting blood glucose, total cholesterol (TC), triglyceride(TG), high density lipoprotein cholesterol (HDL-c) andGene expression in liver of mice (n 3 per group) was determined by Kangcheng Bio-tech Inc. (Shanghai, China). TotalRNA from each sample was quantified using the NanoDropND-1000 and the RNA integrity was assessed using standarddenaturing agarose gel electrophoresis. For microarray analysis, Agilent Array platform was employed. The samplepreparation and microarray hybridization were performedbased on the manufacturer’s standard protocols with minormodifications (Suppl. Methods- Microarrays methods). ForlncRNAs and mRNAs, Agilent Feature Extraction software(version 11.0.1.1) was used to analyze the acquired array images. Quantile normalization and subsequent data processingwere performed using the GeneSpring GX v11.5.1 softwarepackage (Agilent Technologies). For miRNAs, scanned images were then imported into GenePix Pro 6.0 software(Axon Instruments, Union City, CA, USA) for grid alignmentand data extraction. Differentially expressed genes with statistical significance were identified through Volcano Plot filtering. For lncRNAs, those with fold changes 2.0 and Pvalue 0.05 were considered significantly different. FormicroRNAs and mRNAs, those with fold changes 1.5 andP-value 0.05 were considered significantly different. Hierarchical clustering was also performed to show the distinguishable lncRNAs, microRNAs and mRNAs expressionpattern among samples. Pathway analysis and gene ontology(GO) analysis were applied to describe the roles of these
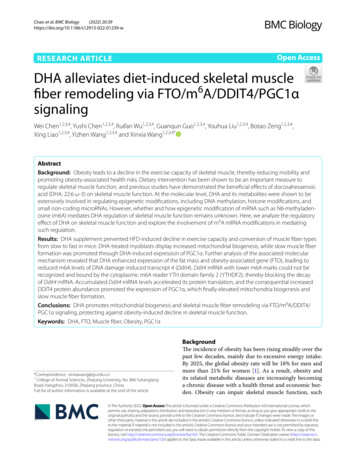
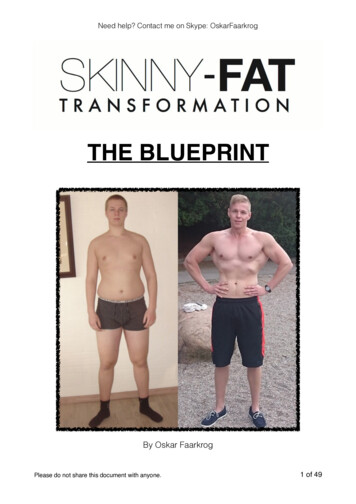
Wang et al. Lipids in Health and Disease(2020) 19:172differentially expressed mRNAs played in these biologicalpathways or GO terms. All the microarray data have beendeposited in a public and community-supported repository,prior to publication of this associated manuscript (https://www.ebi.ac.uk/fg/annotare/). These data (differentiallyexpressed lncRNAs in liver among NFD, LSF and HSFgroups (E-MTAB-9167), differentially expressed microRNAsin liver among NFD, LSF and HSF groups (E-MTAB-9168),differentially expressed mRNAs in liver among NFD, LSFand HSF groups (E-MTAB-9169)) are to be made public forfree at the Arrayexpress platform after the present manuscript is published.Statistical analysisAll data were expressed as the mean SEM. SPSS v21.0(Beijing Stats Data Co. Ltd., Beijing China) was used forstatistical analysis. Comparisons among 3 groups in bodyweight and fat distribution, energy metabolism, bloodbiochemical parameters, inflammatory factors, and FFAslevels were performed using ANOVA with a Bonferronipost hoc test for difference between 2 groups (HSF vs.NFD, LSF vs. NFD, HSF vs. LSF, respectively). P 0.05was considered to be statistically significant.ResultsThe effect of dietary C18:0/C16:0 ratios on body weightand body fat contentAt the end of the 6th week, the body weight of mice inthe HSF group was higher than that of mice in the LSFgroup (Table S2). No significant changes in diet intakePage 4 of 13were observed among the three groups (data not shown).CT images of body fat distribution showed the richest visceral and subcutaneous fat existed in the HSF group,followed by the LSF group, which were much higher thanthose in the NFD group (Fig. 1a). The total body fat ratioand liver fat ratio were also higher in the HSF group thanthose in the LSF group (Fig. 1b, c, Table S3 and S4).The effect of dietary C18:0/C16:0 ratios on energymetabolismThere was no difference in energy expenditure amongthe 3 groups (Fig. S1a). Carbohydrate oxidation in theHSF and LSF groups was significantly lower while fatoxidation was much higher than that in the NFD group(Fig. S1b, c). Moreover, fat oxidation in the LSF groupwas significantly higher than that in the HSF group, indicating a lower oxidation rate of C18:0 than C16:0. Therewas a decreasing trend of RER in the HSF and LSFgroups compared with that in the NFD group (Fig. S1d).The effect of dietary C18:0/C16:0 ratios on bloodbiochemical parameters, glucose tolerance andinflammatory markersMice in both high fat diet groups exhibited decreasedglucose tolerance, but the glucose tolerance was impaired more severely in the HSF group than that in theLSF group (Fig. S2). Fasting blood glucose, insulin, TC,TG, HDL-c, LDL-c, TNF-α, IL-6 and HOMA-IR in thehigh fat diet groups were significantly higher than thosein the NFD group, and glucose, insulin, HOMA-IR, TGFig. 1 Body fat content of mice. a, CT images of mice fat distribution in the 3 groups. b, Comparisons of mice body composition among groups(n 6 for each group). c, Comparisons of fat radios among groups (n 6 for each group). NFD, normal fat diet group; HSF, high stearic acid dietgroup (C18:0/ C16:0 1:2); LSF, low stearic acid diet group (C18:0/ C16:0 1:8). * P 0.05, compared between two groups. Yellow forsubcutaneous fat and pink for visceral fat in Fig. 1a
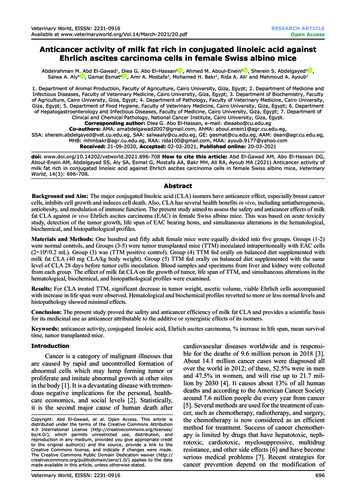
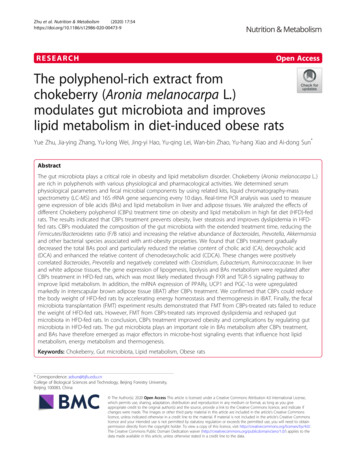
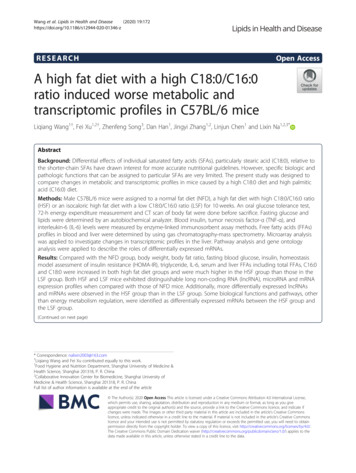
Wang et al. Lipids in Health and Disease(2020) 19:172and IL-6 levels in the HSF group were higher than thosein the LSF group (Table S5).Page 5 of 13The levels of serum total fatty acids, saturated fattyacids, unsaturated fatty acids, C16:0, C18:0, C18:1, andC18:3 were significantly higher in mice fed a high fatdiet, and these fatty acids were much higher in the HSFgroup than those in the LSF group (Table 1). Thechanges in liver fatty acid profiles were similar to thosein serum among the groups (Table S6).that were upregulated and 106 that were downregulated(Fig. 2a, d), while 751 lncRNAs were differentiallyexpressed in the HSF group, including 364 that were upregulated and 387 that were downregulated; morelncRNAs were differentially expressed in the HSF groupthan in the LSF group (Fig. 2b, e). Among these differentially expressed lncRNAs in comparison with the NFDgroup, there were 148 of the same lncRNAs in both theLSF and HSF groups. There were 216 differentiallyexpressed lncRNAs between the LSF and HSF groups,including 116 that were upregulated and 100 that weredownregulated (Fig. 2c, f).The effect of dietary C18:0/C16:0 ratios on cellultrastructure in liver and pancreasDifferentially expressed microRNAs in the liver amonggroupsMitochondria in the high fat diet groups were severelydistended compared with those in the NFD group, andmitochondrial distension in the HSF group was moreserious than that in the LSF group. Some mitochondriain the HSF group showed an exvaginated inner mitochondrial membrane (Fig. S3a, b, c). For the pancreas,the amount of insulin granules decreased significantly inboth the LSF and HSF groups, and there were obviousvacuoles induced by denatured insulin granules in theHSF group (Fig. S3d, e, f).A total of 3544 microRNAs were analyzed. Comparedwith the NFD group, 44 microRNAs were differentiallyexpressed in the LSF group, including 20 that were upregulated and 24 that were downregulated (Fig. 3a, d),while 42 microRNAs were differentially expressed in theHSF group, including 29 that were upregulated and 13that were downregulated (Fig. 3b, e). Among these differentially expressed microRNAs in comparison with theNFD group, there were 10 of the same microRNAs inboth the LSF and HSF groups. There were 32 differentially expressed microRNAs between the LSF and HSFgroups, including 24 that were upregulated and 8 thatwere downregulated (Fig. 3c, f).The effect of dietary C18:0/C16:0 ratios on fatty acidprofiles in serum and liverDifferentially expressed lncRNAs in the liver amonggroupsA total of 34,523 lncRNAs were analyzed. As shown byheat map and volcano plot, there were distinguishablegene expression profiles among the groups (Fig. 2).Compared with the NFD group, 258 lncRNAs were differentially expressed in the LSF group, including 152Differentially expressed mRNAs in the liver among groupsAmong 23,047 mRNAs, a total of 302 differentiallyexpressed mRNAs were identified between the LSFgroup and the NFD group, including 140 that wereTable 1 Serum fatty acids profile in miceFAs (μg/mL)NFDLSFHSFC14:05.15 0.975.55 0.738.3 2.13C16:0257.4 78.21330.05 58.69*377.67 44.33*#C16:137.07 5.0839.68 8.5152.18 10.33**120.08 26.37*#C18:055.39 42.3580.86 29.84C18:1159.06 15.99236.41 22.68*C18:2313.71 54.58*256.11 17.52286.88 31.07γ- C18:313.04 8.418.42 4.1612.06 5.64272.41 23.83*#*114.14 8.37*#C18:3201.41 43.7382.31 15.27C20:235.96 40.21150.16 98.72*C20:481.72 10.27*144.23 37.63148.17 49.17*C20:56.02 1.782.6 1.046.66 2.3698.11 46.96**506.05 69.91*#saturated fatty acid317.94 89.10406.24 98.47unsaturated fatty acid847.98 145.63885.06 165.88total free fatty acids1128.85 243.39*1296.7 129.58990.63 130.54*#1444.79 184.27*#All values are presented as mean SEM (n 10). NFD, normal fat diet group; HSF, high stearic acid diet group (C18:0/ C16:0 1:2); LSF, low stearic acid diet group(C18:0/ C16:0 1:8). * Compared with the NFD group, P 0.05. # Compared with LSF group, P 0.05
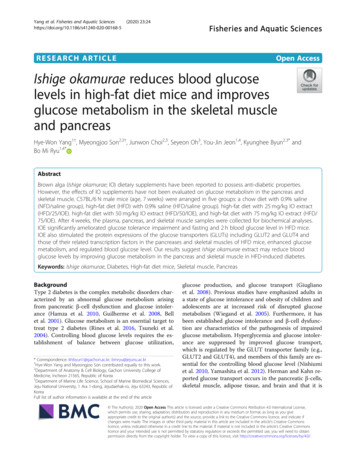
Wang et al. Lipids in Health and Disease(2020) 19:172Page 6 of 13Fig. 2 Dfferentially expressed lncRNAs in liver of mice. a-c, Differentially expressed lncRNAs in liver analyzed using hierarchical clustering; redindicates high relative expression, and green indicates low relative expression. a, NFD vs. LFD; b, NFD vs. HFD; c, LFD vs. HFD. d-f, Differentiallyexpressed lncRNAs in liver using Volcano plot. The red point in the plot represents the differentially expressed lncRNAs with statisticalsignificance. d, NFD vs. LFD; e, NFD vs. HFD; f, LFD vs. HFD. NFD, normal fat diet group; HSF, high stearic acid diet group (C18:0/ C16:0 1:2); LSF,low stearic acid diet group (C18:0/ C16:0 1:8)upregulated and 162 that were downregulated (Fig. 4a,c), while 808 differentially expressed mRNAs were identified between the HSF group and the NFD group, including 433 that were upregulated and 375 that weredownregulated (Fig. 4b, e). There were many more differentially expressed mRNAs in the HSF group than inthe LSF group when compared with the NFD group.Additionally, among these differentially expressedmRNAs, 150 of the same mRNAs were differentiallyexpressed in both the LSF and the HSF groups. Therewere 275 differentially expressed mRNAs between theLSF and HSF groups, including 230 that were upregulated and 45 that were downregulated (Fig. 4c, f).Functional analysis of differentially expressed mRNAs inthe liver among groupsThe GO analysis covered three domains: biologicalprocess (Fig. 5), cellular component (Fig. S4), and molecular function (Fig. S5), and this study mainly focusedon biological processes. Compared with the NFD group,differentially upregulated mRNAs were involved in biological processes including nitric oxide-mediated signaltransduction and cellular response to glucose starvation(Fig. 5a, c), and differentially downregulated mRNAswere involved in positive regulation of fatty acid oxidation, arachidonic acid metabolic process, thioester metabolic process, acyl-CoA metabolic process, long term
Wang et al. Lipids in Health and Disease(2020) 19:172Page 7 of 13Fig. 3 Differentially expressed mRNAs in liver of mice. a-c, Differentially expressed mRNAs in liver analyzed using hierarchical clustering; redindicates high relative expression, and green indicates low relative expression. a, NFD vs. LFD; b, NFD vs. HFD; c, LFD vs. HFD. d-f, Differentiallyexpressed mRNAs in liver by Volcano plot. The red point in the plot represents the differentially expressed mRNAs with statistical significance. d,NFD vs. LFD; e, NFD vs. HFD; f, LFD vs. HFD. NFD, normal fat diet group; HSF, high stearic acid diet group (C18:0/ C16:0 1:2); LSF, low stearic aciddiet group (C18:0/ C16:0 1:8)synaptic depression, and urate metabolic process in boththe LSF group and the HSD group (Fig. 5b, d). Comparedwith the LSF group, differentially upregulated mRNAswere involved in inclusion body assembly, regulation ofgene silencing, and mammary gland involution (Fig. 5e),and differentially downregulated mRNAs were involved inmonocyte chemotaxis, antigen processing and presentation of exogenous peptide antigen via MHC class II, andlymphocyte chemotaxis in the HSF group (Fig. 5f).Compared with the NFD group, the common pathways that the up-regulated transcripts involved in included cytokine-cytokine receptor intervention and theprolactin signaling pathway (Fig. 6a, c), and the commonpathways that the downregulated transcripts involved inincluded retinol metabolism, fatty acid degradation, theperoxisome, steroid hormone biosynthesis, the PPARsignaling pathway, and arachidonic acid metabolism inboth the LSF group and the HSD group (Fig. 6b, d).When comparing the differences between the LSF groupand the HSD group, the enrichment pathways with thetop 3 scores were chemical carcinogenesis, retinolmetabolism, and steroid hormone biosynthesis for upregulated mRNAs (Fig. 6e) and steroid hormone biosynthesis, endocytosis and MAPK signaling pathway fordownregulated mRNAs (Fig. 6f).DiscussionIn the present study, the changes in metabolic and transcriptomic profiles between two high fat diet groupswith different C18:0/C16:0 ratios have been compared inmice for the first time. The results showed that glucoseand lipid metabolic disorders and inflammation weremuch more severe in HSF mice than in LSF mice. Compared with the NFD group, there were many more differentially expressed lncRNAs and mRNAs in HSF micethan in LSF mice, with distinguishable lncRNA, microRNA, and mRNA expression profiles between these twogroups. The differentially expressed lncRNAs, microRNAs, and mRNAs between the LSF and HSF groupswere much more numerous than those with the samechanging trends in both the LSF and HSF groups, whencompared with the NFD group. Additionally, some
Wang et al. Lipids in Health and Disease(2020) 19:172Page 8 of 13Fig. 4 Differentially expressed microRNAs in liver tissues. a-c, Differentially expressed microRNAs in liver analyzed using hierarchical clustering; redindicates high relative expression, and green indicates low relative expression. a, NFD vs. LFD; b, NFD vs. HFD; c, LFD vs. HFD. d-f, Differentiallyexpressed microRNAs in liver by Volcano plot. The red point in the plot represents the differentially expressed microRNAs with statisticalsignificance. d, NFD vs. LFD; e, NFD vs. HFD; f, LFD vs. HFD. NFD, normal fat diet group; HSF, high stearic acid diet group (C18:0/ C16:0 1:2); LSF,low stearic acid diet group (C18:0/ C16:0 1:8)biological functions and pathways, except for energymetabolism regulation, were identified that the differentially expressed mRNAs between the HSF groupand the LSF group were probably involved in C18:0/C16:0 ratio and obesity.Many studies have shown that a high fat diet inducespassive overfeeding, which leads to obesity and poorlipid profiles [22–24]. However, limited studies have focused on the effect of saturated fatty acid composition indiets, especially regarding the effect of the C18:0/C16:0ratio on metabolism [25]. In the present study, compared with NFD mice, mice in both high fat diet groups(HSF and LSF) developed obesity. However, the bodyweight and body fat ratio of mice in the HSF group weremuch higher than those of mice in the LSF group. Additionally, there were more severe mitochondrial injuriesin the liver and pancreas in the HSF group than in theLSF group. These may be explained by the decrease infat oxidation in the HSF group when compared with theLSF group, as observed with an energy metabolismmonitor. Additionally, previous studies support this finding that saturated fatty acids with longer chain lengthshave slower oxidation rates [14, 15]. These results suggest that obesity induced by high fat diets is associatedwith the chain length of the saturated fatty acids in diets,and a high C18:0 diet is more likely to lead to obesitythan an isocaloric high C16:0 diet C18:0/C16:0 ratio andinsulin resistance.
Wang et al. Lipids in Health and Disease(2020) 19:172Page 9 of 13Fig. 5 GO analyses of biological process for the differentially expressed mRNAs. a, c and e, Top ten fold enrichment terms of biological processesfor mRNAs down-regulated. a, NFD vs. LFD; c, NFD vs. HFD; e, LFD vs. HFD. b, d and f, Top ten fold enrichment terms of biological processes formRNAs up-regulated. b, NFD vs. LFD; d, NFD vs. HFD; f, LFD vs. HFD. The bar plot shows the top ten fold enrichment value of the significantenrichment termsIncreased circulating FFAs, especially SFAs, are keyfactors that cause insulin resistance in obesity [26]. C16:0 and C18:0 are the most common long chain saturatedfatty acids in food and the human body, and they aremost closely related to insulin resistance and type 2 diabetes [19, 27]. Human studies have revealed that circulating SFAs, especially C16:0 and C18:0, were associatedwith higher diabetes risk [28, 29]. However, whetherthere is any difference between C16:0 and C18:0, especially from diet, in terms of their effect on insulin resistance and diabetes has not been reported in humans. Astudy from van den Berg SA demonstrated that a highfat diet rich in stearate induced a metabolic state favoring low oxidative metabolism and whole-body insulinresistance characterized by severe hepatic insulin resistance [11]. However, the circulation and organism FFAlevels were not detected. A previous study found that
C18:0/C16:0 ratio was 1:2 in HSF diet and 1:8 in LSF diet. Food intake and body weight were measured daily and weekly, respectively. At the end of the 10th week, blood was collected directly from the heart by cardiac puncture under deep anesthesia. Livers and pancreas were weighed and stored at 80 C for further use. Energy expenditure .