Transcription
Aragon et al. Journal of the International Society of Sports Nutrition (2017) 14:16DOI 10.1186/s12970-017-0174-yREVIEWOpen AccessInternational society of sports nutritionposition stand: diets and body compositionAlan A. Aragon1, Brad J. Schoenfeld2, Robert Wildman3, Susan Kleiner4, Trisha VanDusseldorp5, Lem Taylor6,Conrad P. Earnest7, Paul J. Arciero8, Colin Wilborn6, Douglas S. Kalman9, Jeffrey R. Stout10, Darryn S. Willoughby11,Bill Campbell12, Shawn M. Arent13, Laurent Bannock14, Abbie E. Smith-Ryan15 and Jose Antonio16*AbstractPosition Statement: The International Society of Sports Nutrition (ISSN) bases the following position stand on a criticalanalysis of the literature regarding the effects of diet types (macronutrient composition; eating styles) and theirinfluence on body composition. The ISSN has concluded the following. 1) There is a multitude of diet types and eatingstyles, whereby numerous subtypes fall under each major dietary archetype. 2) All body composition assessmentmethods have strengths and limitations. 3) Diets primarily focused on fat loss are driven by a sustained caloric deficit.The higher the baseline body fat level, the more aggressively the caloric deficit may be imposed. Slower rates of weightloss can better preserve lean mass (LM) in leaner subjects. 4) Diets focused primarily on accruing LM are driven by asustained caloric surplus to facilitate anabolic processes and support increasing resistance-training demands. Thecomposition and magnitude of the surplus, as well as training status of the subjects can influence the nature of thegains. 5) A wide range of dietary approaches (low-fat to low-carbohydrate/ketogenic, and all points between) can besimilarly effective for improving body composition. 6) Increasing dietary protein to levels significantly beyond currentrecommendations for athletic populations may result in improved body composition. Higher protein intakes (2.3–3.1 g/kg FFM) may be required to maximize muscle retention in lean, resistance-trained subjects under hypocaloricconditions. Emerging research on very high protein intakes ( 3 g/kg) has demonstrated that the known thermic,satiating, and LM-preserving effects of dietary protein might be amplified in resistance-training subjects. 7) Thecollective body of intermittent caloric restriction research demonstrates no significant advantage over daily caloricrestriction for improving body composition. 8) The long-term success of a diet depends upon compliance andsuppression or circumvention of mitigating factors such as adaptive thermogenesis. 9) There is a paucity of research onwomen and older populations, as well as a wide range of untapped permutations of feeding frequency andmacronutrient distribution at various energetic balances combined with training. Behavioral and lifestyle modificationstrategies are still poorly researched areas of weight management.BackgroundThere are several major diet types interspersed with amultitude of subtypes. This creates a maze of conflictingprinciples that may be difficult for the general public andpractitioners to navigate. Compounding the confusion isthe continued propagation of fad diets across a range ofmedia outlets, replete with unfounded practices. Therefore, it is important to examine the scientific evidence in asystematic way in order to devise recommendations to* Correspondence: ja839@nova.edu16Department of Health and Human Performance, Nova SoutheasternUniversity, Davie, FL, USAFull list of author information is available at the end of the articleguide healthcare practitioners, coaches (including trainers,dietitians, and sports nutritionists), athletes, and the general public regarding all of the above. The purpose of thisposition stand is to provide clarity on the effects of variousdiets on body composition.A general definition of “diet” is the sum of energy andnutrients obtained from foods and beverages consumedregularly by individuals. Thus, the following dietary archetypes will be assessed: very-low- and low-energy diets(VLED and LED), low-fat diets (LFD), low-carbohydratediets (LCD), ketogenic diets (KD), high-protein diets(HPD), and intermittent fasting (IF). Diets with qualitativethemes or commercial brands will inevitably fall under the The Author(s). 2017 Open Access This article is distributed under the terms of the Creative Commons Attribution 4.0International License (http://creativecommons.org/licenses/by/4.0/), which permits unrestricted use, distribution, andreproduction in any medium, provided you give appropriate credit to the original author(s) and the source, provide a link tothe Creative Commons license, and indicate if changes were made. The Creative Commons Public Domain Dedication o/1.0/) applies to the data made available in this article, unless otherwise stated.
Aragon et al. Journal of the International Society of Sports Nutrition (2017) 14:16umbrella of the classifications above. Therefore, their parent categories rather than ‘named’ or ‘branded’ diets (e.g.,Atkins, Ornish, Zone, Paleo, etc.) will receive the majorityof scrutiny in this position stand.This position stand will further focus on prospectiveintervention trials with a duration of at least 4 weeks, asthis can be considered a minimum period of time formeaningful changes in fat mass (FM) and lean mass (LM,termed interchangeably with fat-free mass, or FFM), as wellas effects of exercise training on these variables. Studiesand pooled analyses with and without training have beenincluded, as well as studies across the range of energeticbalances (i.e., hypo-, hyper-, and eucaloric). Studies that didnot measure body composition have not been included, norhave studies examining dietary effects in clinical contexts –including disease treatment. Despite the latter topicsbreaching the scope of the present article, it is still important to note that body composition is inextricably tied tofoundational parameters of health. Aside from sports andfitness applications for improvements in body composition,a higher proportion of LM reduces the risk of developingmetabolic syndrome [1], bone loss [2], and the multiplecomplications associated with sarcopenia [3, 4].Body composition assessment methodsBody composition assessment is an attempt to simplify aprocess that is inherently complex. As such, there areseveral methods that attempt to accurately estimate LMand FM, and their subcomponents. Before outlining themost common methods used in sports science andmedicine, it should be noted that there is a continuumof the components measured or estimated. Over 25 yearsago, Wang et al. [5] proposed a five-level model for organizing body composition research [6]. Each level hasdifferent components, eventually deemed compartments,and have undergone further organization to include two(2C), three (3C) and four (4C) compartments [6]:1) Atomic level: hydrogen, oxygen, nitrogen, carbon,sodium, potassium, chloride, phosphorus, calcium,magnesium, sulfur.2) Molecular level: The 4C model includes FM, totalbody water (TBW), total body protein, and bonemineral content. The 3C model includes FM, TBW,and nonfat solids. An alternate 3C model includesFM, bone mineral, and residual mass. The 2C modelincludes FM and FFM.3) Cellular level: The 3C model includes cells,extracellular fluids, and extracellular solids. The 4Cmodel includes body cell mass, FM, extracellularfluids, and extracellular solids.4) Tissue-organ level: adipose tissue, skeletal muscle,bone, visceral organs, other tissues.5) Whole body level: head, trunk, and appendages.Page 2 of 19The 4C model has the greatest degree of sensitivity tointerindividual variability of FFM composition. Its comprehensiveness and accuracy have rendered its reputation as the “gold standard” to which all other models arecompared, but it is limited to occasional use in primaryresearch due to its logistical challenges. The 2C modelestimates FM and FFM, and operates under the assumption that water, protein, and mineral content of FFM areconstant. Thus, the 2C model is the most commonlyused approach for adults. Due to their relatively lowcost, non-invasiveness, and ease of operation, 2C modelbased methods are common in clinical practice andsports/fitness settings. Examples of methods based onthe 2C model include hydrodensitometry (underwaterweighing), air displacement plethysmography (ADP orBOD POD ), skinfold thickness, and bioelectrical impedance analysis (BIA). Dual energy X-ray absorptiometry(DXA) is based on a 3C model that measures bone mineral content, LM, and FM, but it is still subject to confounding from inter-assessment differences in hydration,glycogen, and muscle creatine levels, which can be significant in athletic populations with distinct exercise andrecovery cycles [7, 8].Body composition methods have been further classifiedas direct, indirect, and criterion [9]. Direct methods measure the specific/targeted aspect or process. Examples include TBW, isotope dilution, and neutron activation.Indirect methods provide surrogate measures or proxiesof direct methods and criterion methods. Examples of indirect methods are anthropometry (e.g., skinfolds), ADP,BIA, and bioimpedance spectroscopy (BIS). Criterionmethods measure a specific property of the body such asdensity or distribution of skeletal muscle and adipose tissue. Examples include hydrodensitometry, computed tomography, magnetic resonance imaging (MRI), and DXA. Itshould be noted that multi-compartment models haveevolved to be considered criterion methods: standardsagainst which other methods are judged.The various methods are often classified in the literatureas either laboratory methods (e.g., DXA, ADP) or fieldmethods (e.g., skinfolds, ultrasound, BIA, BIS) dependingon their respective use in research and clinical settings aswell as their portability. Laboratory methods – includingmulti-compartment models – have traditionally beenviewed as more accurate and valid. BIA and BIS haveevolved to include multiple frequencies. This technologymay more accurately estimate body composition throughmultiple frequency-dependent electrical properties of bodytissues, as opposed to traditional single frequency methods(i.e., handheld BIA or scales). However, higher levels of sophistication with multi-frequency options are often accompanied by lower availability and higher cost. Given thebroad range of body composition measurement techniquesand unique challenges involved with measuring athletes
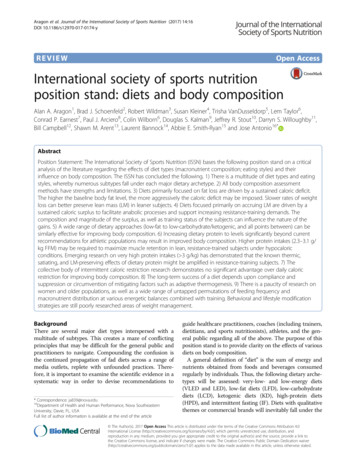
Aragon et al. Journal of the International Society of Sports Nutrition (2017) 14:16(exercise/glycogen depletion, hydration, time availability,etc.), there is no universally superior method for body composition assessment in this population [10–12]. An excellentreview by Wagner and Hayward [10] concludes the following: “There is no single method which is ‘best;’ rather, theclinician or researcher must weigh the practical considerations of their assessment needs with the limitations of themethods.” Table 1 outlines the characteristics of selectedbody composition assessment methods [6, 9, 10, 13–20]:Major diet archetypesLow-energy dietsLow-energy diets (LED) and very-low-energy diets(VLED) are characterized by their provision of 800–1200 kcal/day and 400–800 kcal/day, respectively [21].Note that LED have also been given a more liberal definition of providing 800–1800 kcal [22]. Very-low-energy diets are typically in liquid form and commercially prepared.The aim of the diet is to induce rapid weight loss (1.0–2.5 kg/week) while preserving as much LM as possible.VLED are designed to replace all regular food consumption, and therefore should not be confused with meal replacement products intended to replace one or two mealsper day. As such, VLED are fortified with the fullspectrum of essential micronutrients. The macronutrientcontent of VLED is approximately 70–100 g/day, 15 g/dayand 30–80 g/day of protein, fat and carbohydrate, respectively. A protein-sparing modified fast can be consideredthe higher-protein variant of a VLED, with protein intakesof approximately 1.2–1.5 g/kg/d [23]. However, even atprotein intakes as low as 50 g/day, the proportion of LMloss from VLED has been reported to be 25% of totalweight loss, with 75% as fat loss [24].Resistance training has shown an impressive ability toaugment the preservation of muscle and even increase itduring VLED – at least in untrained/obese subjects. A12-week trial by Bryner et al. [25] found that resistancetraining while consuming 800 kcal resulted in the preservation of LM in untrained obese subjects. There wasactually a slight gain, but it did not reach statistical significance. Resting metabolic rate (RMR) significantly increased in the training group, but it decreased in thecontrol group. Donnelly et al. [26] reported a significantincrease in cross-sectional area of both slow- and fasttwitch muscle fibers in untrained obese subjects after12 weeks on an 800 kcal diet with resistance training.While these results cannot necessarily be extrapolated tolean, trained subjects, they are nevertheless intriguing.In obese populations, aggressive caloric restriction is apotentially powerful intervention since a greater initialweight loss is associated with greater long-term successin weight loss maintenance [27]. However, a metaanalysis by Tsai and Wadden [22] found that VLED didnot result in greater long-term (1 year or more) weightPage 3 of 19loss than LED. Eight to 12 week VLED are common inclinical practice before transitioning to less severe caloricrestriction; however, there is an ongoing debate regarding the duration that can be safely sustained for VLED.Multiple deaths have been reported due to low-qualityprotein intake, excessive loss of lean mass, and inadequate medical supervision [28]. Adverse effects ofVLED include cold intolerance, fatigue, headache, dizziness, muscle cramps, and constipation. Hair loss was reported to be the most common complaint of extendedVLED use [22]. It should be noted that VLED use haslimited relevance to healthy and athletic populations.Low-Fat dietsLow-fat diets (LFD) have been defined as providing 20–35% fat [29]. This is based on the Acceptable Macronutrient Distribution Ranges (AMDR) for adults, set by theFood and Nutrition Board of the Institute of Medicine[30]. The AMDR set protein at 10–35%, carbohydrate at45–65%, and fat at 20–35% of total energy. Although theclassification of LFD is based on the AMDR, it might bemore accurate to call them high-carbohydrate diets,given the dominance of this macronutrient in the ranges.As such, the definition of LFD is inherently subjective.Scientists and physicians have promoted decreased fatintake since the 1950s [31]. The 1977 publication of theDietary Goals for the United States, and the 1980 publication of the inaugural Dietary Guidelines for Americans(DGA) reinforced a reduction in total fat intake with theaim of improving public health [32]. Although theAMDR were published in 2005, their staying power isapparent since the recently updated DGA adheres tothese ranges [33], as do major health organizations suchas the American Heart Association, American DiabetesAssociation and Academy of Nutrition and Dietetics.A recent systematic review by Hooper et al. [34] analyzed 32 randomized controlled trials (RCTs) containing 54,000 subjects, with a minimum duration of 6 months.Reducing the proportion of dietary fat compared to usualintake modestly but consistently reduced body weight,body fat, and waist circumference. Excluded from the analysis were RCTs where subjects in either the control or experimental groups had the intention to reduce weight.The implication of these findings is that reducing the proportion of dietary fat can cause a de facto reduction oftotal energy intake, thereby reducing body fat over time.The premise of dietary fat reduction for weight loss isto target the most energy-dense macronutrient to impose hypocaloric conditions. Tightly controlled experiments have covertly manipulated the fat content of dietssimilar in appearance and palatability, and the higher energy density of the higher-fat diets resulted in greaterweight gain and/or less weight loss [35, 36]. However,over the long-term, diets with lower energy density have
Aragon et al. Journal of the International Society of Sports Nutrition (2017) 14:16Page 4 of 19Table 1 Body composition methodsMethodComponents measured/estimatedStrengthsLimitationsSkinfold thicknessSubcutaneous fat thickness in specificsites of the bodyReliable method for assessing regionalfatness. Useful for monitoring fat changesin children due to their small body size,and their fat stores are primarilysubcutaneous, even in obese children(though increasing degrees of obesitylower the viability of this method).Most skinfold calipers have an upperlimit of 45–60 mm, limiting their useto moderately overweight or thinsubjects. Measurement reliabilitydepends on the skill and experiencelevel of the technician, which varies,and type/brand of caliper used. Thebest use of this method is themonitoring of raw values, rather thanassuming an accurate representationof body composition.Bioelectrical impedance Total body water (TBW), which isanalysis (BIA) andconverted to FFM via the assumptionbioelectrical impedance that 73% of the body’s FFM is waterspectroscopy (BIS)Economical, safe, quick, minimalparticipant participation and technicianexpertise. Capable of determining bodycomposition of groups and monitoringchanges within individuals over time. BISor multi-frequency BIA, is capable of delineating TBW into intracellular water(ICW) and extracellular water (ECW),which allows for an estimation of bodycell mass.Validity of BIA and BIS is populationspecific; it’s influenced by sex, age,height, disease state, and race. BIA/BISunderestimates FFM in normal-weightindividuals and overestimates FFM inobese individuals compared to DXA.Validity of single-frequency BIA andmultifrequency BIA may be limited tohealthy, young, euhydrated adults.Hydrodensitometry(also called hydrostaticweighing orunderwater weighing)Good test-retest reliability, accurate in determining body density, lengthy historyand track record of consistent use insports and clinical settings.Relies upon subject performance(completely exhaled, submerged).Errors in measurement of residuallung volume can confound theassessment of body composition. Thedensity of FFM is an assumedconstant but can vary with age, sex,race, and training status.Air displacementTotal body volume, and total body fatplethysmography (ADP) (FFM and FM)High reliability for body fat percentage,body density, and residual lung volumein adults. Non-invasive, quick, no radiation exposure or subject performancedemands. Same-day test-retest reliabilityhas been reported to be slightly betterthan hydrodensitometryTends to over-estimate fat mass compared to DXA and the 4C model. Diseasestates can reduce accuracy. Inconsistencyof clothing and facial/body hair and exercise prior to testing can alter repeatability. Expensive apparatus.Dual energy X-ray absorptiometry (DXA)Total and regional body fat, LM, bonemineral densityHigh accuracy and reproducibility for allage groups. Non-invasive, quick, no subject performance needed. Measurementsare not confounded by disease states orgrowth disorders. Gold standard for diagnosing osteopenia and osteoporosis.Small amount of radiation exposure.Fat mass estimates are confoundedby trunk thickness (error increasesalongside degree of trunk thickness).Compared to 4C, DXA may beunreliable for longitudinal studies ofsubjects who undergo major changesin glycogen or hydration statusbetween measurements. Expensiveapparatus.UltrasoundTissue layer thickness (skin, adipose,muscle)Highly repeatable, readily available,widely used, portable, quick. Noninvasiveand no ionizing radiation. Accurate andprecise estimates of fat thickness inmultiple sites of the body, capable ofmeasuring the thickness of muscle andbone.Requires a skilled, experiencedtechnician. Measurement proceduresand techniques are not yetstandardized. Inherent confounderssuch as fascia can complicate theinterpretation of results. Higher costthan field methods.Body weight on land and weight inwater, body volume, body density, andresidual lung volumeMagnetic resonanceTotal and regional fat (includingHigh accuracy and reproducibility. MRIimaging (MRI) andsubcutaneous and visceral), skeletaldoes not involve exposure to radiation.computed tomography muscle, organs and other internaltissues, lipid content in muscle and liverNear-infraredinteractance (NIR)Fat, protein, and water – based onassumptions of optical densityExpensive, lengthy procedure. Limitedto accommodating normal tomoderately overweight individuals, butnot very large body sizes do not fit inthe field of view. High radiationexposure with computed tomography.Good test-retest and day-to-day reliability. Large standard errors of estimationQuick, non-invasive.(SEE 3.5% BF). Percent body fat issystematically underestimated, andthis error increases alongside largerbody frames.
Aragon et al. Journal of the International Society of Sports Nutrition (2017) 14:16not consistently yielded greater weight loss than energyrestriction alone [37, 38]. Reasons for the disparity between short- and long-term effects of energy density reduction include speculation that learned compensationis occurring. In addition, postprandial factors may increase sensory-specific satiety that over time can reducethe initial palatability of energy-dense foods [39].Very-low-fat diets (VLFD) have been defined as providing10–20% fat [29]. Diets fitting this profile have a limitedamount of research. The body of controlled interventiondata on VLFD mainly consists of trials examining thehealth effects of vegetarian and vegan diets that aggressivelyminimize fat intake. These diets have shown consistentlypositive effects on weight loss [40], but this literature lacksbody composition data. Among the few studies that did,the A TO Z Weight Loss Study by Gardner et al. [41], didnot show any significant between-group differences in bodyfat reduction among the diets (Atkins, Zone, LEARN, andOrnish). However, despite the Ornish group’s assigned fatintake of 10% of total calories, actual intake progressedfrom 21.1 to 29.8% by the end of the 12-month trial. Similarresults were seen by de Souza et al. [42] in the POUNDSLOST trial. Four groups were assigned high-protein (25%)and average-protein (15%) versions of high-fat (40%) andlow-fat (20%) diets. No significant between-group differences were seen in the loss of total abdominal, subcutaneous, or visceral fat at either six months or two years. Amean loss of 2.1 kg LM and 4.2 kg FM occurred in bothgroups at 6 months. No LM-retentive advantage was seenin the higher-protein diets, but this could have been due toboth protein intake levels being sub-optimal (1.1 and 0.7 g/kg). As seen in previous LFD research, the targeted restriction to 20% fat was apparently difficult to attain since actualintakes ranged 26–28%.Low-carbohydrate dietsSimilar to LFD, low-carbohydrate diets (LCD) are a broadcategory lacking an objective definition. There is no universal agreement on what quantitatively characterizes an LCD.The AMDR lists 45–65% of total energy as the appropriatecarbohydrate intake for adults [33]. Therefore, diets withintakes below 45% fall short of the ‘official’ guidelines andcan be viewed as LCD. However, other published definitions of LCD disregard the limits set in the AMDR. LCDhave been defined as having an upper limit of 40% of totalenergy from carbohydrate [43, 44]. In absolute rather thanproportional terms, LCD have been defined as having lessthan 200 g of carbohydrate [43]. Some investigators havetaken issue with this liberal definition of LCD, preferring todelineate non-ketogenic LCD as containing 50–150 g, andKD as having a maximum of 50 g [45].Meta-analyses comparing the effects of LFD with LCDhave yielded mixed results across a wide range of parameters. Liberal operational definitions of LCD (e.g., 45%)Page 5 of 19have led to a lack of significant differences in body weightand waist circumference [46], while lower carbohydrateclassification thresholds ( 20%) have favored LCD forweight loss and other cardiovascular risk factors [47]. Recently, Hashimoto et al. [48] conducted the first-ever metaanalysis on the effect of LCD on fat mass (FM) and bodyweight. The analysis, limited to trials involving overweight/obese subjects, had a total of 1416 subjects, stratifying thediets as “mild LCD” ( 40% CHO) or “very LCD” ( 50 gCHO or 10% of total energy). Eight RCTs included a veryLCD treatment, and 7 RCTs included a mild LCD treatment. With all groups considered, FM decrease was significantly greater in the LCD than the control diets. However,sub-analysis showed that fat mass decrease in very LCDwas greater than the controls, while the difference in FMdecrease between mild LCD and controls was not significant. A separate sub-analysis of short- versus long-term effects found that both types of LCD yielded significantlygreater fat loss than controls in trials less than, as well aslonger than 12 months. A further sub-analysis of found thatBIA failed to detect significant between-group differencesin FM reduction, while DXA showed significantly greaterdecreases in LCD than controls. It should be noted thatdespite reaching statistical significance, mean differences inFM reduction between LCD and control groups were small(range 0.57–1.46 kg). Practical relevance is questionablegiven the obese nature of the subjects. The authors speculated that the advantage of the LCD over the control dietscould have been due to their higher protein content.Ketogenic dietsDespite being a subtype of LCD, the ketogenic diet (KD)deserves a separate discussion. Whereas non-ketogenicLCD is subjectively defined, KD is objectively defined by itsability to elevate circulating ketone bodies measurably – astate called ketosis, also known as physiological or nutritional ketosis. Aside from completely fasting, this conditionis attained by restricting carbohydrate to a maximum of 50 g or 10% of total energy [45], while keeping proteinmoderate (1.2–1.5 g/kg/d) [49], with the remaining predominance of energy intake from fat ( 60–80% or more,depending on degree protein and carbohydrate displacement). Ketosis is a relatively benign state not to be confusedwith ketoacidosis, which is a pathological state seen in type1 diabetics, where a dangerous overproduction of ketonesoccurs in the absence of exogenous insulin. The primaryketone produced hepatically is acetoacetate, and the primary circulating ketone is β-hydroxybutyrate [50]. Undernormal, non-dieting conditions, circulating ketone levelsare low ( 3 mmol/l). Depending on the degree of restriction of carbohydrate or total energy, KD can raise circulating ketone levels to a range of 0.5–3 mmol/l, withphysiological ketosis levels reaching a maximum of 7–8 mmol/l [49].
Aragon et al. Journal of the International Society of Sports Nutrition (2017) 14:16The proposed fat loss advantage of carbohydrate reduction beyond a mere reduction in total energy is basedlargely on insulin-mediated inhibition of lipolysis and presumably enhanced fat oxidation. However, a single-armstudy by Hall et al. [51] examined the effect of 4 weeks ona low fat diet (300 g CHO) followed by 4 weeks on a KD(31 g CHO). Blood ketone levels plateaued at 1.5 mmol/lwithin two weeks into the KD. A transient increase in energy expenditure ( 100 kcal/day) lasting a little over aweek occurred upon switching to the KD. This was accompanied by a transient increase in nitrogen loss, potentially suggesting a stress response including the rampingup of gluconeogenesis. Although insulin levels droppedrapidly and substantially during the KD (consisting of 80%fat, 5% CHO), an actual slowing of body fat loss was seenduring the first half of the KD phase.It has been postulated that the production andutilization of ketone bodies impart a unique metabolicstate that, in theory, should outperform non-ketogenicconditions for the goal of fat loss [45]. However, this claimis largely based on research involving higher protein intakes in the LCD/KD groups. Even small differences inprotein can result in significant advantages to the higherintake. A meta-analysis by Clifton et al. [52] found that a5% or greater protein intake difference between diets at12 months was associated with a threefold greater effectsize for fat loss. Soenen et al. [53] systematically demonstrated that the higher protein content of lowcarbohydrate diets, rather than their lower CHO content,was the crucial factor in promoting greater weight lossduring controlled hypocaloric conditions. This is not toosurprising, considering that protein is known to be themost satiating macronutrient [54]. A prime example ofprotein’s satiating effect is a study by Weigle et al. [55]showing that in ad libitum conditions, increasing proteinintake from 15 to 30% of total energy resulted in a spontaneous drop in energy intake by 441 kcal/day. This led toa body weight decrease of 4.9 kg in 12 weeks.With scant exception [56], all controlled interventionsto date that matched protein and energy intake betweenKD and non-KD conditions have failed to show a fat lossadvantage of the KD [51, 53, 57–60]. A recent review byHall [61] states, “There has never been an inpatient controlled feeding study testing the effects of isocaloric dietswith equal protein that has reported significantly increased energy expenditure or greater loss of body fatwith lower carbohydrate diets.” In light of this and thepreviously discussed research, the ‘special effects’ ofLCD and KD are not due to their alleged metabolic advantage, but their higher protein content. Perhaps thestrongest evidence against the alleged metabolic advantage of carbohydrate restriction is a recent pair of metaanalyses by Hall and Guo [60], w
body composition assessment methods [6, 9, 10, 13 -20]: Major diet archetypes Low-energy diets Low-energy diets (LED) and very-low-energy diets (VLED) are characterized by their provision of 800- 1200 kcal/day and 400-800 kcal/day, respectively [21]. Note that LED have also been given a more liberal defin-ition of providing 800-1800 .