Transcription
Cell Metabolism, Volume 34Supplemental informationPIDDosome-SCAP crosstalkcontrols high-fructose-diet-dependent transitionfrom simple steatosis to steatohepatitisJu Youn Kim, Lily Q. Wang, Valentina C. Sladky, Tae Gyu Oh, Junlai Liu, KaitlynTrinh, Felix Eichin, Michael Downes, Mojgan Hosseini, Etienne D. Jacotot, Ronald M.Evans, Andreas Villunger, and Michael Karin
1.51.01.5*G)ATGPositive 000HFrDp-eIF2α37Tubulin50CSD15HFrD***1050-5CSDF) 2000N.SATP(ng/g)*86420HFrDTNFBip/Grp78*1.00.5D) 10100***806040200CSD HFrDLiver TG (mg/g)N.S0.40.30.20.10.0CSD HFrDGrp946Liver Chol (mg/g)Serum Chol (mg/µl) Serum TG (mg/µl)C)2 4CSDH&EN.S2520151050D rDCS HF8 10 12 (week)BW (g)0B)Food intake(g/week/mouse)Supplement Figure 1A)CSDHFrD353025201500100050000.50CSD HFrD0.0CSD HFrD3Ex5Ex56STOPEx7 Ex96STOPEx7 Ex902 4 68 10 12 .020.00F4/80TNFI) 151050pBW (g)30Casp2ΔHepHeCasp2F/FCaCa sp2 Fsp /F2ΔH)Food Intake(g/mouse/week)FRTFRT1.0 kbNeoLoxPLoxPCasp2F/F-HFrDCasp2 Hep-HFrD****HFrD
Supplement Figure 2C) 42.510******82.0361.5241.0120.5000.0NCD CSDNCD CSDNCD CSD2.535***0.8*** 2.040.621.530.41.0210.20.5100.000.0NCD CSDNCD CSDNCD CSDNCD CSDE)48 10 (Weeks)F)Western DietCasp2-/-Sirius RedPositive **/-T W sp2Ca/-T W sp2Ca0.50.0******/-T W sp2Ca40200***/-T W sp2Ca0.3LdlrHmgcs*N.S0.20.10/-T W sp2Ca/-T W NF***Hmgcs00.30.20.560403020100WTCasp2-/-***H) .04LdlrG) 6403020100Water Intake(g/mouse/week)2*****/-T W 150N.SCol1a130403020100Liver TG (mg/g)BW (g)45Food Intake(g/mouse/week)WTCasp2-/-D)HmgcrSrebf2NCD CSDAcaca**************/-T W ig22.0N.S1.50.031.00.020.5***0.010.00.00NCD CSDNCD CSDSrebf1cB) 0.04αSMA150 2 4 6 8 10 -HFrDLiver Chol (mg/g)202520151050Fasn25N.SFood Intake(g/mouse/week)BW (g)A) 300.080.060.040.020.00******/-T W sp2Ca
Supplement Figure 3WTCSDCasp2-/--HFrD Pidd1-/--HFrD(vs WT-HFrD) (vs WT-HFrD)DOWN genes DOWN genes(v WTsUP WT HFrge -CS Dne Ds )A)6703725039195173256850*11155WTHFrDR(v aidDO s W d -/W T-H -HFNrge FrD Dne )1021s5438Expression z-scoreUP DOWNgenes genesWT-HFrD / WT-CSDCasp2-/--HFrD / WT-HFrDPidd1-/--HFrD / WT-HFrDRaidd-/--HFrD / WT-HFrDUP DOWNgenes 0.9-log10(FDR)Hallmark pathwaysWT Pidd1-/HFrD HFrDWT Raidd-/HFrD HFrD198 2 1 0 1 2B)WT Casp2-/HFrD HFrD01502.5CholesterolUnfoldedHomeostasis Protein ResponseExpression z-scoreExpression z-scoreExpression z-score 2 1 0 1 2 2 1 0 1 2 2 1 0 1 2
B)IP:HA InputIgGHAIgGHAA) Casp2-HA PIDD1-Flag RAIDD-6HIS EV p2 (F) IgGHISIgGHISIgHGIIg SGHISSupplement Figure 4 Casp2 (F)100100PIDD1 (F)IBIBPIDD1 yc-S1PRAIDD-6HISPIDD1-FlagCasp2-HAEV (F)100N.SN.SMyc IRE110050ERK(C)10050PIDD1-FlagPIDD1 DD-FlagF)MembraneV5-SREBP2 Myc-S1P RAIDD-6HIS PIDD1 DD-Flag PIDD1-Flag Casp2-HA EV S1PRAIDD-6HISPIDD1 DD-FlagPIDD1-Flag Casp2-HA EV (F)100V5N.SPDIN.SV515HDAC(C) 10050(F)10015Myc15MemNE braneE)RAIDDMembraneCytosolEV RAIDD EV RAIDD V5-SREBP2Myc-S1PRAIDD-6HISPIDD1-FlagCasp2-HAEV Myc(C)IRE1ERKPIDD1-CC256HISD)MembraneCytosolEV PIDD1 EV PIDD1 50 150507550
00*0.0150F/FSerum Insulin(µIU/ml)Food intake(g/week/mouse)******0.02p53ΔHepWTCSD HFrD gfβ1TNFD)***6Col1a10.200.150.100.050.00c/EBPβC)0 2 4B)N.SSO3946M8 10 12 (week) D KCMInsig1152520151050Insig2302520*BW (g)Supplement Figure 5A)DMSOMKC39465004003002001000N.S6SO 94MD KC3MDMSOMKC3946
Supplement Figure 6A)HFDB)MembraneScapΔHep/MUP5N.S640E)F)T HW pΔacSep*T HW pΔacSepK) 1510ΔHpT HeW .050.040.030.020.010.000.15*pT HeW pΔacST HepW pΔaScI)2500.1075**0.050.00pT HeW pΔacSOROOROSirius RedFAS***ScapΔHep***250Hsp90epap pSc Sca50ACCF/F*HFrDScapF/F ScapΔHepCd11bLiver Chol (mg/g)0.0 /F peFΔHap pSc ScaH)N.STgfβ**Serum Chol .10.0ep0.60.40.2Positive AreaPositive Area(%)/MHF(%)/MHFH&EN.S0.0150.010Pidd1***F/Fap pSc ScaMbtps10.050.00*Liver TG (mg/g)ΔHap pSc Sca0.060.040.020.000.150.10ep**T HepW pΔaScGrp78/BipF4/80Sirius RedSerum TG l1a1Positive Area Positive AreaPositive Area (%)/MHF(%)/MHF(%)/MHF***2.52.01.51.00.50.0J) F/MUPScapΔHep/MUP2UP UP/MHep /MΔap pSc ROF4/80Sirius RedN.SFF/HFDWTp-IRE1PDIC)10D)ScapF/F ScapΔHep/MUP /MUPMembranePositive AreaPositive AreaPositive ΔHepp-IRE1PDI15010050
SREBP2PDIMKC3946150501.5N.S1.00.50.0SO 946DM KC3MN.S0.40.30.20.10.0SO 946DM KC3MHmgcsDMSOSrebf2MembraneA)HmgcrSupplement Figure 7N.S0.80.60.40.20.0SO 946DM KC3M
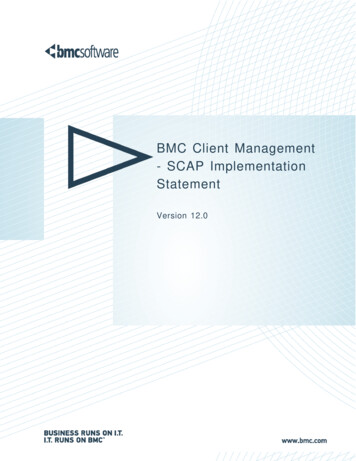
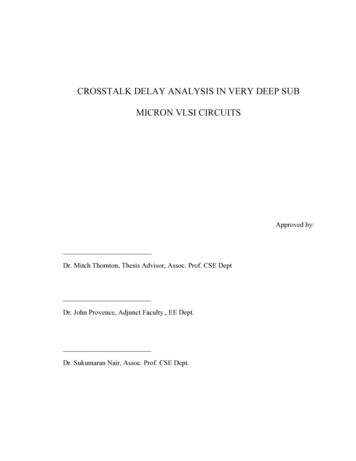
Figure S1, related to Figure 1. Hepatocyte-specific Casp2 ablation preventsfructose induced steatosis.WT mice were fed cornstarch (CSD, n 21) or fructose diet (HFrD, n 20) for 12 weeks.A. Body weight (BW) and food intake during the 12-week special diet feeding period.B. Representative H&E-stained formalin fixed paraffin embedded (FFPE) liver sectionsand ORO-stained frozen liver sections. Four HMFs were taken from each liver andquantified by Image J software. Quantification is on the right.C. Serum and liver TG and Chol from above livers.D. Relative BIP/Grp78 and Grp94 mRNA amounts (top) and p-eIF2a IB (bottom) in abovelivers.E. Relative TNF mRNA amounts in above livers.F. ATP concentration in above livers.G. A schematic illustration describing the generation of Casp2 floxed mice.H. BW and food intake during HFrD feeding in Casp2F/F and Casp2DHep mice.I. Relative fibrogenic gene mRNA amounts in HFrD-fed Casp2F/F or Casp2DHep livers.Results are mean SEM. Scale bar, 100 µm. Statistical significance was determined bytwo-tailed Student’s t test. *p 0.05, **p 0.005, ***p 0.001.Figure S2, related to Figure 2. PIDDosome components are required for fructoseinduced hepatosteatosis.A. BW and food intake during HFrD feeding in the indicated mice.B. Relative Scap, Insig1, and Insig2 mRNA amounts in livers of WT mice fed normal chowdiet (NCD, n 11) or CSD (n 16).
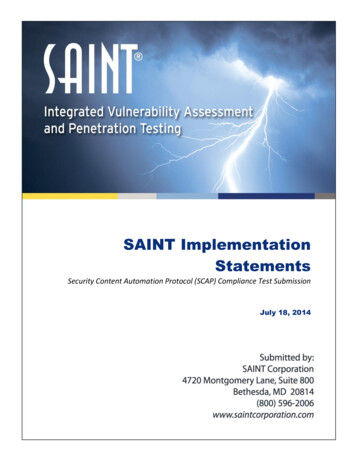
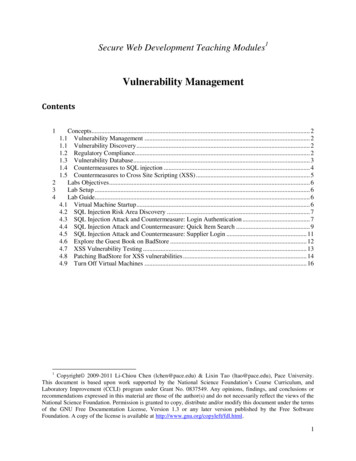
C. Relative lipogenic enzyme mRNA amounts in above livers.WT (n 9) and Casp2-/- (n 7) mice were fed Western diet along with 15% fructose andglucose water for 10 weeks.D. BW and food intake during Western diet feeding in the indicated mice.E. Representative H&E and Sirius red stained FFPE above livers. Quantification is on theright.F. Liver TG and Chol amounts in above livers.G-H. Relative mRNAs of lipogenic enzymes (G) and inflammatory, fibrogenic genes (H)in above livers.Results are mean SEM. Scale bar, 100 µm. Statistical significance was evaluated bytwo-tailed Student’s t test.*p 0.05, **p 0.005, ***p 0.001.Figure S3, related to Figure 3. PIDDosome components control fructose inducedlipid metabolizing genes.A. Venn diagram showing the overlapping genes from 4 comparison analysis andHeatmap showing differentially expressed genes between the groups. Four comparativeanalyses were conducted. Gene expressions were visualized with z-score.B. Relative expression of cholesterol homeostasis and unfolded protein response (UPR)pathways in indicated livers.Figure S4, related to Figure 4. PIDD1 and RAIDD are needed for Casp2 activation.
A-B. IP analysis of PIDDosome components using HA (A) or His (B) antibodies in lysatesof cells transfected with the indicated plasmids.C-D. Parental, PIDD1 (PIDD1D)-ablated (C) or RAIDD (RAIDDD)-ablated (D) HEK293cells were transfected with the indicated plasmids, membrane and cytoplasmic fractionswere separated, and the indicated proteins were detected by IB analysis.E. Schematic illustration of the PIDD1DDD construct.F. PIDD1D HEK293 cells were transfected with the indicated plasmids, and membranefractions were prepared and IB analyzed for the indicated proteins.Cleaved S1P is shown in the red box.F-Full length, C-Cleaved, P-precursor, N.S-non-specific, NE-nuclear extract.Each experiment was triplicated, and one representative result is shown.Figure S5, related to Figure 5. IRE1 inhibition prevents PIDDosome and SREBPactivation.WT mice were fed HFrD for 8 weeks, followed by DMSO (n 16) or MKC3946 (3 mg/kg,n 20) treatment for 4 weeks.A) BW increase during the HFrD feeding period. DMSO or MKC injected period isindicated by purple block. Food intake during the injection period.B) Serum insulin in above mice.C-D. Relative amounts of c/EBPb, INSIG1, INSIG2, SCAP (C) and inflammatory marker(D) mRNAs in above livers.E. IB of nuclear p53 in livers of CSD or HFrD fed WT mice and HFrD fed p53DHep mice(top) and representative H&E images (bottom).
Results are mean SEM. Scale bar, 100 µm. Statistical significance was determined bytwo-tailed Student’s t test. *p 0.05, **p 0.005, ***p 0.001.Figure S6, related to Figure 6. Scap ablation potentiates fructose induced ER stressand PIDDosome activation.Scap-floxed (ScapF/F/MUP, n 7) and liver specific Scap ablated (ScapDhep/MUP, n 4)MUP-uPA mice were fed with HFD for 12 weeks.A. H&E, F4/80, Sirius red staining of FFPE liver sections and ORO staining of frozen liversections from above mice.B. IB analysis of p-IRE1 in livers of above mice.C. Casp2 and PIDD1 IHC in livers of above mice.WT (n 12) and Scap ablated (ScapDhep, n 7) mice were high fat diet (HFD)- or HFD plus30% fructose water diet (HFHFD)-fed for 12 weeks. [HFD: (WT: n 12, ScapDhep: n 7)],[HFHFD: (WT: n 14, ScapDhep: n 10)]D. H&E, F4/80, Sirius red staining of FFPE liver sections and ORO staining of frozen liversection from HFD-fed indicated mice.E. H&E, Sirius red staining of FFPE liver sections and ORO staining of frozen liver sectionfrom HFHFD-fed indicated mice.WT (ScapF/F, n 13) and liver specific Scap ablated (ScapDhep, n 11) mice were fed HFrDfor 12 weeks.F. H&E of FFPE liver sections and ORO staining of frozen liver sections from above mice.G. Serum and liver TG and Chol from above mice.H. IB of lipogenic enzymes in livers of above mice.
I. IB of p-IRE1 in livers of HFHFD-fed indicated mice.J-K. Relative mRNAs of lipogenic enzymes (J) and ER stress, inflammatory, fibrogenicgenes (K) in livers of HFHFD-fed above mice.Four HMFs from each liver were taken, quantified by Image J software and the resultsare shown on the right. Results are mean SEM. Scale bar, 100 µm. Statisticalsignificance was determined by two-tailed Student’s t test. *p 0.05, **p 0.005, ***p 0.001.Figure S7, related to Figure 7. IRE1 inhibition alleviates ER stress and damage inthe HFrD-fed ScapDhep liver.A. IB analysis of SREBP2 and relative Srebf2, Hmgcr, and Hmgcs mRNA amounts inlivers of DMSO or MKC3946-treated HFrD-fed ScapDhep mice.Results are mean SEM. Statistical significance was determined by two-tailed Student’st test. *p 0.05, **p 0.005, ***p 0.001.Table S1. RNAseq analysis in HFrD-fed PIDDosome or Scap-ablated liver. Relatedto Figure 3.Table S2. Histologic score of HFrD- or WD-fed Scap-ablated liver. Related to Figure6.Data S1. Unprocessed data underlying the display items in the manuscript. Relatedto Figures 1-7 and S1-S7.
F4/80 *** Tgf β 0.05 0.10 . WT mice were fed cornstarch (CSD, n 21) or fructose diet (HFrD, n 20) for 12 weeks. A. Body weight (BW) and food intake during the 12-week special diet feeding period. B. Representative H&E-stained formalin fixed paraffin embedded (FFPE) liver sections