Transcription
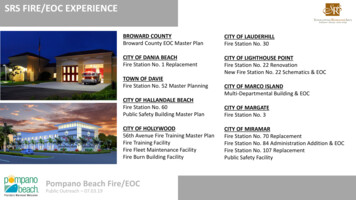
January 2022National Fire DepartmentRegistry SummaryFire departmentsThe U.S. Fire Administration’s National Fire Department Registry is a voluntary program, and it does notinclude all fire departments in the U.S. or its territories. As of January 2022, there were 27,164 registeredfire departments, which constitute about 91% of the departments estimated to be in the U.S.1Fire departments by census regionFigure 1 shows that most registered departments are located in Southern (36%) and Midwestern (31%)regions of the U.S.2 Less than 1% of the registered fire departments are in U.S. territories.Figure 1. Percent of registered fire departments by census region (January The National Fire Protection Association (NFPA) estimated that there were 29,705 fire departments in the U.S. in 2018 — the latestavailable estimate at the time of this analysis.2The regions of the U.S. are defined by the U.S. Census Bureau as the Northeast (Connecticut, Maine, Massachusetts, NewHampshire, New Jersey, New York, Pennsylvania, Rhode Island, Vermont); South (Alabama, Arkansas, Delaware, District ofColumbia, Florida, Georgia, Kentucky, Louisiana, Maryland, Mississippi, North Carolina, Oklahoma, South Carolina, Tennessee,Texas, Virginia, West Virginia); Midwest (Illinois, Indiana, Iowa, Kansas, Michigan, Minnesota, Missouri, Nebraska, North Dakota,Ohio, South Dakota, Wisconsin); and West (Alaska, Arizona, California, Colorado, Hawaii, Idaho, Montana, Nevada, New Mexico,Oregon, Utah, Washington, Wyoming).1
2National Fire Department Registry Summary — January 2022Fire departments by stateTable 1 shows the number of registered fire departments by state.Table 1. Number of registered fire departments by state as of January 2022 (includes District of Columbiaand U.S. DelawareDistrict of 81Nebraska393Nevada87New Hampshire213New Jersey718New Mexico248New York1,667North Carolina1,089
3National Fire Department Registry Summary — January 2022Table 1. Number of registered fire departments by state as of January 2022 (includes District of Columbiaand U.S. territories) — continuedStateNorth vania1,799Rhode Island68South Carolina440South Dakota293Tennessee635TexasU.S. ington400West nsThe registered departments represent 51,740 fire stations across the country. 3 Of the registered departments:ĵĵĵ68.3% have 1 station.16.8% have 2 stations.14.9% have 3 or more stations.Organization typeThe majority (96%) of registered departments are local fire departments that include career, combination andvolunteer fire departments and fire districts. The remaining 4% are comprised of state and federal government firedepartments, contract fire departments, private or industrial fire brigades, and transportation authority or airportfire departments.For counties in Georgia, Maryland, Nevada and Virginia, where it is known that both the county-level fire department registered and the individualfire departments affiliated with that county department also registered, the computation of the number of stations includes only the numberof stations reported by the county-level department to avoid counting stations twice.3
4National Fire Department Registry Summary — January 2022PersonnelThe registered fire departments are staffed by 1,216,200 personnel. 4 This figure includes career, volunteer andpaid-per-call firefighters, as well as civilian staff and nonfirefighting personnel. There were a total of 1,063,900 activecareer, volunteer and paid-per-call firefighters representing 87% of the registered departments’ personnel. Of theactive firefighting personnel:ĵĵĵ34% were career firefighters.54% were volunteer firefighters.12% were paid-per-call firefighters.Department typeOf the registered fire departments:5ĵĵĵĵCareer departments constitute 9.1%.Mostly career departments constitute 4.8%.Mostly volunteer departments constitute 15.7%.Volunteer departments constitute 70.4%.Department type by stateTable 2 shows the percent of registered fire departments by department type within each state and the District ofColumbia.Table 2. Percentages of registered fire departments by department type within each state and the Districtof Columbia (January loradoConnecticutDelawareDistrict of 65.9Mostly 0.031.614.4Mostly .975.08.213.3The department type is based on NFPA definitions. (Career — 100% of a department’s firefighters are career. Mostly career — 51% to 99% of adepartment’s firefighters are career. Mostly volunteer — 1% to 50% of a department’s firefighters are career. Volunteer — 100% of a department’sfirefighters are volunteer.) There were 91 fire departments that did not provide the number of active firefighting personnel. These departmentswere excluded from this analysis. Additionally, for counties in Georgia, Maryland, Nevada and Virginia, where it is known that both the countylevel fire department registered and the individual fire departments affiliated with that county department also registered, the computationof the number of personnel includes only the personnel counts reported by the county-level department to avoid counting personnel twice.Numbers of personnel were rounded to the nearest 100.5The number of fire department personnel is used to determine the department type. There were 91 fire departments that did not provide thenumber of active firefighting personnel. These departments were excluded from this analysis.4
5National Fire Department Registry Summary — January 2022Table 2. Percentages of registered fire departments by department type within each state and the Districtof Columbia (January 2022) — piMissouriMontanaNebraskaNevadaNew HampshireNew JerseyNew MexicoNew YorkNorth CarolinaNorth DakotaOhioOklahomaOregonPennsylvaniaRhode IslandSouth CarolinaSouth DakotaTennesseeTexasU.S. territoriesUtahVermontVirginiaWashingtonWest 73.670.08.365.187.770.839.290.678.870.270.4Mostly 415.7Mostly .74.82.94.910.61.21.60.94.8Notes: 1. State totals may not add up to 100% due to rounding.2. This analysis excludes 91 fire departments that did not provide the number of active firefighting 63.18.411.575.09.01.56.911.63.25.910.59.1
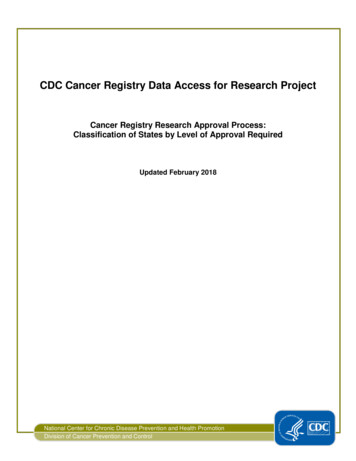
6National Fire Department Registry Summary — January 2022Figures 2 and 3 show the top 25 states (excluding the District of Columbia and U.S. territories) ranked by percentageof volunteer and career fire departments, respectively.Figure 2. Percent of registered volunteer and mostly volunteer fire departments top 25 states by rank(January h Dakota96.6South Dakota96.6Nebraska96.2Iowa95.8Vermont95.6West Virginia95.5Maine94.4New ma91.6North nd89.3New Jersey88.7New 40.060.080.0100.0120.0Note: There were 91 fire departments that did not provide the number of active firefighting personnel. These departments were excluded from this analysis.
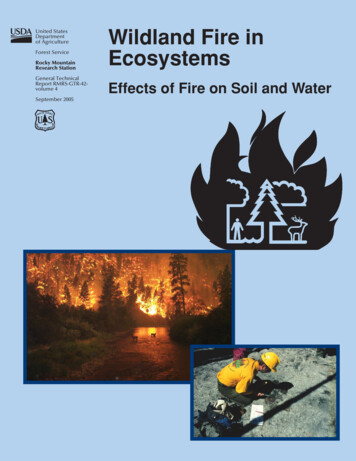
7National Fire Department Registry Summary — January 2022Figure 3. Percent of registered career and mostly career fire departments top 25 states by rank(January 44.9California44.5Rhode Island38.2Georgia28.0Colorado25.2South a15.0New 0.030.040.050.060.070.080.090.0100.0Note: There were 91 fire departments that did not provide the number of active firefighting personnel. These departments were excluded from this analysis.Specialized servicesTable 3 shows the percentage of registered fire departments that provide a specialized service. The leading specializedservices provided include vehicle extrication (77%), fire/injury prevention and public education (64%), wildfire/wildlandurban interface (WUI) (63%), and basic life support (BLS) services (60%). Only 5% of registered departments havefireboat service capabilities. Of the departments that provide fire investigation/fire-cause determination services,
8National Fire Department Registry Summary — January 202219% have sworn investigators with power to arrest. In addition, about 71% of the nation’s fire departments providesome level of emergency medical services (EMS).Table 3. Percentage of registered fire departments providing specialized services (January 2022)Specialized services providedPercentVehicle extrication77.4Fire/injury prevention and public education63.8Wildfire/WUI62.9BLS59.6EMS nontransport response39.6Technical/specialized rescue35.6Fire investigation/fire-cause determination35.3Fire inspection/code enforcement34.8Departmental (in-house) training academy21.8Advanced life support21.2EMS ambulance transport21.0Hazmat team17.9Juvenile firesetter intervention program13.7Airport/aviation8.0Fireboat4.7For statistics on fire department specialized services provided in each state, please visit the National Fire DepartmentRegistry (Annual Registry Snapshots).Primary agency responsible for emergency managementOf the registered fire departments:ĵĵĵ29% were the primary agency responsible for emergency management (EM) in their community.622% were not the primary agency responsible for EM in their community.49% had blank values for this data element.Fire departments by Federal Emergency Management Agency regionFederal Emergency Management Agency (FEMA) Regions V and IV accounted for 20% and 18% of the registered firedepartments, respectively (Table 4).7 Only 4% of the registered departments were in Region X.EM is the integration and coordination of all-hazards mitigation, prevention, preparedness, response and recovery activities within a communityfor all (or most) agencies such as fire, EMS, public information, volunteer service, etc.7The FEMA regions are defined as follows: Region I (Connecticut, Maine, Massachusetts, New Hampshire, Rhode Island, Vermont); Region II (NewJersey, New York, Puerto Rico, Virgin Islands); Region III (Delaware, District of Columbia, Maryland, Pennsylvania, Virginia, West Virginia); Region IV(Alabama, Florida, Georgia, Kentucky, Mississippi, North Carolina, South Carolina, Tennessee); Region V (Illinois, Indiana, Michigan, Minnesota, Ohio,Wisconsin); Region VI (Arkansas, Louisiana, New Mexico, Oklahoma, Texas); Region VII (Iowa, Kansas, Missouri, Nebraska); Region VIII (Colorado,Montana, North Dakota, South Dakota, Utah, Wyoming); Region IX (American Samoa, Arizona, California, Commonwealth of Northern MarianaIslands, Federated States of Micronesia, Guam, Hawaii, Nevada, Republic of Marshall Islands); Region X (Alaska, Idaho, Oregon, Washington).6
9National Fire Department Registry Summary — January 2022Table 4. Number and percentage of registered fire departments by FEMA region (January 2022)FEMA regionCountPercentRegion I1,4355.3Region II2,3938.8Region III3,08311.3Region IV5,00018.4Region V5,46720.1Region VI3,62213.3Region VII2,4128.9Region VIII1,5145.6Region IX1,1804.3Region X1,0583.927,164100.0Total departmentsNote: Total does not add up to 100% due to rounding.
Volunteer departments constitute 70.4%. Department type by state. Table 2 shows the percent of registered fire departments by department type within each state and the District of . Columbia. Table 2. Percentages of registered fire departments by department type within each state and the District . of Columbia (January 2022) State