Transcription
Understanding Investments in Collateralized LoanObligations (“CLOs”)
DisclaimerThis document contains the current, good faith opinions of Ares Management Corporation (“Ares”). The document is meant for information purposes only and is not intendedto present and should not be construed as any investment advice. This document is neither a recommendation of an investment nor an offer to sell or a solicitation of anoffer to purchase (or any marketing in connection therewith) any interest in Ares or any investment vehicles managed by Ares or its affiliates, the offer and/or sale of whichcan only be made by definitive offering documentation.No party should rely on the information set forth herein for investment purposes or otherwise. There is no guarantee that any projection, forecast or opinion in thesematerials will be realized. Past performance is neither indicative of, nor a guarantee of, future results. The views expressed herein may change at any time subsequent to thedate of issue hereof. The information contained herein does not take into account any particular investment objectives, financial situations or needs and individualcircumstances should be considered with investment professionals before making any decisions.Alternative investments can be highly illiquid, are speculative and may not be suitable for all investors. Investing in alternative investments is only intended for experiencedand sophisticated investors who are willing to bear the high economic risks associated with such an investment. Investors should carefully review and consider potential risksbefore investing. Certain of these risks include the following: loss of all or a substantial portion of the investment due to leverage; lack of liquidity in that there may be nosecondary market for a fund; volatility of returns; restrictions on transferring of interests in a fund; potential lack of diversification and resulting higher risk due to investmentconcentration and/or concentration of trading authority when a single advisor is utilized; complex tax structures; less regulation and higher fees than mutual funds.This document may contain forward‐looking statements. These are based upon a number of assumptions concerning future conditions that ultimately may prove to beinaccurate. Such forward‐looking statements are subject to risks and uncertainties and may be affected by various factors that may cause actual results to differ materiallyfrom those in the forward‐looking statements. Any forward‐looking statements speak only as of the date they are made and Ares assumes no duty to and does not undertaketo update forward‐looking statements or any other information contained herein. Ares may make investment recommendations and decisions that are contrary to the viewsexpressed herein and may sponsor and hold interests in investment vehicles that have holdings that are inconsistent with the views expressed herein.The document may not be copied, quoted, or referenced without Ares’ prior written consent.This may contain information obtained from third parties, including ratings from credit ratings agencies such as Standard & Poor’s. Reproduction and distribution of thirdparty content in any form is prohibited except with the prior written permission of the applicable third party. Third party content providers do not guarantee the accuracy,completeness, timeliness or availability of any information, including ratings, and are not responsible for any errors or omissions (negligent or otherwise), regardless of thecause, or for the results obtained from the use of such content. THIRD PARTY CONTENT PROVIDERS GIVE NO EXPRESS OR IMPLIED WARRANTIES, INCLUDING, BUT NOTLIMITED TO, ANY WARRANTIES OF MERCHANTABILITY OR FITNESS FOR A PARTICULAR PURPOSE OR USE. THIRD PARTY CONTENT PROVIDERS SHALL NOT BE LIABLE FOR ANYDIRECT, INDIRECT, INCIDENTAL, EXEMPLARY, COMPENSATORY, PUNITIVE, SPECIAL OR CONSEQUENTIAL DAMAGES, COSTS, EXPENSES, LEGAL FEES, OR LOSSES (INCLUDINGLOST INCOME OR PROFITS AND OPPORTUNITY COSTS OR LOSSES CAUSED BY NEGLIGENCE) IN CONNECTION WITH ANY USE OF THEIR CONTENT, INCLUDING RATINGS.REF: AM-001602
IntroductionPurpose: to educate and provide background about Collateralized Loan Obligations (“CLOs”) We intend to address the following topics:oWhat are CLOs?oHow are CLOs structured?oWhat are the underlying assets in CLOs?oHow have CLOs performed throughout different market cycles?3
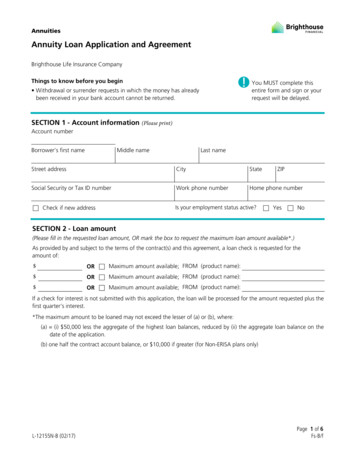
Understanding the Assets in CLOsCLO Securities are comprised of Senior Secured Corporate Loans (“Loans”) of larger companies Loans are the most senior debt of a company. Loans are secured bythe assets of the company. Should a company default, Loans havehistorically had high recoveries (on average 80% of par)(1) The Loans in CLOs are typically to larger companies – approximatelyhalf of Loans held in outstanding U.S. CLOs have facility sizes of over 1 billion(2) The Loan market today consists of 1.4 trillion(3) of Loans. Loansgenerally pay a floating-rate coupon comprised of a fixed spread overa base rate, typically LIBOR, which is reset monthly or quarterlyIllustrative Corporate Capital StructureCorporate Loansalso known asThe MostSeniorDebt Senior Securedor Bank Loans Investors can participate in the Loan market in several ways:– Purchase Loans directly (institutional investors only)Subordinated– Invest in mutual funds or closed-end Loan fundsor Mezzanine Debt– Invest in CLO Securities (institutional investors only) CLOs provide investors with exposure to actively managed,diversified portfolios of Loans. A single CLO Loan Portfolio can offerexposure to 200-300 individual LoansTotalSubordination40%-70%Equity A diversified portfolio of CLO Securities can offer investors aggregateexposure to over 1,000 U.S. companiesIllustrative corporate capital structure is shown for illustrative purposes only. LIBOR refers to “London Interbank Offered Rate”.1. Moody’s Investors Services, “Annual Default Study: Corporate Default and Recovery Rates, 1920-2017.”2. Source: Ares INsight database. Represents median loan facility size for Loans held within U.S. CLOs outstanding as of February 2, 2019. CLO market includes datafrom 917 CLOs across 122 managers.3. As of December 31, 2018. Source: Ares INsight database, Intex. Assumes a 1.15 EUR/USD exchange rate. S&P Capital IQ: S&P/LSTA Leveraged Loan Index,European Leveraged Loan Index (ELLI). Assumes a 1.15 EUR/USD exchange rate.4
CLOs are a Type of Loan Fund(1)1231LOAN MANAGER:An institutional assetmanager who activelymanages the CLO LoanPortfolio for the life ofthe fund.CLO LOAN PORTFOLIO:A diversified portfolioof Loans selected bythe Loan Manager.The Loan Portfoliocollateralizes the issuedSecurities.CLO SECURITIES:Securities issued by theCLO and purchased byinvestors.Loan ManagerManagement of CLO23CLO Loan PortfolioCLO SecuritiesActively managedPortfolio of200-300 LoansAAA-rated notes: 64%Avg. Portfolio Size: 500mmAvg. Credit Ratings:BPrincipal Interest4CLO InvestorsAA-rated notes: 10%Avg. Coupon:5.70%A-rated notes: 6%BBB-rated notes: 6%4CLO INVESTORS:Qualified institutionswho select CLOSecurities based on riskand return goals.Avg. Position Size:0.50%BB-rated notes: 4%CLO Equity: 10%A CLO consists of a Loan Portfolio and issued CLO Securities.There can be no assurance potential returns will be achieved. As with any investment there is risk, including the loss of principal.1. The sample CLO economics shown are for illustrative purposes only and based on a CLO structure Ares believes is typical of recent primary CLOs.5
How do CLOs Work?(1)1.2.3.4.A Loan Manager constructs a CLO Loan PortfolioThe capital needed to purchase the CLO Loan Portfolio is raised by issuing CLO SecuritiesInvestors participate in the CLO by purchasing CLO Securities, all of which are secured by the CLO Loan PortfolioThe cash flows generated by the CLO Loan Portfolio are distributed to the CLO Securities, pursuant to a priority of paymentsCLO Loan PortfolioCLO SecuritiesAnnual Interest Due 500mmDiversified Portfolioof LoansCLO Loan Portfolio Par 500,000,000CLO Loan Portfolio Interest (5.7%) 28,568,750Less CLO Expenses 328mmAAA-rated notes: 64%L 1.15%( 11,361,100) 53mmAA-rated notes: 10%L 1.70%( 2,127,288) 30mmA-rated notes: 6%L 2.05%( 1,309,125) 29mmBBB-rated notes: 6%L 3.05%( 1,555,488) 20mmBB-rated notes: 4%L 5.90%( 1,642,750) 50mmCLO Equity: 10%Excess 8,173,000( 400,000)B1 / B2 Average RatingWtd. Avg. SpreadL 3.40%plus LIBOR floors 5.7% Effective SpreadLess Loan Manager Fees( 2,000,000)Available Interest Proceeds 26,168,750Excess Payments to CLO Equity(16.3% cash yield)(2)There can be no assurance potential returns will be achieved. As with any investment there is risk, including the loss of principal.1. The sample CLO economics shown are for illustrative purposes only and are hypothetical, based on a CLO structure Ares believes is typical of recent primary CLOs.2. The CLO Equity cash yield on par is the estimated cash yield on the entire notional of the CLO Equity Security. CLO Equity Securities receive net incomedistributions provided the CLO remains in compliance with certain tests, including minimum overcollateralization ratios.6
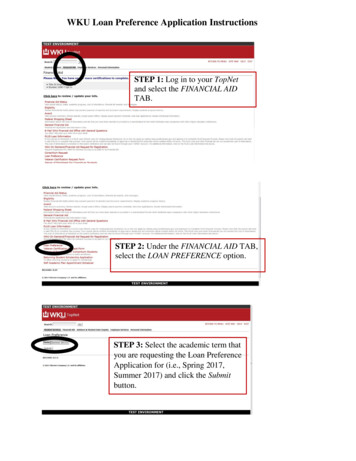
CLO Securities Benefit from Credit EnhancementsCLOs provide protection from losses in the underlying CLO Loan Portfolio in four key ways1 Asset CoverageAlso called overcollateralization, asset coverage provides a cushion against future defaults. Themore senior the tranche, the greater the overcollateralization.2 Excess SpreadCLOs are designed to generate excess interest income paid to equity investors. If the CLO Securityunderperforms, this income is reallocated to CLO Debt holders or used to replenish collateral.3 ActiveLoan Managers actively monitor and manage underlying Loan portfolios. Their management feesare generally linked to the performance and good health of the CLO Securities.Management4CovenantsCLOs include a number of features that are protective of CLO Debt tranches including LoanPortfolio diversification requirements and strict limits on certain risks and types of collateral.Credit enhancements substantially reduce the chances of default for CLO Debt SecuritiesAsset Coverage(1)DefaultResiliency(2)AAA155%30.1 CADRAA130%21.9 CADRA122%17.3 CADRBBB114%11.6 CADRBB109%7.5 CADRCase Study: 2018 Vintage CLOTrancheWith 9%, 14%, and 22% credit enhancement respectively, thedouble-B, triple-B, and single-A CLO Debt Securities canwithstand constant annual default rates of over 7%, 11%, and17% within the underlying CLO Loan Portfolio withoutsuffering a principal loss on the investment.As with any investment there is risk, including the loss of principal. For illustrative purposes only. Asset coverage and default resiliency characteristics will varyacross all CLO securities.1. Asset Coverage: measures the excess collateral in the fund to cover the given tranche. If a tranche has an asset coverage ratio of 115%, then for every dollar of debtthrough that tranche, there is 1.15 of collateral.2. Default Resiliency: measures the constant annual default rate within the underlying portfolio that a given CLO tranche can withstand before losing 1 ofprincipal. Also known as the “break-even default rate.” If a tranche has a 19% break-even default rate, the underlying portfolio can experience 19% annualdefaults for the life of the CLO before the tranche would be at risk of losing 1 of principal. By comparison, according to Moody’s and S&P, the long-runaverage default rate for speculative-grade credit is less than 3% per annum.7
Economics of CLO EquityAttractive investment characteristics include high current income, short investment horizon,exposure to senior corporate credit risk and potential return upsideInvesting in CLO Equity Today Current income may continue to be paid evenduring market stress CLO Debt spreads are at or near five-year tights Returns may improve as a result of Loan marketvolatilitySample CLO Economics (annualized)(1)ASSETSPAR AMOUNTCLO Loan Portfolio Market inefficiencies abound as CLO Equity tradesto a market Base Case despite wide 68,750EXPENSEDeal Expenses (0.08%)(400,000)Senior Loan Manager Fees (0.15%)(750,000)CLO Debt Securities Interest Expense(17,995,750)Contingent Loan Manager Fees (0.25%)TOTAL EXPENSES Potential for better than expected returns due toLoan Manager outperformanceAVG LOANCOUPONNET INCOME(20,395,750)( 4.08%)(INTEREST INCOME MINUS TOTAL EXPENSES)CLO EQUITY FACE AMOUNTCLO EQUITY CASH YIELD(2)(1,250,000)(NET INCOME / CLO EQUITY FACE)There can be no assurance potential returns will be achieved. As with any investment there is risk, including the loss of principal. Based on Ares’ marketobservations and analysis.1. The sample CLO economics shown are for illustrative purposes only and based on a CLO structure Ares believes is typical of recent primary CLOs.2. The CLO Equity cash yield on par is the estimated cash yield on the entire notional of the CLO Equity Security. CLO Equity Securities receive net incomedistributions provided the CLO remains in compliance with certain tests, including minimum overcollateralization ratios.88,173,00050,000,00016.3%
Life Cycle of a CLOCLOs typically have a legal term of 11-12 years, but CLO Securities are designed to be repaidearlier through a natural amortization of principal from Loan repayments120%After the Reinvestment Period, cash flowsfrom the CLO Loan Portfolio are usedto pay down the CLO Securities.During the Reinvestment Period, principal cashflows from the CLO Loan Portfolio can be reinvestedinto new Loans selected by the Loan Manager.40%20%LEGAL MATURITY60%AMORTIZATION PERIOD80%REINVESTMENT PERIODCLO Loan Portfolio Par BalanceCLO LOAN PORTFOLIO RAMP100%0%1231 - 6 months45678910 11 12 13 14 15 16 17 18 19 20 21 22 23 24 25 26 27 28 29 302 - 4 years1 - 4 yearsNote: Shown for illustrative purposes only. The terms of a given CLO will vary.92 - 4 years
Understanding the CLO Market and InvestmentPerformance
CLOs Have Consistently Accounted for Half of the Loan MarketCLOs constitute the largest class of institutional capital within the Loan market(1,2)A typical CLO Loan Portfolio(3) 50% of all Loans are heldwithin CLO Loan PortfoliosCharacteristicFund SizeBroadly Syndicated Loan Market Size ( bn)1,4001,2001,000CLOs hold 675 billion of the 1.4 trillion ofoutstanding Loans800Median Statistic 500mm# of Positions432Market Price95.68Yield7.82%First Lien %98%600Second Lien %2%400HY Bond %0%CCC exposure %4.7%200Credit Quality02002 2003 2004 2005 2006 2007 2008 2009 2010 2011 2012 2013 2014 2015 2016 2017 2018U.S. Loan MarketU.S. CLO AssetsEUR CLO AssetsEUR Loan MarketAs of December 31, 2018, unless otherwise noted.1.Source: Ares INsight database, Intex. Assumes a 1.15 EUR/USD exchange rate.2.Source: S&P Capital IQ: S&P/LSTA Leveraged Loan Index, European Leveraged Loan Index (ELLI). Assumes a 1.15 EUR/USD exchange rate as of December 31, 2018.3.As of December 2018. Source: Ares INsight database, Intex.11B
The Market for CLO SecuritiesA 675 billion market consisting of 1,490 CLOs and 10,400 unique CLO Securities(1) Twenty year old market: More than 1,920 U.S. CLOs have been issued since 1995, including 300 in 2018 (1) Active primary and secondary markets with more than 300 active institutional investors participating(3)Global CLO Secondary Market Activity(3)Global CLO Primary Market Activity(2)( bn)50( bn)2013: 91.7 2014: 141.9 2015: 114.4 2016: 93.0 2017: 143.7 2018: 159.510830620410200Q1 2013Q2 2013Q3 2013Q4 2013Q1 2014Q2 2014Q3 2014Q4 2014Q1 2015Q2 2015Q3 2015Q4 2015Q1 2016Q2 2016Q3 2016Q4 2016Q1 2017Q2 2017Q3 2017Q4 2017Q1 2018Q2 2018Q3 2018Q4 2018Q1 2013Q2 2013Q3 2013Q4 2013Q1 2014Q2 2014Q3 2014Q4 2014Q1 2015Q2 2015Q3 2015Q4 2015Q1 2016Q2 2016Q3 2016Q4 2016Q1 2017Q2 2017Q3 2017Q4 2017Q1 2018Q2 2018Q3 2018Q4 201840US CLO IssuanceEUR CLO IssuanceMezzanineFigures above are in USD. As of December 31, 2018. Assumes a 1.15 EUR/USD exchange rate.1. Source: Ares INsight database, Intex.2. Source: S&P LCD: “CLO Databank”.3. Source: Citi CDO Research.12Equity
CLO InvestorsLarge, sophisticated financial institutions dominate the CLO Security investor baseInvestor Base by CLO Security(1)CLO AAA PurchasesBank59%Asset Manager19%CLO Mezzanine PurchasesAsset Manager45%Insurance17%Other1%Hedge Fund1%1.Regional Bank /Pension Fund3%Regional Bank /Pension Fund2%Insurance27%CLO Equity PurchasesAsset Manager57%Hedge Fund23%Hedge Fund13%Other11%Other15%Bank1%Bank2%Source: Deutsche Bank Research. Represents U.S. CLO investor base as of November 2018.13Insurance3%
Credit Performance of Loans in CLO Securities vs. the MarketLoans within CLO Securities have generally experienced fewer defaults than the Loan and HighYield markets, particularly through the Great Financial Crisis We believe Loans held within CLO Loan Portfolios have performed better as a result of credit selection and activeportfolio management by the Loan ManagerDefault performance of Loans within CLO Securities vs. the Loan and High Yield an-990%Jan-01Jan-03Jan-05In Reinvest CLO Median Default RateJan-07Jan-09Jan-11Jan-13HY Bond Default Rate (by count)Jan-15Jan-17Loan Default Rate (by count)Past performance is not indicative of future results.Note: Great Financial Crisis is defined as the period just prior to and following the credit market dislocation of 2008.Source: Wells Fargo. “Loan Default Rate” per S&P LCD, represents the trailing 12-month default rate of all loans in the S&P/LSTA Leveraged Loan Index by count; “HYBond Default Rate” per Moody’s Investors Services, represents the issuer-weighted trailing 12-month default rate of spec-grade U.S. bonds; “In Reinvest CLOMedian Default Rate” per Wells Fargo, represents the median percentage of defaulted loans held within reinvesting CLOs at each point in time.14
Dispelling Myths about CLO Securities: “Didn’t they all blow up?”Cash Flow CLO Securities have performed remarkably well for two decades with no defaults,including through the Great Financial Crisis – in stark contrast to CDOs and Market Value CLOsAsset PerformanceMV CLOs 38 BN(1) 90% of the universe( 26 BN) hasexperienced anEvent of Default(1)High Grade / MezzABS CDOs 529 BN(1) 90% of the universe( 352 BN) hasexperienced anEvent of Default(1) See following slideRelatively strong collateralperformance. No events ofdefault during the credit crisisdue to structural robustness.Most deals have seenupgrades and a replenishmentof credit enhancementCash Flow CLOs 360 BN(1)Poor collateral performance,widespread downgrades (noupgrades), and few dealspositioned to repay principalto all debt securitiesApproximately 30%of all bank trustpreferred issuerseither deferring paymentsor in payment default(1)CRE CDOs 76 BN(1)TRUPsCDOs 40 BN(1)Past performance is not indicative of future results. Note: Great Financial Crisis is defined as the period just prior to and following the credit market dislocation of 2008.1. Source: Intex, Wachovia, Citi CDO Research: “CLO Equity – A Time-Tested, Well Performing Asset Class,” July 2010.“ABS” refers to Asset-Backed Securities, which are securities backed by the cash flows of a portfolio of debt. “CDOs” refers to Collateralized Debt Obligations,which are backed by the cash flows of various interest-bearing debt instruments such as commercial real estate loans (“CRE CDOs”), trust preferred securities(“TRUP CDOs”), tranches of other CDOs (“CDO 2”), and CLOs. “MV CLOs” refers to CLOs that are structured where performance is dependent on the marketprice volatility and liquidity of the underlying portfolio rather than from cash flows generated by the underlying portfolios as in Cash Flow CLOs.15Structural StabilityCDO 2 37 BN(1)MV-based triggers led tomost transactionsbreaching default testsand subsequentlyliquidating or beingrestructured in 2008
Very Low Default History of CLO SecuritiesThe historical default experience of CLO Securities has been minimal to near zero over two decades S&P cites a very low historical U.S. CLO default rate of 0.41% over nearly two decades; however, we believe even this lowdefault rate is inflated since it captures a number of defaults caused by market value provisions or CLO Securities that werenot predominately comprised of LoansS&P U.S. CLO Default History By Rating (1994-2013)(1)Original RatingTotal TranchesDefaulted TranchesDefault RateLoss .61%1.13%Total6,141250.41%0.04%Past performance is not indicative of future results.1. Source: S&P LCD. “Twenty Years Strong: A Look Back at U.S. CLO Ratings Performance From 1994 Through 2013,” January 31, 2014. Includes all U.S. cash flow CLOtranches ever rated as of year-end 2013. Default rate number of ratings that had ratings lowered to D / total number of ratings. Loss Rate sum of losses dividedby sum of issuance amounts; market values from trustee reports used to estimate tranche losses when necessary; tranches without available loss data excluded.16
CLO Equity Performance During the Great Financial CrisisWhile CLO Equity cash flows were impacted by Loan defaults during the Great Financial Crisis, themedian U.S. CLO continued to make current distributions to CLO Equity through the peak of the stressLSTA 12mo Lagging LoanMarket Defaults (Left axis)CLO EquityDistributions 12moLagging (Right axis)Top Quartile9%30%6%20%Median3%10%Bottom st performance is not indicative of future results. Note: Great Financial Crisis is defined as the period just prior to and following the credit market dislocation of 2008.Source: S&P LCD, Intex, Ares INsight database. LSTA refers to the Loan Syndications & Trading Association.17Annual CLO Equity Cash YieldCorporate Loan Market Default RatesU.S. CLO Equity Cash Flow Performance vs. Loan Market Defaults
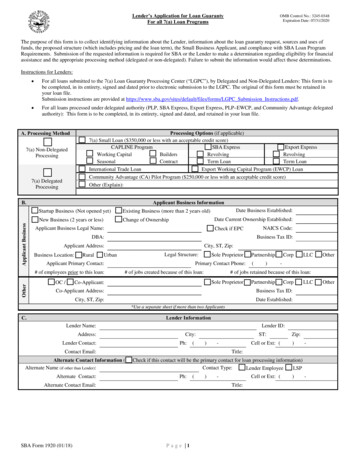
CLO Equity Performance – Current Default Scenario AnalysisIf a representative CLO Loan Portfolio were to incur 2x the default rate experienced by Loans heldin CLOs in 2007-2011, the CLO Equity would return a 4.0% IRRDefault ScenariosLoss-Adjusted IRR14.6%8Scenarios stressed loan defaults6No credit was given to higher spreads orlower loan prices for reinvestment in adistressed loan market4No credit was given to the exercise ofequity options (including refi, reset or call)Period (months)Source: Ares. Based on a representative 2018 vintage CLO.Please refer to slide 21 for scenario assumptions. This information is shown for illustrative purposes only. There can be no assurance that investors will experienceresults equal to the scenarios presented herein. Any investment involves risk, including the potential loss of principal.184947454341393735033No credit was given to CLO managertrading activity231-3.8%292007-2011 2x S&P LLI102711.4%252007-2011 S&P LLI12234.0%14212007-2011 2x Loans in CLOs12.2%192007-2011 Loans in CLOs1617-14.5%155x Base Case (10% CADR)1813-5.2%114x Base Case (8% CADR)92.1%73x Base Case (6% CADR)Base2x Base3x Base4x Base5x BaseCLOsS&P LLI2x CLOs2x S&P LLI2059.2%32x Base Case (4% CADR)1Base Case (2% CADR)Loan Default RateDefault Scenario
ConclusionSummary The CLO market has grown at a similar rate as the overall Loan market Loan default rates within U.S. CLOs generally are well below those of Loans and bonds broadly Minimal to no cash flow CLO defaults have occurred throughout the 20 year history of the asset class(1) Assuming Loans default at 2x the rate of Loans held within CLOs during the Great Financial Crisis, themost junior tranche of CLOs (i.e. equity) would still generate a positive 4.0% IRR We find that concerns over lower recoveries caused by ‘cov-lite’ loans to be exaggerated because theyfail to account for several mitigating factors, including:Asset security and the senior position that first-lien loans enjoy matter more than covenants, and always haveo Credit discipline and fundamental credit risk underwriting are critical factors in loss mitigation, and always have beeno We expect today’s cohort of loans will deliver a range of performance outcomes based on all of these factors.Covenant terms are certainly one of these factors, but we consider the other factors to be more importantoPast performance is not indicative of future results. Note: Great Financial Crisis is defined as the period just prior to and following the credit market dislocation of 2008.1. While S&P cites a very low historical U.S. CLO default rate of 0.41% over nearly two decades, we believe this default rate is inflated since it captures a number ofdefaults caused by market value provisions or CLO Securities that were not 100% comprised of Loans.19
Notes
Notes to Slide 18Scenario analytics were conducted using INTEX. These materials contain "forward-looking" information that is not purely historical in nature, and such information may include, among other things,projections, forecasts or estimates of cash flows, yields or returns, scenario analyses and proposed or expected portfolio composition. The forward-looking information contained herein is based uponcertain assumptions about future events or conditions and is intended only to illustrate hypothetical results under those assumptions (not all of which will be specified herein). Not all relevant events orconditions may have been considered in developing such assumptions. The success or achievement of various results and objectives is dependent upon a multitude of factors, many of which are beyondthe control of Ares. No representations are made as to the accuracy of such estimates or projections or that such projections will be realized. Actual events or conditions are unlikely to be consistent with,and may differ materially from, those assumed. The results above do not reflect actual client trading. Ares does not undertake any obligation to publicly update or review any forward-looking information,whether as a result of new information, future developments or otherwise, except as required by law. All investments involve risk, including possible loss of principal. All scenario analysis was performed using INTEXcalc. Cash flow projections based on a 2018 vintage CLO which Ares believes to be representative of deals in the market. All projections are based on forward LIBOR rates. All interest rates are as of January 18, 2019. Certain tranches are currently trading at prices assuming a near-term reset of the liabilities – the override prices reflect pricing without this assumption for purposes of calculating stressed returns (vs.option value). Loan default rates are graphically illustrated as either a constant default rate (CADR) or a vector of monthly defaults. Recovery rates are assumed to be: first lien loans: 80% second lien loans or high yield bonds: 30% currently defaulted loans at the lower of the above recovery rates or the current bid price of the loan as reported by Intex Recoveries are assumed to be realized with a six-month lag. Recovery ‘cash’ is assumed to be reinvested during the month in which is received (vs. available as cash to cure tests). Loans are assumed to prepay at a rate of 20% per year. During the reinvestment period, principal is assumed to be reinvested into new loans with a 6yr maturity, L 3.50% coupon at a price of 99.50. Highly restricted reinvestment activity was assumed tooccur during the first year following each CLO’s reinvestment period. CLO was assumed to be unwound / liquidated 12 months following the end of the reinvestment period.21
Alternative investments can be highly illiquid, are speculative and may not be suitable for all investors. Investing in alternative investments is only intended for experienced and sophisticated investors who are willing to bear the high economic risks associated with such an investment. Investors should carefully review and consider potential .