Transcription
HealthyBureauFamilies,of Health CommunitiesTennCareFiscal Year 2008-2009 Annual Report
State of TennesseeDepartment of Finance and AdministrationBureau of TennCare310 Great Circle RoadNashville, TN 37243Dear Tennesseans:Once again, I’m pleased to share with you the accomplishments of the Bureau ofTennCare in this annual report for the State Fiscal Year of 2008-2009.TennCare continues to play a critical role in providing health care to Tennessee’smost vulnerable population. Our improved operational stability not only enables theBureau to meet our enrollees’ needs, but also allows us to use our resources moreeffectively to benefit those who really need services.Creating more long-term care options for our state’s elderly and disabled population,moving toward a complete medical and behavioral health integration, and eliminatingall state audit findings– these are but a few of TennCare’s ongoing accomplishments.Looking ahead to the future, the Bureau will begin the federally-approved reverification process for members of the Daniels class to ensure that we provide servicesonly to those eligible for the program, while allowing us to ensure the state’s limitedfinancial resources are used appropriately. The Bureau will also continue to look forways to improve its operational efficiency in order to be a responsible steward of taxpayer dollars and remain in a position to help with the state budget as a whole duringthese difficult economic times.In the following pages, we will provide a closer look at the Bureau of TennCare’sachievements and our continued plans for success. I hope you will find this annualreport useful in reflecting on the progress made in Fiscal Year 08-09.Sincerely,Darin GordonDeputy Commissioner
FY 2008 - 2009 Annual Report Table of ContentsEXECUTIVE STAFFBudget. 1ServicesService Delivery Network. 2Service Listing. 3Enrollment. 4Medical Services. 5Pharmacy Services. 6Dental Services. 6Behavioral Health Services. 7Long-Term Care Services. 7TennCare Eligibility and Poverty Guidelines. 8TennCare Expenditures by County. 10Milestones TennCare Progress Federal Court Grants TennCare Relief from Long-StandingCourt Order . 12TennCare Moves Forward with CHOICES Implementation. 13TennCare Expansion in Home and Community Based ServicesApproved by Feds . 13CMS Approves Changes to Home Health and Private DutyNursing Coverage. 14American Reinvestment and Recovery Act’s Impact onTennCare. 14New Managed Care Organizations Begin Serving Members inEast and West Tennessee . 15TennCare Mental Health Services Integrated into Managed CareStructure . 15TennCare Implements New Pharmacy Benefits Manager. 16Zero Audit Findings for TennCare . 16Grants Nursing Facility Diversion Grants . 17Darin GordonDeputy CommissionerWendy Long, M.D.Chief Medical OfficerScott PierceAssistant Commissioner,Chief Financial OfficerGene GrasserProgram Integrity and AuditPatti KillingsworthAssistant Commissioner,Chief of Long Term CareTracy PurcellDirector of Member ServicesKeith GaitherDirector of Managed CareOperationsSusie BairdDirector of PolicyBrent AntonyChief Information OfficerRecognition Gordon Appointed to Chair Quality Technical Assistance Group 17Dr. Long Appointed to NCQA Boad. 17Terry LeveGeneral CounselMike ColeDirector of OperationsKelly GundersonDirector of Communications
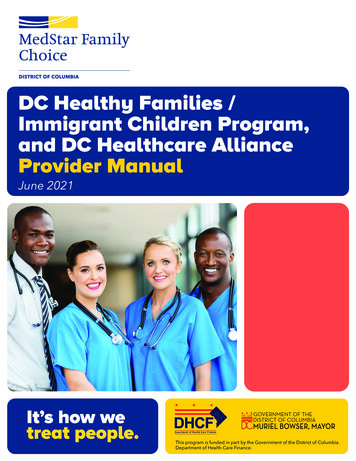
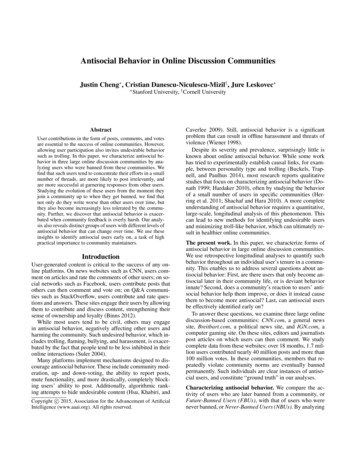
FY 09 Expendituresby Category Pharmacy expenditures brought back to reasonable percentage of total TennCare expenditures Medical service costs are the largest percentage of total TennCare expendituresMedical and Behavioral Services 3,569,380,500Mental Retardation Services (ICF/MR and HCBS)874,218,400Nursing Facility Services1851,714,400Pharmacy737,585,300Medicare Cost-Sharing2611,285,600Supplemental Payments to rtment of Children’s Services Funding213,815,000Dental165,194,400HCBS (eldery and disabled) and PACE Programs89,221,600Gov.’s Office of Children’s Care CoordinationTotal7,040,900 7,688,345,700Does not include HCBS services. HCBS services are listed separately in this chart.Includes Medicare Part D clawback. These services are not included in the service listing on page 3.3Administration includes funding for eligibility determination by DHS in all county offices and outreach in local health department.12Department ofChildren’s ServicesFunding, 2.78%Dental, 2.15%HCBS and PACEPrograms, 1.16%Administration, 3.35%SupplementalPayments to Providers,4.05%Medicare CostSharing, 7.95%Medical and BehavioralServices, 46.43%Pharmacy, 9.59%Long-Term Care,11.08%Mental RetardationServices, 11.37%1
Service DeliveryNetworkTennCare’s service delivery network is the framework by which we deliver care to ourenrollee population. The network comprises physical health, mental health, pharmacybenefits and dental benefits.Managed dleOut e-West161,900AmerigroupBlue Care-EastWest183,923238,249Blue %190,45015.81%TennCare re 390,222372,9488,7151,204,520100.0%Regional ls in counties bordering Grand Regions might show up differently when segregatingbetween regions by MCO & BHO assignment. Enrollees might live out-of-state for severalreasons, such as attending an out-of-state college while maintaining Tennessee residency;residents temporarily out of the state; or residing in an out-of-state medical institution for aprolonged period. Enrollment is as of January 1, 2009.1In the TennCare program, Managed Care Organizations (MCOs) coordinate health care delivery to our enrollees.This chart depicts enrollment as of January 1, 2009. The Middle Tennessee plans, AmeriChoice and Amerigroup,were selected via a competitive bid process and provide both physical and behavioral health care. In East and WestTennessee, enrollees are assigned to an MCO for their physical health services and a BHO for their behavioral healthservices.TennCare Select serves as the state’s backup health plan to provide services when there are MCO-capacity issues. Italso provides services to certain special populations that the state has identified like children in state custody, childrenreceiving SSI benefits and children in an ICF-MR.2
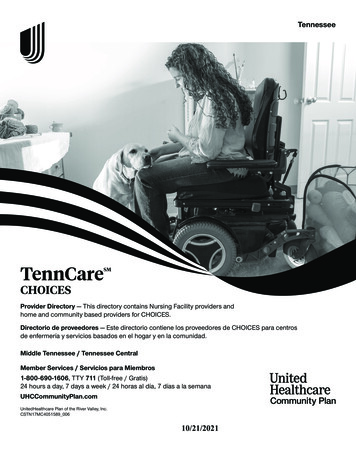
For an enrollee to receive services, the services must bemedically neccessary.As of June 30, 2009, TennCare covered the following services: Community health services Dental services for enrollees under 21; for enrollees21 and older, services are limited to the completion ofcertain orthodontic treatments initiated before enrolleesturn 21 Durable medical equipment Emergency ambulance transportation – air and ground EPSDT services for Medicaid enrollees under 21;preventive, diagnostic and treatment services forTennCare Standard enrollees under 21 Home and Community Based Services (HCBS) forcertain persons with mental retardation or personsServiceListingFY 09 Expenditures by Service CategoryProgram AmountMedical and Behavioral ServicesLong-Term Care/HCBS1 3,569,380,500 940,936,000determined to be elderly or disabled*Mental Retardation Services 874,218,400 Home health carePharmacy 737,585,300 Hospice careDental 165,194,400 Inpatient and outpatient substance abuse benefitsTotal – Selected Programs 6,287,314,600(lifetime limit of 30,000 for adults 21 and older)1Does not include Medicare cost sharing. Inpatient hospital services Lab and X-ray services Medical supplies Mental health case management services Mental health crisis services Non-emergency transportation Nursing facility services (including Level 1, Level 2 andICF/MR services)* Occupational therapy Organ-and tissue-transplant services and donor organ/tissue-procurement services Outpatient hospital services Outpatient mental health servicesLong-Term Care15% Pharmacy services Physical therapyMedical and Behavioral Physician services57%Mental Retardation Private duty nursingService By CategoryServices14% Psychiatric inpatient services Psychiatric rehabilitation services Psychiatric residential treatment services Reconstructive breast surgery Rehabilitation services Renal dialysis clinic services Speech therapy Vision services for enrollees under 21Pharmacy12%Dental3%* HCBS and nursing facility services are provided outsidethe managed-care setting.3
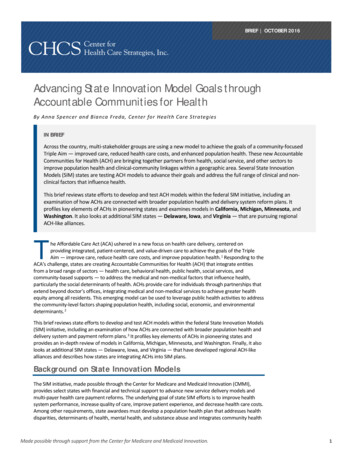
EnrollmentEnrollment by Eligibility Category and RaceCategoryWhiteBlackHispanicOtherGrand TotalExpansion Population23,9215,3342,51791332,685Mandatory l Medicaid19,6379,74279347030,642Grand Total711,545373,87254,00865,0951,204,520Enrollment by Eligibility Category and AgeCategory0 to 2021 to 6465 Grand TotalExpansion Population32,0925167732,685Mandatory Medicaid632,181424,82084,1921,141,193Optional Medicaid24,7905,41943330,642Grand Total689,063430,75584,7021,204,520Expansion consists for Standard enrollees, while the Optional categoryprimarily consists of State Aid category MA T, Medical Assistance forChildren Under 21 or pregnant.1TennCare Beneficiaries by Gender(on Jan. 1, %4
MedicalServicesTop Five Diagnoses by Cost1Inpatient Hospital1. Liveborn16.75%2. Respiratory failure; insufficiency; arrest (adult)2.89%3. Short gestation; low birth weight; and fetal growthretardation2.87%4. Other perinatal conditions2.81%5. Septicemia (except in labor)2.65%Percentage of all Inpatient Expenditures27.96%Outpatient1. Spondylosis; intervertebral disc disorders; otherback problems3.88%2. Abdominal pain3.50%3. Chronic renal failure3.22%4. Other upper respiratory infections3.05%5. Nonspecific chest pain2.86%Percentage of All Outpatient Expenditures16.51% Inpatient hospitalization rate was 136admissions per 1,000 enrollees Average inpatient length of stay wasfour days per admission Emergency room utilization was 780visits per 1,000 enrollees 83% of all TennCare enrollees visited aphysician at least once during the yearPhysician21. Spondylosis; intervertebral disc disorders; otherback problems4.67%2. Normal pregnancy and/or delivery3.97%3. Other upper respiratory infections3.75%4. Otitis media and related conditions3.61%5. Other complications of birth; puerperium affectingmanagement of mother2.92%Percentage of All Physician Expenditures18.92%Does not include behavioral health expendituresAdministrative related diagnoses were excluded. They accounted for 61,801,866 in expenditures or 5.6% of total expenditures.12MCO Medical Expenditure by Category of Service (Selected Services)Providers withPaid ClaimsFY 09RecipientsExpendituresPer RecipientFY 09 Actual Nos.Hospital Facilities (Including care provided throughhospitals (both Inpatient and Outpatient), FederallyQualified Health Centers (FQHC), AmbulatorySurgical Centers, etc.)3,915723,003 2,147.58 1,552,707,925Physician23,5651,029,873 981.31 1,010,629,573Durable Medical Equipment1,84883,258 1,069.43 89,038,67834310,827 25,700.44 278,258,6661,241472,980 352.03 166,505,433Category of ServiceHome HealthOther Services (Transportation, Lab, Hospice)5
Pharmacy ServicesTennCare utilizes a preferred drug list (PDL) to managethe pharmacy benefit. Some drugs require prior approval.During fiscal year 2008-2009, 76 percent of TennCarereimbursed prescriptions were generic and 24 percent werebrand name.Services Delivered throughPharmacy Benefits Manager (PBM)Brand name drugs accounted for 74 percent of pharmacyexpenditures, with an average cost per prescription of 178for a brand name prescription, compared with 21 for ageneric prescription.ExpendituresPer RecipientFY 09Expenditures7,557874,018 843.90 737,585,300Top Five Drugs By Number of ClaimsBrand NameGeneric NameDrug TypeNumber Narcotic672,156ExpendituresLortab , Vicodin ,various otherbrandsAmoxil ,A-Cillin , variousother omax AzithromycinAntibiotics259,775Prinivil , Zestril LisinoprilBlood Pressure227,826Singulair MontelukastSodiumAsthmaMedication216,823Top Five Drugs by CostBrandNameGeneric NameSeroquel QuetiapineFumarateAntipsychotic 30,527,658.04Synagis PalivizumabPrevent RespiratorySyncytial Virus (RSV) 24,872,714.90AntipsychoticFY 09RecipientsNote: Figures represent enrollees who utilize pharmacy services.TennCare enrollees who utilized pharmacy servicesaveraged 14 prescriptions per year in FY 09.Drug TypeProviders withPaid ClaimsRisperdal Risperidone 24.059,523.73Singulair MontelukastSodiumAsthma Medication 23,643,095.47Abilify AripiprazoleAntipsychotic 21,025,514.80Dental ServicesServices Delivered through theDental Benefits Manager (DBM)During FY 09, medically necessary dental services were covered for enrollees under 21.Percent of enrollees age 3 - 20 receiving a dental service is 59%.Dental ServicesProviders withPaid ClaimsFY 09RecipientsExpendituresPer RecipientFY 09Expenditures1941329,375 501.54 165,194,400Does not include Health Department Dental Program16
BehavioralHealth ServicesTop Five Mental Health Diagnoses by CostInpatient Hospital 62% of enrollees receiving mental health care areeither adults designated as SPMI (Seriously andPersistently Mentally Ill) or children designated asSED (Seriously Emotionally Disturbed)1. Episodic Mood Disorders36.7%2. Schizophrenic Disorders20.1%3. Drug Dependence7.9%4. Sexual and Gender Identity Disorders5.6%5. Other Non-organic Psychoses4.0%% of all Inpatient Expenditures74.3%Outpatient Approximately 7.3% of the entire TennCarepopulation are SPMI/SED enrollees 86.9% of dollars spent on mental health care is forSPMI/SED enrollees1. Drug Dependence28.0%2. Episodic Mood Disorders15.8%3. Schizophrenic Disorders14.2%4. Pervasive Developmental Disorders10.7%5. Hyperkinetic Syndrome of Childhood% of All Outpatient ExpendituresMental Health Clinics and Institutional ServicesRecipientsExpenditures PerRecipientExpenditures1, 21,378164,113 2,091.28 377,292,255Excludes case management services, transportation and other communityservices where payment to provider was a capitated arrangement.2Total expenditure reflects the total proportion of administration feespaid to contracted MCOs, based on the proportion of total medical andbehavioral health expenditure incurred in FY 09.1. Adjustment Reaction69.1%2. Episodic Mood Disorders11.6%3. Schizophrenic Disorders8.0%4. Hyperkinetic Syndrome of Childhood4.1%5. Anxiety Dissociative and SomatoformDisorders1.7%% of All Physician ExpendituresLong-Term Care ServicesNumber ofProvidersNumber ofRecipientsAverage ExpenditurePer RecipientTotalExpenditure1Intermediate Care- Nursing Facility229119,379 40,284 780,665,800Skilled NursingFacility22231,734 47,688 82,690,600HCBS - Elderly andDisabled3323,958 19,457 77,012,5001325 37,566 12,209,100Category of ServicesPACE Program74.3%PhysicianProviders withPaid Claims15.6%Number of recipients reflects the number of people recieving services as of Jan. 1, 2009.Includes offsets for patient liability.12794.5%
TennCare Eligibility ChartAnnual and Monthly Income in DollarsThese two charts set forth the income and resource levels that applicants must meet before they can be determined eligible for TennCare.Family Size1234567865%75%100%120%133%135%185%200%250%Mo 563 650 867 1,040 1,153 1,170 1,603 1,733 8,06065,86071,20089,000Note: For each additional person add 3,600 annually or 300 monthlyTennessee Medicaid Coverage Groups and Eligibility RequirementsCoverKids *50%Age 0-21Age 6-19Age 1-5Age 0-125%0%ChildrenFamilies8Standard Spend Down**Long Term Care74QI 1135SLMB120QMB100SSI – Active &Related CategoriesPLIS75%PLISPLIS100%100Pregnant Medically Needy125%140Breast or Cervical Cancer Under 65133200QDWI200185PregnantTennCare Standard Medically EligibleAge 0-19150%Medically Needy175%185Transitional MedicaidTennCare Standard185Age 0-19200221AFDC MO225%200%250250250%WomenAged, BlindOr DisabledMedicareCostAdults Sharing
TennCare Eligibility CategoriesCategoryProgramDescriptionIncome LimitWomenChildrenLow income children age 0 up to 1st birthdayPLIS(Poverty Level Low income children age 1 to 6th birthdayIncomeStandard)Low income children age 6 to 19th birthdayAged, Blind &DisabledAdults133% of poverty - No resource test100% of poverty - No resource testMedicallyNeedyChildren up to age 21. Must either have low income or have Monthly spend-down levels of 241 (1), 258 (2), 317 (3),sufficient unreimbursed medical bills to spend down to 325 (4), 392 (5), 408 (6), or 467 (7), depending uponrequisite income limits.family size - Resource: 2,000 (1), 3,000 (2), add 100 peradditional individual ***StandardRolloverChildren under age 19 who do not have access to insurance. Below 200% of poverty - No resource testCategory is only open to children who lose Medicaideligibility and rollover into Standard.StandardMedicallyEligibleChildren under age 19 who do not have access to insuranceand who have health conditions that make the childuninsurable. Category is only open to children who loseMedicaid eligibility and rollover into Standard.No income or resource testAFDC MOIndividuals who meet basic Families First criteria for TitleXIX, but do not qualify for certain technical components ofFamilies First.Monthly income levels of 1217 (1), 1574 (2), 1837 (3), 2011 (4), 2257 (5), 2379 (6), or 2518 (7) depending uponfamily size, subject to disregards - Resource: 2,000 (1)TransitionalMedicaidIndividuals who lose Families First due to earned income or 185% of poverty during months 7 - 12increased work hours may receive 12 months of Medicaid.PregnantLow income pregnant women.NOTE: Newborns born to Medicaid –eligible women aredeemed eligible for one year.Breast orCervicalCancerWomen under 65 who are not eligible for any other category 250% of poverty - No resource testof Medicaid and have been diagnosed as the result of ascreening at a Centers for Disease Control and Prevention(CDC) site with breast or cervical cancer, including precancerous conditions and who are in need of treatment forthe cancer.PregnantMedicallyNeedyMedicare Cost Sharing185% of poverty - No resource testPregnant women. Must have sufficient unreimbursedmedical bills to spend down to requisite income limits.SSIActive: Low income aged, blind, or disabled recipients of(Supplemental federal SSI cash payments as determined by SSASecurityIncome)185% of poverty - No resource testMonthly spend-down levels of 241 (1), 258 (2), 317 (3), 325 (4), 392 (5), 408 (6), or 467 (7), depending uponfamily size - Resource: 2,000 (1), 3,000 (2), add 100 peradditional individual74% of povertyResource: 2,000 (1), 3,000 (2)Low income individuals who require care in a nursingfacility or intermediate care facility for the mentallyretarded or who receive Home and Community BasedServices in their home 2,022/month (300% of the SSI benefit rate) - Resource: 2,000StandardSpend DownNon-pregnant adults who are aged, blind, disabled orcaretaker relatives and who have too much income andhave sufficient unreimbursed medical bills to spend downto requisite income limits. This category is not currentlyopen to new enrollees.Monthly spend-down levels of 241 (1), 258 (2), 317 (3), 325 (4), 392 (5), 408 (6), or 467 (7), depending upon family size - Resource: 2,000(1), 3,000 (2), add 100 per additional individualQMBQualified Medicare Beneficiary - TennCare pays Medicarepremiums, deductibles and co-insurance for those eligiblefor Medicare Part A100% of poverty - Resource: 4,000 (1), 6,000 (2)SLMBSpecified Low Income Medicare Beneficiaries - TennCarepays Medicare Part B premiums onlyBetween 100% and 120% of poverty - Resource: 4,000 (1), 6,000 (2)Qualified Individuals - TennCare pays Medicare Part Bpremiums onlyBetween 120% and 135% of poverty - Resource: 4,000 (1), 6,000 (2)Qualified Disabled Working Individual - TennCare paysMedicare Part A buy-in for non-aged individuals who lostSSI disability benefits and premium free Part A200% of poverty - Resource: 2,000 (1), 3,000 (2)Long-TermCareQI 1QDWI* CoverKids is a state of Tennessee SCHIP program managed by Cover Tennessee and is not part of the Medicaid TennCare program.** (aged, blind, disabled & caretaker relatives) not currently open to new enrollees.*** Numbers in parentheses refer to the number of members within a family.9
TennCare Expenditures and Recipients by CountyEnrollmenton 1-Jan-09Estimated 2009Population% of Countyon TenncareTotal ServiceExpenditure1, 2, 3ExpenditurePer Member% CountyExpenditure% CountyEnrollment% CountyPopulationANDERSON14,40174,16919.2% 79,750,625 5,5381.2%1.2%1.2%BEDFORD10,03544,69622.2% 49,141,797 4,8970.8%0.8%0.7%BENTON3,71616,19322.7% 20,980,803 5,6470.3%0.3%0.3%BLEDSOE3,04313,14222.9% 13,109,822 4,3080.2%0.3%0.2%BLOUNT17,925121,51114.6% 94,826,635 5,2901.5%1.5%2.0%BRADLEY18,04996,47218.5% 93,794,646 5,1971.4%1.5%1.6%CAMPBELL13,17240,93631.9% 64,127,240 4,8681.0%1.1%0.7%CANNON2,79013,80420.0% 15,777,586 5,6560.2%0.2%0.2%CARROLL6,55528,71922.6% 39,938,968 6,0930.6%0.5%0.5%CARTER11,93259,49219.9% 61,341,859 5,1410.9%1.0%1.0%CHEATHAM5,44839,39613.7% 29,518,588 5,4190.5%0.5%0.6%CHESTER3,40016,30920.6% 17,252,167 5,0750.3%0.3%0.3%CLAIBORNE9,05031,46128.5% 48,450,127 5,3530.7%0.8%0.5%CLAY2,0997,79426.7% 12,063,259 5,7480.2%0.2%0.1%COCKE10,33835,68828.7% 48,640,090 4,7050.7%0.9%0.6%COFFEE10,82352,13420.6% 59,919,581 5,5360.9%0.9%0.8%CROCKETT3,42614,18623.9% 19,782,843 5,7750.3%0.3%0.2%CUMBERLAND10,29053,59019.0% 61,004,024 5,9280.9%0.9%0.9%DAVIDSON110,309626,14417.4% 687,386,043 6,23110.5%9.2%10.1%DECATUR2,69511,28823.6% 17,040,703 6,3240.3%0.2%0.2%DEKALB4,31818,69422.9% 25,068,570 5,8060.4%0.4%0.3%DICKSON8,78847,88418.2% 56,340,655 6,4110.9%0.7%0.8%DYER9,79037,60025.8% 46,836,041 4,7840.7%0.8%0.6%FAYETTE5,82638,17315.1% 26,563,911 4,5590.4%0.5%0.6%FENTRESS6,18717,66734.7% 35,282,219 5,7030.5%0.5%0.3%FRANKLIN6,62141,16515.9% 35,468,143 5,3570.5%0.5%0.7%GIBSON11,83849,25723.8% 81,039,375 6,8461.2%1.0%0.8%GILES5,63129,18419.1% 32,604,952 5,7910.5%0.5%0.5%GRAINGER5,03422,70821.9% 22,487,882 4,4680.3%0.4%0.4%GREENE13,62666,15720.4% 174,977,599 12,8412.7%1.1%1.1%GRUNDY5,22514,22036.4% 26,223,397 5,0190.4%0.4%0.2%HAMBLEN12,65662,13220.2% 65,796,385 5,1991.0%1.1%1.0%HAMILTON54,707332,84816.3% 314,020,603 5,7404.8%4.5%5.4%HANCOCK2,3516,69334.8% 11,638,953 4,9500.2%0.2%0.1%HARDEMAN6,99027,84824.9% 42,275,957 6,0480.6%0.6%0.4%HARDIN6,71626,22725.4% 39,237,117 5,8420.6%0.6%0.4%HAWKINS12,64257,47721.8% 60,165,597 4,7590.9%1.0%0.9%HAYWOOD5,57619,02429.0% 25,983,281 4,6600.4%0.5%0.3%HENDERSON6,22126,91622.9% 30,640,238 4,9250.5%0.5%0.4%HENRY7,23631,77022.6% 35,445,749 4,8980.5%0.6%0.5%HICKMAN5,29323,84122.0% 30,382,511 5,7400.5%0.4%0.4%HOUSTON2,0238,13724.6% 12,929,612 6,3910.2%0.2%0.1%HUMPHREYS3,81718,14920.8% 24,681,950 6,4670.4%0.3%0.3%JACKSON2,69910,84724.6% 16,205,625 6,0050.2%0.2%0.2%JEFFERSON10,38951,07420.1% 53,666,811 5,1660.8%0.9%0.8%County3JOHNSON4,29918,11223.5% 19,282,809 4,4850.3%0.4%0.3%KNOX61,920430,01914.3% 336,016,530 5,4275.1%5.1%6.9%LAKE2,0937,32328.3% 12,013,715 5,7410.2%0.2%0.1%LAUDERDALE7,18726,69226.7% 29,906,993 4,1610.5%0.6%0.4%LAWRENCE8,53940,95420.6% 52,298,721 6,1250.8%0.7%0.7%LEWIS2,95411,56425.3% 16,990,566 5,7510.3%0.2%0.2%10
Enrollmenton 1-Jan-09Estimated 2009Population% of Countyon TenncareTotal ServiceExpenditure1, 2, 3ExpenditurePer Member% CountyExpenditure% CountyEnrollment% CountyPopulationLINCOLN6,30833,11618.9% 36,724,451 5,8220.6%0.5%0.5%LOUDON6,75146,44514.4% 39,431,141 5,8410.6%0.6%0.7%MACON5,49221,83824.9% 30,349,266 5,5260.5%0.5%0.4%MADISON21,28796,37621.9% 120,178,646 5,6461.8%1.8%1.6%MARION6,61528,24723.2% 34,015,636 5,1420.5%0.5%0.5%MARSHALL5,35629,73117.8% 28,753,428 5,3690.4%0.4%0.5%MAURY14,75381,93817.8% 98,511,747 6,6771.5%1.2%1.3%MCMINN10,66952,51120.1% 57,375,150 5,3780.9%0.9%0.8%MCNAIRY7,28325,72428.0% 38,141,005 5,2370.6%0.6%0.4%MEIGS3,04811,79025.6% 12,887,981 4,2280.2%0.3%0.2%MONROE10,02545,64821.7% 48,022,338 4,7900.7%0.8%0.7%MONTGOMERY21,776154,75613.9% 123,841,537 5,6871.9%1.8%2.5%CountyMOORE8376,19513.4% 5,379,301 6,4250.1%0.1%0.1%MORGAN4,64220,40422.5% 23,875,233 5,1440.4%0.4%0.3%OBION6,82231,37521.5% 32,224,794 4,7230.5%0.6%0.5%OVERTON4,86320,97523.0% 27,886,533 5,7340.4%0.4%0.3%PERRY1,5817,75320.2% 10,431,619 6,6000.2%0.1%0.1%PICKETT1,1694,80124.1% 7,684,515 6,5760.1%0.1%0.1%POLK3,84915,67124.3% 16,737,217 4,3490.3%0.3%0.3%PUTNAM13,96271,16019.4% 90,631,188 6,4911.4%1.2%1.1%RHEA7,88230,78125.4% 42,707,686 5,4190.7%0.7%0.5%ROANE10,22953,43019.0% 65,633,073 6,4161.0%0.8%0.9%ROBERTSON10,64664,89816.2% 58,169,618 5,4640.9%0.9%1.0%RUTHERFORD32,038249,27012.7% 178,581,603 5,5742.7%2.7%4.0%SCOTT7,78422,03935.0% 40,795,489 5,2410.6%0.6%0.4%SEQUATCHIE3,21613,58023.4% 16,508,557 5,1340.3%0.3%0.2%SEVIER14,60684,83517.0% 67,362,463 4,6121.0%1.2%1.4%SHELBY230,522906,82525.2% 1,022,436,425 4,43515.7%19.1%14.6%SMITH3,77919,10719.6% 21,325,076 5,6430.3%0.3%0.3%STEWART2,44813,22618.3% 15,379,044 6,2820.2%0.2%0.2%SULLIVAN27,946153,90018.0% 143,226,178 5,1252.2%2.3%2.5%SUMNER21,069155,47413.4% 120,050,991 5,6981.8%1.7%2.5%TIPTON11,69758,70619.7% 51,923,652 4,4390.8%1.0%0.9%TROUSDALE1,6657,82221.1% 9,539,388 5,7280.1%0.1%0.1%UNICOI3,85417,71821.5% 22,936,716 5,9510.4%0.3%0.3%UNION4,60819,00824.0% 21,100,172 4,5790.3%0.4%0.3%VAN BUREN1,3375,48124.2% 8,600,359 6,4320.1%0.1%0.1%WARREN9,60839,84223.9% 57,941,674 6,0310.9%0.8%0.6%WASHINGTON19,021118,63915.9% 115,985,937 6,0981.8%1.6%1.9%WAYNE3,12516,61418.6% 22,505,434 7,2020.3%0.3%0.3%WEAKLEY6,36533,37518.9% 35,926,443 5,6450.6%0.5%0.5%WHITE5,66125,12922.3% 36,823,606 6,5050.6%0.5%0.4%WILLIAMSON7,949171,4524.6% 50,530,769 6,3570.8%0.7%2.8%WILSON12,981109,80311.7% 78,110,974 6,0171.2%1.1%1.8%OTHER8,715 14,010,077 1,6080.2%0.7%0.0%4TOTAL1,204,5206,214,88819.4% 6,527,514,000 5,419100.0%100.0%100.0%1Service Expenditures include medical, pharmacy, LTC, dental, behavioral health services, MCO administrative costs and Part D payments onbehalf of Dual eligible members. Payments on behalf of Dual eligible members for Part D drug coverage totaled 240,199,400. ASO administrationand Part D payments were allocated across counties relative to the county’s proportion of total expenditure.2Service Expenditures do not include Medicare Cost Sharing (except for Part D), Supplemental Payments to Providers, TennCare Administration,DCS funding and GOCCC3This category reflects recipients who are Tennessee residents for which their domicile is temporarily located outside of the state.4Greene County expenditures include costs associated with the Greene Valley Department Center, causing the per-member cost to appear higherwhen comparing it with those of the other counties.11
MilestonesAlways Striving for Quality Careand Operational ExcellenceFederal Court Grants TennCare Relieffrom Long-Standing Court OrderThe state of Tennessee received relief from the U.S. DistrictCourt in January 2009, resolving a long-standing courtorder that will ensure everyone enrolled in the TennCareprogram is actually eligible for the program. The courtgranted the state permission to check the eligibility of147,000 TennCare members, some of whom may nolonger be eligible for the program. They are all membersof a class of enrollees subject to a 21-year old court orderknown as Daniels.“We appreciate thatthe court ruled quicklyand fairly, allowingus to move forward indetermining which ofthese individuals are stilleligible for TennCare,”TennCare DirectorDarin Gordon said. “Byallowing TennCare toremove those individualswho are
Dental HCBS (eldery and disabled) and PACE Programs Gov.’s Office of Children’s Care Coordination . 3Administration includes funding for eligibility determination by DHS in all county offices and outreach in local health department. Medical and Behavioral Services, 46.43% . Amerigroup