Transcription
Tuning PostgreSQL for High Performance and OptimizationPostgreSQL High PerformanceIbrar Ahmed2
Who am I?Software Career Software industries since 1998.PostgreSQL Career Working on PostgreSQL Since 2006. EnterpriseDB (Associate SoftwareArchitect core Database Engine)@ibrar ahmad2006-2009 EnterpriseDB (Software Architect coreDatabase Engine) 2011 - 2016https://www.facebook.com/ibrar.ahmed IBRAR AHMEDSenior Software ArchitectEnterpriseDB (Senior Software Architectcore Database Engine) 2016 – 2018https://www.linkedin.com/in/ibrarahmed74/ Percona (SeniorSoftware Architect corePostgreSQLBooks Percona LLChttps://pgelephant.com/ Database Engine) 2018 – PresentPostgreSQL Developer's GuidePostgreSQL 9.6 High Performance
01Database Performance02PostgreSQL Modules03PostgreSQL Performance Tuning04Linux Kernel Tuning05Parallel Query Optimizations06Questions and Answers
TimelineDatabase Performance5 Minutes10 MinutesPostgreSQL ModulesPostgreSQL Performance Tuning15 Minutes10 MinutesLinux Kernel TuningQParallel Query Optimization5 MinutesQuestion Answers5 MinutesTips5 Minutes
1.Database PerformanceOverall Database System Performance
Database PerformanceHardwareDatabaseChoose better HardwareTune your database (PostgreSQL)ApplicationOperating SystemTune client applicationOperating System Selection and TuningWorkloadChoose Database Depend based on WorkloadSELECT * FROM fooQueryTune your query properly.
2.PostgreSQL ModulesPostgreSQL
PostgreSQL ModulesPostgreSQL MemoryClientsClient - psqlwork memClient - JDBCClient - ODBCShared BuffersDefault 128MBProcessesPostmasterPort 5432CheckpointerPostgresPostgresWAL WriterArchiverBackground WriterLoggerWAL BuffersDefault 16MBKernel Memory4KDisk Management PGDATATable Spacesbase/ Datafilesglobalpg wal/ WAL filesConfiguration Files/dev/sda/dev/sdbmaintancework mem2MB/1GB Huge PagesTHP
3.PostgreSQL Performance TuningPostgreSQL
Tuning Parameters shared buffers wal buffers effective cache size maintenance work mem synchronous commit checkpoint timeout checkpoint completion target temp buffers huge pages
PostgreSQL Tuning / shared buffers PostgreSQL uses its own buffer along with kernel buffered I/O. PostgreSQL does not change the information on disk directly then how? Writes the data to shared buffer cache. The backend process writes that these blocks kernel buffer.postgresql # SHOW shared buffers;shared buffers---------------128MB(1 row)The proper size for the POSTGRESQL shared buffer cache is the largest useful size that does not adversely affect other activity.—Bruce Momjian
PostgreSQL Tuning / max connections Maximum connection for PostgreSQL Default is 100postgres # SELECT pg backend pid();pg backend pid---------------3214(1 row)postgres # SELECT pg backend pid();pg backend pid---------------3590(1 row)postgres # SELECT pg backend pid();pg backend pid---------------3616(1 row)If you want too many connections, try using pooler (pgbouncer)ps aux grep postgres grep idlevagrant3214 0.0 1.2 194060 12948 ?postgres: vagrant postgres [local] idleSs15:090:00vagrant3590 0.0 1.2 193840 12936 ?postgres: vagrant postgres [local] idleSs15:110:00vagrant3616 0.0 1.2 193840 13072 ?postgres: vagrant postgres [local] idleSs15:110:00
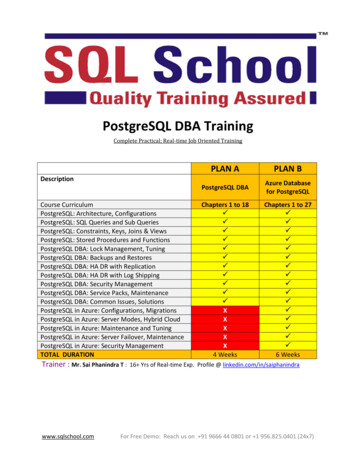
PostgreSQL Tuning / shared buffersshared buffers vs TPSShared buffer vs TPSShared bufferTPS35%128 Megabyte500128 Megabyte3023128 Megabyte68011 Gigabyte128982 Gigabyte309874 Gigabyte545368 Gigabyte5535216 Gigabyte55364
PostgreSQL Tuning / wal buffer Do you have Transaction? Obviously WAL – (Write Ahead LOG) Log your transactions Size of WAL files 16MB with 8K Block size (can be changed at compile time) PostgreSQL writes WAL into the buffers(wal buffer ) and then these buffers are flushed to disk.Bigger value for wal buffer in case of lot of concurrent connection gives better performance.
PostgreSQL Tuning effective cache size This used by the optimizer to estimate the size of the kernel's disk buffer cache. The effective cache size provides an estimate of the memory available for disk caching. It is just a guideline, not the exact allocated memory or cache size.
PostgreSQL Tuning / work mem This configuration is used for complex sorting. It allows PostgreSQL to do larger in-memory sorts. Each value is per session based, that means if you set that value to 10MB and 10 users issue sort queries then 100MB willbe allocated. In case of merge sort, if x number of tables are involved in the sort then x * work mem will be used. It will allocate when required. Line in EXPLAIN ANALYZE “Sort Method: external mergeDisk: 70208kB”
PostgreSQL Tuning / work mempostgres # SET work mem '2MB';postgres # EXPLAIN ANALYZE SELECT * FROM foo ORDER BY id;QUERY --------------------------------------------Gather Merge (cost 848382.53.1917901.57 rows 9166666 width 9) (actual time 5646.575.12567.495 rows 11000000 loops 1)Workers Planned: 2Workers Launched: 2- Sort (cost 847382.51.858840.84 rows 4583333 width 9) (actual time 5568.049.7110.789 rows 3666667 loops 3)Sort Key: idSort Method: external merge Disk: 74304kBWorker 0: Sort Method: external merge Disk: 70208kBWorker 1: Sort Method: external merge Disk: 70208kB- Parallel Seq Scan on foo (cost 0.00.105293.33 rows 4583333 width 9) (actual time 0.018.985.524 rows 3666667 loops 3)Planning Time: 0.055 msExecution Time: 13724.353 ms(11 rows)postgres # SET work mem '1GB';postgres # EXPLAIN ANALYZE SELECT * FROM foo ORDER BY id;QUERY -------------------------------------------Sort (cost 1455965.01.1483465.01 rows 11000000 width 9) (actual time 5346.423.6554.609 rows 11000000 loops 1)Sort Key: idSort Method: quicksort Memory: 916136kB- Seq Scan on foo (cost 0.00.169460.00 rows 11000000 width 9) (actual time 0.011.1794.912 rows 11000000 loops 1)Planning Time: 0.049 msExecution Time: 7756.950 ms(6 rows)Time: 7757.595 ms (00:07.758)
maintenance work mem maintmaintenance work mem is a memory setting used for maintenance tasks. The default value is 64MB. Setting a large value helps in tasks like VACUUM, RESTORE, CREATE INDEX, ADD FOREIGN KEY and ALTER TABLE.
maintenance work mempostgres # CHECKPOINT;postgres # SET maintenance work mem '10MB';postgres # SHOW maintenance work mem;maintenance work mem---------------------10MB(1 row)postgres # CREATE INDEX idx foo ON foo(id);Time: 12374.931 ms (00:12.375)postgres # CHECKPOINT;postgres # SET maintenance work mem '1GB';postgres # SHOW maintenance work mem;maintenance work mem---------------------1GB(1 row)postgres # CREATE INDEX idx foo ON foo(id);Time: 9550.766 ms (00:09.551)
synchronous commit This is used to enforce that commit will wait for WAL to be written on disk before returning a success status to the client. This is a trade-off between performance and reliability. Increasing reliability decreases performance and vice versa.Synchronous commit doesn't introduce the risk of corruption, which is really bad, just some risk of data loss.https://wiki.postgresql.org/wiki/Tuning Your PostgreSQL Server
checkpoint timeout PostgreSQL writes changes into WAL. The checkpoint process flushes the data into the data files. More checkpoints have a negative impact on performance. Frequent checkpoint reduces the recovery time
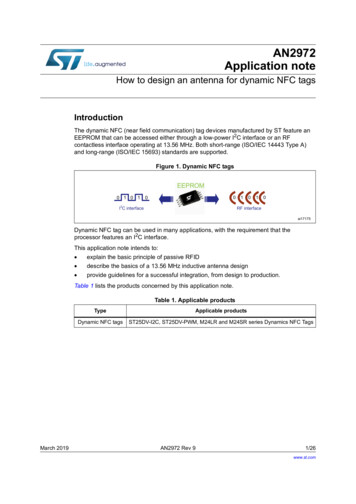
4.Linux Tuning for PostgreSQLUbuntu
Input Output Handling Direct IO, Buffered IO and Double buffering PostgreSQL believes that the Operating system (Kernel) knows much better about storage and IO scheduling. PostgreSQL has its own buffering; and also needs the pages cache. Double Buffering It Increase the use of memory. And different kernel and setting behave differently.
Virtual Memory Every process is given the impression that it is working with large, contiguoussections of memory Each process runs in its own dedicated address space Pages Table are used to translate the virtual addresses seen by the applicationinto Physical Addresshttps://en.wikipedia.org/wiki/Virtual memoryhttps://en.wikipedia.org/wiki/Page table
Translation Lookaside Buffer (TLB) Translation Lookaside Buffer is a memory cache It reduce the time to access a user memory location If a match is found the physical address of the page is returned TLB hit If match not found scan the page table (walk) looking for the address mapping (entry) TLB missSmall page size bigger TLB size expensive
Memory Pages Different OS has different size of Pages Linux has a concept of Classic Huge Pages and Transparent Huge Pages. BSD has Super Pages. Windows has Large Pages.
Linux Page sizes Linux Page size is 4KMany modern processors support other page sizesIf we consider a server with 256G of RAM:egu/hegrlasegpa4K671088642M1310721G256
Classic Huge Pages# cat /proc/meminfoMemTotal:264041660 kB.Hugepagesize:2048 kBDirectMap4k:128116 kBDirectMap2M:3956736 kBDirectMap1G:266338304 kBsysctl -w vm.nr hugepages 256
Classic Huge Pages# vi /etc/default/grubGRUB CMDLINE LINUX DEFAULT "hugepagesz 1GB default hugepagesz 1G”# update-grubGenerating grub configuration file .Found linux image: /boot/vmlinuz-4.4.0-75-genericFound initrd image: /boot/initrd.img-4.4.0-75-genericFound memtest86 image: /memtest86 .elfFound memtest86 image: /memtest86 .binDone# shutdown -r now
Classic Huge Pages# vim /etc/postgresql/10/main/postgresql.confhuge pages ON # default is try# service postgresql restart
Transparent Huge pages The kernel works in the background (khugepaged) trying to: "create" huge pages. Find enough contiguous blocks of memory Convert them into a huge pageTransparently allocate them to processes when there is a "fit"
Disabling Transparent Huge pages# cat /proc/meminfo grep AnonHugeAnonHugePages:2048 kB# ps aux grep hugeroot420.00.000 ?SNJan170:00 [khugepaged]To disable it: at runtime:# echo never /sys/kernel/mm/transparent hugepage/enabled# echo never /sys/kernel/mm/transparent hugepage/defrag at boot time:GRUB CMDLINE LINUX DEFAULT "(.) transparent hugepage never"
vm.swappiness This is another kernel parameter that can affect the performance of the database. Used to control the swappiness (swapping pages to swap memory into RAM) behavior on a Linux system. The parameter can take anything from “0” to “100”. The default value is 60. Higher value means more aggressively swap.sudo sh -c 'echo 1 /proc/sys/vm/swappiness'sudo sh -c 'echo "vm.swappiness 1" /etc/sysctl.conf'
vm.overcommit memory and vm.overcommit ratio Applications acquire memory and free that memory when it is no longer needed. But in some cases, an application acquires too much memory and does not release it. This is used to control the memory over-commit. It has three options 0 - Heuristic overcommits, Do it intelligently (default); based kernel heuristics 1 - Allow overcommit anyway 2 - Don’t over commit beyond the overcommit ratio.sudo sh -c‘echo 2 /proc/sys/vm/overcommit memory’sudo sh -c ‘echo 50 /proc/sys/vm/overcommit ratio’This can invoke the OOM killer.
vm.dirty background ratio and vm.dirty background bytes The vm.dirty background ratio is the percentage of memory filled with dirty pages that need to be flushed to disk. Flushing is done in the background. The value of this parameter ranges from 0 to 100;
vm.dirty ratio / vm.dirty bytes The vm.dirty background ratio is the percentage of memory filled with dirty pages that need to be flushed to disk. Flushing is done in the foreground. The value of this parameter ranges from 0 to 100;
5.Parallel Query OptimizationsParallel Query
Parallel Query How Parallel Query Works? When Can Parallel Query Be Used? When parallel query can be used, and when it can not.Parallel Plans Actual working mechanism of parallel queries.Different parallel plans available.Parallel Safety Parallel query operations are parallel safe, parallel restricted, or parallel -plans.html
How Parallel Query Works - Configuration max worker processes The default is 8Sets the maximum number of background processes that the system can support. This parameter can only be set at server start. max parallel workers per gather (integer) The default value is 2Sets the maximum number of workers that can be started by a single Gather or Gather Merge node. max parallel workers (integer) The default value is 8Sets the maximum number of workers that the system can support for parallel queries. dynamic shared memory type (enum)Parallel query requires dynamic shared memory in order to pass data between cooperating processes, so there should not be set to “none” Posixsysvwindowsmmapparallel workers (integer) Sets the number of workers that should be used to assist a parallel scan of this tablepostgresql.conf is the place where you can set these.Some of the setting can be set on psql useng set command.
How Parallel Query Works - ConfigurationEXPLAIN ANALYZE SELECT COUNT(*) FROM foo;Finalize Aggregate- GatherWorkers Planned: 2Check1 - max worker processes2 - max parallel workersWorkers Launched: 0- Partial Aggregate- Parallel Seq Scan on fooEXPLAIN ANALYZE SELECT COUNT(*) FROM foo;Finalize Aggregate- GatherWorkers Planned: 1Workers Launched: 1- Partial Aggregate- Parallel Seq Scan on fooALTER TABLE foo SET (parallel workers 2);These are quick tips, there may be some other reasons.EXPLAIN ANALYZE SELECT COUNT(*) FROM foo;Finalize Aggregate- GatherWorkers Planned: 1Workers Launched: 1- Partial Aggregate- Parallel Seq Scan on fooCheck1 - max parallel workers per gather2 - parallel workersALTER TABLE foo SET (parallel workers 2);EXPLAIN ANALYZE SELECT COUNT(*) FROM foo;Finalize Aggregate- GatherWorkers Planned: 2Workers Launched: 2- Partial Aggregate- Parallel Seq Scan on foo
How Parallel Query Works - ExampleEXPLAIN SELECT * FROM pgbench accounts WHERE filler LIKE '%x%’;QUERY ather (cost 1000.00.217018.43 rows 1 width 97)Workers Planned: 2- Parallel Seq Scan on pgbench accounts (cost 0.00.216018.33 rows 1 width 97)Filter: (filler '%x%'::text) (4 rows)If the Gather or Gather Merge node is at the very top of the plan tree, then the entire query will execute in parallel,otherwise only the portion of the plan below it will run in parallel
When Can Parallel Query Be Used? Number of backgrounds max worker processes. Background workers for purposes of parallel query max parallel workers. The client sends an execute message with a non-zero fetch count. When a prepared statement is executed using a CREATE TABLE . AS EXECUTE . statement. When the transaction isolation level is serializable*. The query uses any function marked PARALLEL UNSAFE. The query is running inside of another query that is already parallel. The query might be suspended during execution. PL/pgSQL Loops of the form FOR x IN query LOOP . END LOOP DECLARE CURSORThe query writes any data or locks any database rows. If a query contains a data-modifying operation (top level/within aCTE)*.Default value of max worker processes and max parallel workers are 8.* Limitation of current implementation.
When Can Parallel Query Be Used? 2/2 Windowed functions and ordered-set aggregate functions are non-parallel*. Support for FULL OUTER JOIN* This is a limitation of the current implementation.
Parallel Plans Parallel Scans Parallel Sequential Scan Parallel Bitmap Heap Scan Parallel Index Scan Parallel Index Only Scan Parallel Joins Parallel Aggregation Parallel Append
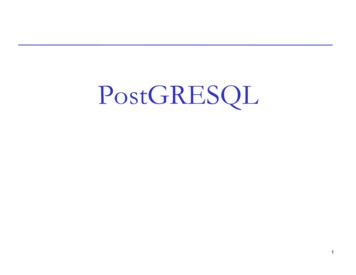
Parallel Sequential ScanCREATE TABLE foo AS SELECT id AS id, 'name’::TEXT id::TEXT AS name FROMgenerate series(1,10000000) AS id;ProcessEXPLAIN ANALYZE SELECT * FROM foo WHERE id %2 10;QUERY ----------------------------------Seq Scan on fooTABLE(cost 0.00.204052.90 rows 49999 width 15)Block0Block1Planning Time: 0.063 msExecution Time: 1657.964 msBlock2Planning timeBlocknEXPLAIN ANALYZE SELECT * FROM foo WHERE id %2 10;QUERY ---------------------------------GatherWorkers Planned: 4Workers Launched: 4- Parallel Seq Scan on foo (cost 0.00.91554.48 rows 12500 width 15)Filter: ((id % 2) 10)Planning Time: 0.074 msExecution Time: 469.946 msLeaderGatherWorker1Worker2Worker3TABLEReduce query executiontime by using machinesmultiple CPUsBlock0Block1Block2BlocknNo benefit if table size is min parallel table scan sizeWorkern
Parallel Bitmap Heap Scan One process is chosen as the leader. Leader performs a scan of one or more indexes andbuilds a bitmap indicating which table blocks need tobe visited. These blocks are then divided among thecooperating processes as in a parallel sequentialscan.There is no benefit if bitmap size is very small.EXPLAIN (COSTS OFF )SELECT COUNT(*) FROM foo JOIN bar ON id v WHERE v 10 AND name 'name%';QUERY ----------Finalize Aggregate- GatherWorkers Planned: 2- Partial Aggregate- Nested Loop- Parallel Bitmap Heap Scan on barRecheck Cond: (v 10)- Bitmap Index Scan on idx1Index Cond: (v 10)- Bitmap Heap Scan on fooRecheck Cond: (id bar.v)Filter: (name 'name%'::text)- Bitmap Index Scan on idxIndex Cond: (id bar.v)
Parallel Index ScanEXPLAIN (costs off) SELECT id FROM foo WHERE val % 100 2 and id 200000;QUERY ---GatherWorkers Planned: 2- Parallel Index Only Scan using idx1 on fooIndex Cond: (id 200000)Filter: ((val % 100) 2)(5 rows) Worker-0 will start from the root nodeand scan until the leaf node 200. 100101102100200300200210220300301302It’ll handover the next block under 580,590,560,560,630,630,630,63.n105 to Worker-1, which is in a blockedand wait-state. Worker - 0If there are other workers, blocks are0divided into the workers12345Worker - 167891011121314151617.
Parallel JoinsParallel Hash JoinIn case of hash join the inner side is executed in full by every cooperating processto build identical copies of the hash table.What if hash table is too big ?In parallel hash join the inner side is a parallel hash that divides the work ofbuilding a shared hash table over the cooperating processes.All workers participate in creating the Hash table.After the hash, each worker can perform the join.Merge JoinThe inner side is always a non-parallel plan and therefore executed in full.This may be inefficient, especially if a sort must be performed, because the workand resulting data are duplicated in every cooperating process.Nested Loop JoinThe inner side is always non-parallel.The outer tuples and thus the loops that look up values in the index are dividedover the cooperating processes.EXPLAIN ANALYZE SELECT COUNT(*)FROM foo JOIN bar ON id v WHERE v 10;QUERY ---------------Finalize Aggregate- GatherWorkers Planned: 2Workers Launched: 2- Partial Aggregate- Parallel Hash JoinHash Cond: (bar.v foo.id)- Parallel Seq Scan on)Filter: (v 10)Rows Removed by Filter: 500058- Parallel Hash- Parallel Seq Scan on fooPlanning Time: 0.211 msExecution Time: 758.847 ms
Parallel Aggregation MasterWorker performs the scans on the pages and applies theFinalize Aggregatefilter. Gather MergeTransfer all the tuples to master.Master performs the final Partial AggregatePartial AggregatePartial AggregatePartial AggregatePartial AggregateSeuential ScanSeuential ScanSeuential ScanSeuential ScanSeuential Scan0EXPLAIN (COSTS FALSE) SELECT sum(id) FROM foo WHERE id%2 10;QUERY Aggregate- Aggregate Node to handleaggregates1234567891010.EXPLAIN (COSTS FALSE) SELECT sum(id) FROM foo WHERE id %2 10;QUERY ----------------Finalize AggregateA new Finalize Aggregate- Gathernode to combine theWorkers Planned: 4results- Partial Aggregate- Parallel Seq Scan on fooFilter: ((id % 2) 10)Seq Scan on fooFilter: (( id % 2) 10)(3 rows)Parallel aggregation is not supported if any aggregate function call contains DISTINCT or ORDER BY clauseA new PartialAggregateproduces transition stateoutputs.n
Parallel Append\d foo;Partitioned table "public.foo"Column Type ------ -------------id integername textPartition key: RANGE (id)Partitions: foo1 FOR VALUES FROM ('-1000000') TO (1),foo2 FOR VALUES FROM (1) TO (1000000) Append node used to combine rows from multiple sources into a single resultset. In Append, all the participating processes cooperate to execute the first childplan until it is complete and then move to the second plan at around the sametime In Parallel Append executor spread out the participating processes to itschild plans, so that multiple child plans are executed simultaneously Avoids CPU contention and enhances I/O parallelism.enable parallel append can be used to disable/enable parallel append.EXPLAIN (costs off)SELECT count(id) FROM foo WHERE id 201;QUERY ----------Finalize Aggregate- GatherUsed to combine rows frommultiple sourcesWorkers Planned: 2- Partial Aggregate- Parallel Append- Parallel Seq Scan on foo1 foo 1Filter: (id 201)- Parallel Seq Scan on foo2 foo 2Filter: (id 201)
Parallel Labeling for Functions and Aggregates 1/2 Parallel safeCREATE FUNCTION add(integer, integer) RETURNS integerAS 'select 1 2;'A parallel safe operation is one which does notLANGUAGE SQL PARALLEL RESTRICTED;conflict with the use of parallel queryCREATE FUNCTION add(integer, integer) RETURNS integer Parallel restrictedA parallel restricted operation is one which cannot beperformed in a parallel worker, but which can beAS 'select 1 2;'LANGUAGE SQL PARALLEL SAFE;\df addperformed in the leader while parallel query is in use Parallel unsafeA parallel unsafe operation is one which cannot beperformed while parallel query is in use, not even inList of functionsSchema Name Parallel --------- ---------- ------------------public add(1 row)the leader.All user-defined functions are assumed to be parallel unsafe unless otherwise marked. safe
Parallel Labeling for Functions and Aggregates 2/2 The following operations are always parallel restricted: Scans of common table expressions (CTEs). Scans of temporary tables. Scans of foreign tables, unless the foreign data wrapper has an IsForeignScanParallelSafe APIwhich indicates otherwise. Plan nodes to which an InitPlan is attached. Plan nodes which reference a correlated SubPlan.
Parallel Index Creation PostgreSQL can build indexes while leveraging multipleCREATE INDEX idx ON foo(id);CPUs in order to process the table rows faster. This featureCREATE INDEXis known as parallel index build.Time: 11815.685 ms (00:11.816)Generally, a cost model automatically determines howmany worker processes should be requested, if any.SET max parallel maintenance workers 8;CREATE INDEX idx ON foo(id);CREATE INDEXTime: 17281.309 ms (00:17.281)Only B-tree parallel build is supported.
Blog Posts Tuning PostgreSQL Database Parameters to Optimize Performance. e/Tune Linux Kernel Parameters For PostgreSQL Optimization -kernel-parameters-for-postgresql-optimization/
Thanks!Any questions?You can find me at: Ibrar.ahmed@percona.comPgelephant.com56
Linux Tuning for PostgreSQL, Ubuntu, Input Output Handling, Direct IO, Buffered IO and Double buffering, PostgreSQL believes that the Operating system (Kernel) knows much better about storage and IO scheduling. PostgreSQL has its own buffering; and also needs the pages cache. Double Buffering, It Increase the use of memory.