Transcription
Blame the SkilledTobias Gerstenberg (t.gerstenberg@ucl.ac.uk)1, Anastasia Ejova (anastasia.ejova@adelaide.edu.au)2,David A. Lagnado (d.lagnado@ucl.ac.uk) 112Department of Cognitive, Perceptual, and Brain SciencesSchool of Psychology, University of Adelaide, AustraliaUniversity College London, United KingdomAbstractThis study investigates the influence of players’ performanceand level of skill on responsibility attributions in groups.Participants act as external judges and evaluate theperformance of teams of differently skilled players whocompete in a darts game. The results show that bothperformance and skill influence responsibility attributions.Poor performance elicits high blame and low credit ratingsand vice versa for good performance. Responsibilityattributions to one player did not vary as a function of theother player’s performance. The influence of skill onresponsibility attributions was asymmetric. While skilledplayers were blamed more for losses than unskilled players,credit ratings did not vary significantly as a function of skill.This result is in line with people’s strong tendency tospontaneously consider upwards counterfactual alternativesfor losses over downwards counterfactuals for wins.Keywords: responsibility attribution; counterfactual thinking;control; skill.IntroductionConsider you witness the following situation on a night outin a pub. Three friends are playing darts and, to spice thingsup, one of them offers the other two the following deal:“Both of you throw at the same time. If one of you managesto hit the dart in the center region, the next round of drinkswill be on me. However, if none of you hits the center,you’ll have to pay for my next pint.”You have seen from their previous play that one of theplayers is very skilled. In fact, she managed to hit the centerregion most of the time. The other player’s performance, incontrast, was quite poor. He hardly ever managed to get thedart in the center. How would you spread the blame ifneither of them managed to hit the center? Whom wouldyou credit more if both of them hit the center? This paperinvestigates how people attribute responsibility betweenmultiple agents based on their underlying skill level andactual performance.Skill, Expectation and ControlThe problem of how credit for a positive outcome or blamefor a negative outcome should be distributed across themembers of a group is encountered in many contexts – fromlaw, business and medicine, to heated dinner table debatesabout team sports. Skill and performance are importantvariables that potentially differentiate the individual agentscontributing to a joint effort and are hence likely toinfluence credit and blame attributions. How skilled wethink a person is has a direct influence on what performancewe expect from her. Furthermore, skill is closely connectedto the notion of control. If a person is skilled it implies sheis able to do something well in a reliable fashion. However,as the well-known phenomenon of choking in sportsdemonstrates, a player might fail to deliver because hestruggles with the external pressure imposed by highexpectations. Hence, high skill does not necessarily implygood performance. Similarly, a low skilled person cansometimes surprise with a very good performance. How doconsiderations about skill and performance influencepeople’s attributions of blame or credit and what cognitiveprocesses are likely to guide responsibility attributions inthese contexts?Achievement Motivation: Ability and EffortA rich literature in attribution research has been concernedwith analyzing the causal factors that are perceived toinfluence an agent’s success or failure in achievementrelated contexts (see e.g. Weiner, 1995). In one of the veryfirst studies, Weiner and Kukla (1970, Experiment 1)presented scenarios in which they systematically varied theability and effort of hypothetical students paired withdifferent performance outcomes. For example, a studentcould be described as having low ability, expended higheffort and achieved an excellent grade in their exam. Basedon this information, participants were asked to assignreward or punishment to the students. Whether studentsreceived punishment or reward was directly related to theoutcome of their exam whereby participants showed atendency to reward more than punish. Additionally,participants’ responses were significantly influenced byboth ability and effort. Students who expended high effortwere rewarded more and punished less than students whoexpended low effort. Furthermore, students with high abilityreceived more punishment and less reward compared tostudents with low ability. Interestingly, whereas both ableand non-able students received the same reward for the bestpossible outcome (an excellent exam), able studentsreceived more punishment than non-able students for theworst possible outcome (a clear failure in the exam).Overall, however, reward and punishment were morestrongly influenced by differences in the expended effortthan ability of the students.In order to explain this difference, controllability has beenidentified as an important factor that dissociates effort fromability (Weiner, 1995). In Alicke’s (2000) model of personalcontrol, a useful distinction is drawn between behaviorcontrol and outcome control. Whereas how much effort weexpend is a behavior we have control over, we cannotbehaviorally control our ability at a given moment. Howmuch causal control a person has over an outcome,however, depends to a large extent on the person’s ability
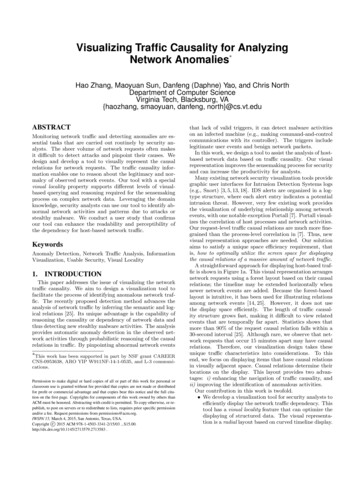
(as well as her effort). As mentioned above, a person’soutcome control increases with her skill. In this paper wewill primarily be interested in the effects that perceivedoutcome control has on a person’s responsibility. Thedegree to which a person possesses outcome control notonly depends on her capacities but also on counterfactualconsiderations about whether the outcome would have beendifferent had she acted differently (Wells & Gavanski,1989).Counterfactual Thinking and Causal InferenceCounterfactual thoughts are thoughts about alternativeevents in the past and the hypothetical future outcomes theywould have resulted in. For example, if a student failed theirexam she might think about what she could have donedifferently (e.g. study instead of going to the beach) so thatshe would have passed the exam. Counterfactual thoughtscan be distinguished by their directionality of contrast.Upward counterfactuals are comparisons of the actual worldwith a somewhat better world and downwardcounterfactuals involve the supposition of a worse world.Several studies have shown that people are more likely tospontaneously engage in upward counterfactual thinking(e.g. Sanna & Turley, 1996). Downward counterfactuals, incontrast, are endorsed comparatively rarely. Accordingly, anoutcome’s valence – or, more specifically, the affective statemotivated by the valence – is one of the main determinantsfor the activation of the counterfactual thinking process(Roese, 1997). Apart from an outcome’s valence, the degreeto which the outcome was to be expected has been identifiedas a promoter for spontaneous causal (Kanazawa, 1992) andcounterfactual thoughts (Kahneman & Miller, 1986; Sanna& Turley, 1996). The less an outcome was expected themore likely were people to engage in causal orcounterfactual thinking.Counterfactuals and ResponsibilitySeveral researchers have argued for the close relationshipbetween counterfactuals, causation and responsibilityattribution (Hilton & Slugoski, 1986; Shaver, 1985). In law,the but for rule is a standard criterion for identifying aperson’s action as the cause-in-fact, which is a preconditionfor the person to be held responsible for the negative event.Accordingly, a person can only be held liable if the negativeevent would not have come about but for his action. Wellsand Gavanski (1989) have demonstrated that counterfactualalternatives indeed influence people’s ratings of causality. Aperson was rated more causal for a negative outcome, if theoutcome could have been prevented had he acteddifferently, compared to a situation in which the outcomewould have occurred even if he had acted differently.In situations in which there are multiple people involved,a person’s control over the outcome is not exclusivelydetermined by their own skill but also by the other people’sabilities as well as the way in which the individualcontributions are combined to determine the outcome.Gerstenberg and Lagnado (2010) have shown that the sameperformance can be evaluated differently depending on thegroup task and the performance of the other players. Theirpaper provided the first empirical test of a structural modelof responsibility attribution developed by Chockler andHalpern (2004). At the core of this model is a relaxed notionof counterfactual dependence, according to which an eventcan still be identified as a cause even if changing it wouldnot have made a difference to the outcome in the actualsituation. In their model, an individual agent’s responsibilityfor a group’s outcome equals 1/(N 1), whereby N denotesthe minimal number of changes from the actual situationthat would have been necessary to generate a situation inwhich that agent’s contribution would have made adifference to the outcome. If no change is needed, the agentreceives a responsibility of 1. The more changes would havebeen necessary to make a person’s contribution critical, themore her responsibility decreases.Consider, for example, our initial darts scenario. In orderfor the two friends to win the bet, at least one of them needsto hit the center region. In a situation in which both playershit the center, their win is overdetermined. That is, theoutcome does not depend on either of the players’ individualaction and hence, a simple but for counterfactual analysiswould not identify either of them as a cause for the positiveoutcome. Each player’s contribution would only have madea difference to the outcome, if the other player had not hitthe center. Expressed in terms of the structural model ofresponsibility attribution each person required one changefrom the actual situation to be critical and should hencereceive a responsibility of 1/2. Thus, the model predicts thata player’s credit should be reduced if the other player hit thecenter as well.ExperimentIn order to assess how people attribute blame and credit in agroup setting as a function of the players’ underlying skilland actual performance, we used the context of a gameshow environment in which players participated in a teamchallenge whose outcome affected their individual payoff.The game was similar to an ordinary darts game (see Figure1). It consisted of two phases: First, there was a practicephase in which each player was given 20 practice shots.Second, there was the crucial team challenge in which twoplayers were put together randomly to form a team. Theteam won their challenge if at least one of the two playersmanaged to hit the dart in the center region. Participantswere told that the players differed in terms of how skilledthey were in the task. The practice shot patterns were usedto manipulate the players’ skill levels (see Materials).The participant’s task was to indicate to what extent eachplayer was responsible for the team’s result. Participantsattributed blame to each player if the team lost and credit ifit won. They were informed that their ratings would affectthe player’s payoff. The more blame a player received forthe team’s loss, the more his payoff was reduced. The morecredit a player received for her team’s win, the more herpayoff was increased.
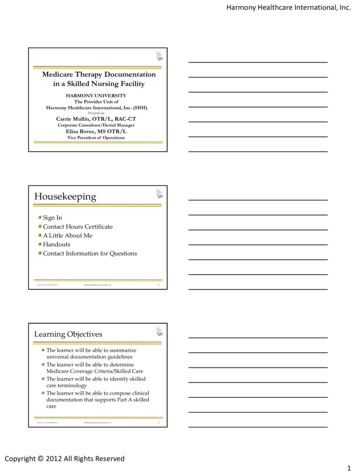
outcome was overdetermined. Hence, a player shouldreceive less credit if the other player also hit the center ascompared to situations in which the other player missed.MethodFigure 1. Screenshot of the game. Each player’sperformance in the practice is shown in the bottomcorners. The performance in the crucial team challengeis shown in the center.We hypothesized that both a player’s perceived outcomecontrol as well as the actual performance would influenceparticipants’ responsibility attributions. The control factor,as manipulated through the player’s skill level, directlyinfluences the availability of counterfactual alternatives(Girotto, Legrenzi & Rizzo 1991). If a skilled player missedthe center region, the alternative event in which she did hitthe center is highly available. Likewise, if an unskilledplayer hits the center, the alternative event in which hemisses is readily available.Given the prevalence of spontaneous upwards rather thandownwards counterfactuals, we expected the influence ofcounterfactual alternatives to be stronger in the case ofoutcomes with negative valence. Accordingly, the skilledplayer would be blamed more for a loss than the unskilledplayer. Since downward counterfactual thinking has rarelybeen shown to occur spontaneously, we expected only asmall influence of the skill factor for outcomes with positivevalence.Furthermore, we expected that participants’ blame andcredit ratings would vary as a function of actualperformance. Despite the fact that the rule of the gameemploys a clear cut-off point in that it only matters whethera player hits the center region or not, we expected thatblame ratings for losses would increase with an increaseddistance of a shot from the center. For wins we expectedthat players would receive most credit if they hit the center.Furthermore, we expected that players would receive onlyminimal credit if they did not hit the center and that creditratings would be higher the closer they were to the center.Finally, taking the considerations of the structural modelof responsibility attribution into account, we expected that aplayer’s responsibility rating would vary as a function of theother player’s performance. More specifically, we expecteda player’s credit rating to be reduced for cases in which theParticipants 52 participants (31 female) were recruitedthrough the UCL subject pool and took part to receivecourse credit points or for the chance of winning Amazonvouchers worth 60 in total. The mean age was 23.9 (SD 6.3).Design The experiment employed a 3 (skill levels: bothplayers unskilled, both player skilled, one player skilled andone player unskilled) x 9 (performance patterns: fullpermutation of 32 possible shots (center, medium, outsideregion) for pairs of players) within-subjects design (seeFigure 3). Given that the team wins if at least one of theplayers hits the center region, this design resulted in 15cases in which a team won and 12 cases in which they lost.Materials Figure 2 shows an example for the practice shotpattern of the unskilled player and the skilled player. Aprototype was generated for each skill level by sampling 20data points from two centered independent Gaussian normaldistributions for the x-axis and y-axis. The skill wasmanipulated by varying the variance of the distribution. Forthe unskilled player pattern, 6 shots hit the center, 8 shotsthe middle, and 6 shots the outside region. For the skilledplayer, 15 shots hit the center, 4 shots the middle and 1 shotthe outside region. Hence, based on the practice pattern, theunskilled player had a 30% chance and the skilled playerhad a 75% chance of hitting the center. From theprototypical skill patterns, we generated 27 patterns each byindependently rotating the individual shots around thecenter. This procedure ensured that the practice patterns ofdifferent players with the same skill level were matchedwith respect to the most important characteristics. Thesummed distance of the shots to the center as well as thenumber of shots in the different regions was held constant.Nevertheless, the practice patterns still looked differentbetween the players. The patterns of shots for the crucialteam challenge were created in a similar fashion. Oneprototypical center, middle and outside ring shot wascreated and randomly rotated for each pattern in theexperiment. Hence, the actual distance of a center, middle orunskilled playerskilled playerFigure 2. Prototypical practice shot patterns for theunskilled and skilled player.
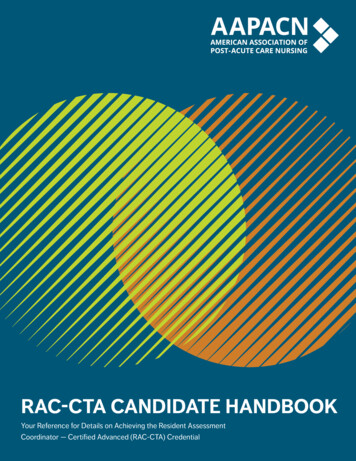
Figure 3. Mean credit and blame attributions ( SE)for the 27 patterns used in the experiment. White bars unskilled player, black bars skilled player; c shot in the center region, m middle region, o outside region.outside shot was identical in each of the combinations.Procedure The study was carried out online.1 At thebeginning of the experiment, participants were instructedthat they would take the role of a judge in a game show andthat their task will be to evaluate players’ performances. Thenature of the practice trials and the rules for the teamchallenge were described as explained above. Participantswere told that the players in the game show differed withrespect to how skilled they were. As a manipulation check,we showed them 3 patterns of practice shots after initialinstructions and asked them to indicate how skillful each ofthe players was in the task. Participants used a slider foreach skill pattern ranging from -10 (very unskilled) to 10(very skilled). The mean ratings for the unskilled playerwere M -3.1 (SD 3.2), for the medium skilled player M 1.4 (SD 2.5) and for the skilled player M 6.1 (SD 3).In the main part of the experiment, only the patterns of theunskilled and skilled player were used.After the skill manipulation check, participants did onepractice trial in which the different components of thescreen were explained. By clicking on an ‘Info’ buttonwhich remained on the screen throughout the experiment,participants could always remind themselves of the mostimportant aspects of the task. After the practice trial,participants answered a series of 4 forced choicecomprehension check questions. On average, participantsanswered 75% of the questions correctly. After having givenan answer, the correct solution was displayed. Participantsthen proceeded to the main stage of the experiment, inwhich they evaluated the performance of 27 teams ofdifferent players. They always saw each player’sperformance in the practice trials first and then the result inthe team challenge was revealed. If one of the two players1A demo of the experiment can be accessed lhit the center region, the team won the challenge, otherwisethey lost. Participants were informed about the result of thechallenge at the top of the screen. To identify the differentplayers, their shots were colored differently. If the team wonthe challenge, participants attributed credit to each player. Ifthe team lost the challenge, participants attributed blame.The sliders ranged from 0 (‘none) to 10 (‘high’).At the end of the experiment, participants saw the practicepatterns and shots in the team challenge for 4 individualplayers sequentially. Two players were skilled and twoplayers were unskilled. For each of the skill levels, one ofthe players hit the center and one of the players hit theoutside ring. For each of the 4 patterns, participants wereasked to indicate how much the following factors influencedthe player’s result on the final test shot. The factors were:‘The player’s skill level’, ‘The player’s effort’, ‘Thepressure of the situation’, ‘Chance’ and ‘The intention toperform this shot’. Participants made their ratings onseparate sliders ranging from 0 (‘not at all’) to 10 (‘verymuch’). This final stage was used to gain insight into howparticipants might explain the different results based on thefactors provided. Finally, participants were asked to providetheir age and gender.ResultsFor all statistical tests, we have adopted a significancecriterion of p .05. Blame ratings for losses and creditratings for wins were analyzed separately.Figure 3 shows the mean credit and blame attributions forthe 27 different patterns used in the main stage of theexperiment. The first row shows situations in which bothplayers were unskilled, the second row in which they wereboth skilled and the third row shows the results for themixed challenges. We analyze, in turn, the effects of actualperformance and underlying level of skill on responsibilityattributions.
Figure 4. Individual differences in the effect of skill onblame/credit attributions. Positive values skilled playeris favored, negative values unskilled player is favored.The Influence of Performance First, we wanted to seewhether blame and credit ratings varied as a function ofperformance. Indeed, credit ratings were significantlyinfluenced by performance, F(1,51) 428.18, η .894.Players received most credit if they hit the center region (M 8.77, SD 1.39). Furthermore, credit ratings for playerthat did not hit the center (M 2.09, SD 1.81) weresignificantly greater than 0, t(51) 8.32. Players receivedsignificantly more credit if they hit the middle ring (M 2.58, SD 2.04) compared to the outside ring (M 1.59, SD 1.75), t(51) 6.07. Similarly, blame ratings wereinfluenced by the performance of the player as well. Aplayer received more blame if she hit the outside (M 6.53,SD 2.23) compared to the middle ring (M 5.55, SD 2.16), t(51) -4.94.To test how a player was evaluated depending on theperformance of the other player, we compared how muchcredit a player received for a shot in the center region if theother player also hit the center or not. A player’s credit for acenter shot if the other player also hit the center (M 8.75,SD 1.67) was not significantly different from situations inwhich the other player did not hit the center (M 8.77, SD 1.34).The Influence of Skill Second, we wanted to see whetherthe blame and credit ratings differed as a function of theplayer’s skill levels. Overall, the skilled players receivedmore blame for the team’s loss (M 6.4, SD 2.23) thanthe unskilled players (M 5.69, SD 2.29), t(51) -2.87.However, there was no significant difference between thecredit ratings for skilled players (M 6.13, SD 1.07) andunskilled players (M 6.05, SD 0.98), t(51) -0.88.To look more closely at the effect that the skill level hadon people’s attributions, we compared the situations inwhich both player’s performance was identical but theirskill differed. Table 1 shows that the proportions ofparticipants that either gave equal ratings to both players inthese cases or favored one player over the other differedsignificantly, χ2(4, N 52) 16.83. The majority ofparticipants attributed credit equally when both players hitthe center. However, in situations in which the team lost andboth players either hit the middle or the outside ring, aFigure 5. Mean ratings ( SE)indicating how muchdifferent factors were seen as having contributed to ashot. ns non-skilled, s skilled, c center, o outside.majority of participants assigned more blame to the skilledcompared to the unskilled player.Figure 4 shows the effect of the skill manipulation foreach individual participant: Shown are the mean differencesin blame and credit attributions between skilled andunskilled players. Positive differences mean that aparticipant attributed more blame/credit to the higher skilledplayer. For losses, 29 participants attributed more blame tothe skilled player, 19 participants less and 4 participantsgave equal blame. For wins, 17 participants attributed morecredit to the skilled player, 24 participants less and 11participants gave equal credit. Participants’ blame and creditattributions were negatively correlated as a function of skill,r -.34. Hence, the more blame a participant attributed to askilled player compared to an unskilled player, the more shecredited the unskilled player compared to the skilled player.Figure 5 shows to what extent participants perceiveddifferent factors to be important in explaining the players’results for the 4 test cases at the end of the experiment. Wewill only discuss the results descriptively. Participantsconsidered the ‘Skill’ factor to be most important forexplaining the shot in the center by the skilled player.‘Effort’, ‘Pressure’ and ‘Intention’ varied as a function ofperformance. For good performances, participants assumedthat the player put in high effort, resisted the pressure of thesituation and intended to bring about the outcome. Thereverse pattern was found for bad performances. The‘Chance’ factor varied as a function of expectation. Themean rating for the skilled person hitting the center waslowest and the rating for the unskilled person hitting thecenter highest.Table 1. Proportions of participants that either gaveidentical ratings in mixed-skill challenges with identicalperformance, favored the unskilled or skilled 9912skilled92622
DiscussionThe results revealed that the quality of performanceinfluenced both blame ratings for losses and credit ratingsfor wins. The worse a person performed the more blame hereceived for the loss and the less credit for a win. Playersreceived marginal credit for the team’s win even if they didnot hit the center region. How a player’s performance wasevaluated did not vary as a function of the teammate’sperformance. The influence of skill on responsibilityattributions was asymmetric. Skilled players received moreblame than unskilled players for losses but creditattributions for wins did not differ significantly as a functionof skill.General DiscussionIn a novel paradigm in which we systematically varied theskill and performance of agents in a group task, we foundthat both factors significantly influenced participants’responsibility attributions.While the finding that responsibility attributions vary as afunction of performance is quite intuitive, the fact thatattributions to an individual were not affected by theirteammate’s performance is surprising. In a different task,Gerstenberg and Lagnado (2010) did find that participantswere sensitive to the performance of the other players andthe way in which individual contributions translated into thegroup’s outcome. One important difference between the twostudies concerns the reward function. While in Gerstenbergand Lagnado (2010) the team was rewarded as a whole,participants in the current study were instructed that theirblame and credit ratings would affect the payoff ofindividual players directly. This instruction might havemade participants consider the players independently andhence no reduction of credit was observed if both playersperformed well.Another interesting finding concerns the asymmetriceffect of the skill manipulation on participants’responsibility ratings. This partly replicates Weiner andKukla’s (1970) finding that reward did not vary as afunction of ability (at least for very good outcomes) butpunishment did. It is also in line with previous research inthe counterfactual literature that showed that counterfactualthoughts are more likely to be spontaneously elicited foroutcomes with negative as opposed to positive valence. Thefact that the counterfactual alternative in which the skilledplayer, who exerts more control over the outcome, hit thecenter region is more easily available explains the increasedblame ratings in these situations. If violations of expectationwere the main driving force of attributions independent ofthe valence of the outcome, one would have also expectedan increased credit rating for the unskilled player. However,our asymmetric results rule out this explanation.It is likely that the influence of the skill manipulationwould have been even stronger if we had chosen a samplethat was representative of the player’s skill levels for thepatterns of shots in the team challenges. The fact that skilllevel in the practice and level of performance in the teamchallenges were independent due to our balancedexperimental design, might have led some participants todisregard the skill manipulation.One of the features of our paradigm is that the effect ofdifferent combination functions on people’s responsibilityattributions can be investigated. In our setup, only one of theplayers needed to perform well in order for the team to win.However, a situation in which both players’ goodperformance is needed is more likely to make participantsview the players as a team and hence stronger effects of oneplayer’s skill and performance on the other player’sevaluation are to be expected.AcknowledgementsTG is the beneficiary of a doctoral grant from the AXAresearch fund. AE was supported by an APA scholarship,DL was supported by ESRC grant (RES-062-33-0004).ReferencesAlicke, M. D. (2000). Culpable control and the psychologyof blame. Psychological Bulletin, 126 (4), 556-574.Chockler, H., & Halpern, J. Y. (2004). Responsibility andblame: A structural-model approach. Journal ofArtificial Intelligence Research, 22, 93–115.Gerstenberg, T. & Lagnado, D. A. (2010). Spreading theblame: The attribution of responsibility amongstmultiple agents. Cognition, 115, 166-171.Girotto, V., Legrenzi, P., & Rizzo, A. (1991). Eventcontrollability in counterfactual thinking. ActaPsychologica, 78, 111-133.Hilton, D. J., & Slugoski, B. R. (1986). Knowledge-basedcausal attribution: The abnormal conditions focus model.Psychological Review, 93 (1), 75-88.Kahneman, D., & Miller, D. T. (1986). Norm theory:Comparing reality to its alternatives. PsychologicalReview, 93 (2), 136-153.Kanazawa, S. (1992). Outcome or expectancy? Antecedentof spontaneous causal attribution. Personality and SocialPsychology Bulletin, 18 (6), 659-668.Roese, N. J. (1997). Counterfactual thinking. PsychologicalBulletin, 121 (1), 133-148.Sanna, L. J., & Turley, K. J. (1996). Antecedents tospontaneous counterfactual thinking: Effects ofexpectancy violation and outcome valence. Personalityand Social Psychology Bulletin, 22, 906-919.Shaver, K. G. (1985). The Attribution of Blame: Causality,Responsibility and Blameworthiness. New York:Springer-Verlag.Weiner, B. (1995). An attributional theory of achievementmotivation and emotion. Psychological Review, 92 (4),548-573.Wei
alternatives indeed influence people's ratings of causality. A person was rated more causal for a negative outcome, if the outcome could have been prevented had he acted differently, compared to a situation in which the outcome would have occurred even if he had acted differently. In situations in which there are multiple people involved,