Transcription
Applied CalculusMath 215Karl Heinz DovermannProfessor of MathematicsUniversity of HawaiiJuly 5, 1999
c Copyright 1999 by the author. All rights reserved. No part of thispublication may be reproduced, stored in a retrieval system, or transmitted, in any form or by any means, electronic, mechanical, photocopying,recording, or otherwise, without the prior written permission of the author.Printed in the United States of America.This publication was typeset using AMS-TEX, the American Mathematical Society’s TEX macro system, and LATEX 2ε . The graphics were producedwith the help of Mathematica1 .This book is dedicated to my wife Emily (Eun Hee) and my sons Christopher and Alexander.This is a draft which will undergo further changes.1Mathematica Version 2.2, Wolfram Research, Inc., Champaign, Illinois (1993).
ContentsPrefaceiii0 A Preview11 Some Background Material1.1 Lines . . . . . . . . . . . . . . . . . . . . . .1.2 Parabolas and Higher Degree Polynomials .1.3 The Exponential and Logarithm Functions .1.4 Use of Graphing Utilities . . . . . . . . . .2 finition of the Derivative . . . . . . . . .Differentiability as a Local Property . . . .Derivatives of some Basic Functions . . . .Slopes of Secant Lines and Rates of ChangeUpper and Lower Parabolas . . . . . . . . .Other Notations for the Derivative . . . . .Exponential Growth and Decay . . . . . . .More Exponential Growth and Decay . . .Differentiability Implies Continuity . . . . .Being Close Versus Looking Like a Line . .Rules of Differentiation . . . . . . . . . . .2.11.1 Linearity of the Derivative . . . . . .2.11.2 Product and Quotient Rules . . . . .2.11.3 Chain Rule . . . . . . . . . . . . . .2.11.4 Derivatives of Inverse Functions . . .2.12 Implicit Differentiation . . . . . . . . . . . .2.13 Related Rates . . . . . . . . . . . . . . . . .2.14 Numerical Methods . . . . . . . . . . . . . 5118
2.14.1 Approximation by Differentials2.14.2 Newton’s Method . . . . . . . .2.14.3 Euler’s Method . . . . . . . . .2.15 Summary . . . . . . . . . . . . . . . .3 Applications of the Derivative3.1 Differentiability on Closed Intervals . .3.2 Cauchy’s Mean Value Theorem . . . .3.3 The First Derivative and Monotonicity3.4 The Second and Higher Derivatives . .3.5 The Second Derivative and Concavity3.6 Local Extrema and Inflection Points .3.7 The First Derivative Test . . . . . . .3.8 The Second Derivative Test . . . . . .3.9 Extrema of Functions . . . . . . . . .3.10 Detection of Inflection Points . . . . .3.11 Optimization Problems . . . . . . . . .3.12 Sketching Graphs . . . . . . . . . . . .118120125134.137. 138. 138. 144. 154. 156. 164. 166. 171. 173. 183. 187. 1984 Integration4.1 Upper and Lower Sums . . . . . . . . . . .4.2 Integrability and Areas . . . . . . . . . . . .4.3 Some elementary observations . . . . . . . .4.4 Integrable Functions . . . . . . . . . . . . .4.5 Anti-derivatives . . . . . . . . . . . . . . . .4.6 The Fundamental Theorem of Calculus . . .4.7 Substitution . . . . . . . . . . . . . . . . . .4.8 Areas between Graphs . . . . . . . . . . . .4.9 Numerical Integration . . . . . . . . . . . .4.10 Applications of the Integral . . . . . . . . .4.11 The Exponential and Logarithm Functions .203. 207. 213. 218. 223. 224. 226. 234. 242. 244. 251. 2555 Prerequisites from Precalculus5.1 The Real Numbers . . . . . . . . .5.2 Inequalities and Absolute Value . .5.3 Functions, Definition and Notation5.4 Graphing Equations . . . . . . . .5.5 Trigonometric Functions . . . . . .5.6 Inverse Functions . . . . . . . . . .5.7 New Functions From Old Ones . .ii.263263266268274276286292
PrefaceThese notes are written for a one-semester calculus course which meets threetimes a week and is, preferably, supported by a computer lab. The courseis designed for life science majors who have a precalculus back ground, andwhose primary interest lies in the applications of calculus. We try to focuson those topics which are of greatest importance to them and use life scienceexamples to illustrate them. At the same time, we try of stay mathematically coherent without becoming technical. To make this feasible, we arewilling to sacrifice generality. There is less of an emphasis on by hand calculations. Instead, more complex and demanding problems find their placein a computer lab. In this sense, we are trying to adopt several ideas fromcalculus reform. Among them is a more visual and less analytic approach.We typically explore new ideas in examples before we give formal definitions.In one more way we depart radically from the traditional approach tocalculus. We introduce differentiability as a local property without usinglimits. The philosophy behind this idea is that limits are the a big stumbling block for most students who see calculus for the first time, and theytake up a substantial part of the first semester. Though mathematicallyrigorous, our approach to the derivative makes no use of limits, allowingthe students to get quickly and without unresolved problems to this concept. It is true that our definition is more restrictive than the ordinary one,and fewer functions are differentiable in this manuscript than in a standardtext. But the functions which we do not recognize as being differentiableare not particularly important for students who will take only one semesterof calculus. In addition, in our opinion the underlying geometric idea of thederivative is at least as clear in our approach as it is in the one using limits.More technically speaking, instead of the traditional notion of differentiability, we use a notion modeled on a Lipschitz condition. Instead of an -δ definition we use an explicit local (or global) estimate. For a function tobe differentiable at a point x0 one requires that the difference between theiii
function and the tangent line satisfies a Lipschitz condition2 of order 2 inx x0 for all x in an open interval around x0 , instead of assuming that thisdifference is o(x x0 ).This approach, which should be to easy to follow for anyone with a background in analysis, has been used previously in teaching calculus. The author learned about it when he was teaching assistant (Übungsgruppenleiter)for a course taught by Dr. Bernd Schmidt in Bonn about 20 years ago.There this approach was taken for the same reason, to find a less technicaland efficient approach to the derivative. Dr. Schmidt followed suggestionswhich were promoted and carried out by Professor H. Karcher as innovationsfor a reformed high school as well as undergraduate curriculum. ProfessorKarcher had learned calculus this way from his teacher, Heinz Schwarze.There are German language college level textbooks by Kütting and Möllerand a high school level book by Müller which use this approach.Calculus was developed by Sir Isaac Newton (1642–1727) and GottfriedWilhelm Leibnitz (1646–1716) in the 17th century. The emphasis was ondifferentiation and integration, and these techniques were developed in thequest for solving real life problems. Among the great achievements are theexplanation of Kepler’s laws, the development of classical mechanics, andthe solutions of many important differential equations. Though very successful, the treatment of calculus in those days is not rigorous by nowadaysmathematical standards.In the 19th century a revolution took place in the development of calculus, foremost through the work of Augustin-Louis Cauchy (1789–1857) andKarl Weierstrass (1815–1897), when the modern idea of a function was introduced and the definitions of limits and continuous functions were developed.This elevated calculus to a mature, well rounded, mathematically satisfyingtheory. This also made calculus much more demanding. A considerable,mathematically challenging setup is required (limits) before one comes tothe central ideas of differentiation and integration.A second revolution took place in the first half of the 20th century withthe introduction of generalized functions (distributions). This was stimulated by the development of quantum mechanics in the 1920ies and found isfinal mathematical form in the work of Laurent Schwartz in the 1950ies.What are we really interested in? We want to introduce the conceptsof differentiation and integration. The functions to which we like to applythese techniques are those of the first period. In this sense, we do not2see page 42 of: A. Zygmund, Trigonometric Series, Vol I, Cambridge University Press,1959, reprinted with corrections and some additions 1968.iv
vneed the powerful machine developed in the 19th century. Still, we like tobe mathematically rigorous because this is the way mathematics is donenowadays. This is possible through the use of the slightly restrictive notionof differentiability which avoids the abstraction and the delicate, technicallydemanding notions of the second period.To support the student’s learning we rely extensively on examples andgraphics. Often times we accept computer generated graphics without having developed the background to deduce their correctness from mathematicalprinciples.Calculus was developed together with its applications. Sometimes theapplications were ahead, and sometimes the mathematical theory was. Weincorporate applications for the purpose of illustrating the theory and tomotivate it. But then we cannot assume that the students know alreadythe subjects in which calculus is applied, and it is also not our goal to teachthem. For this reason the application have to be rather easy or simplified.
viPREFACE
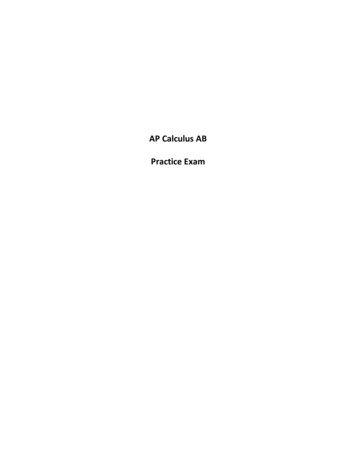
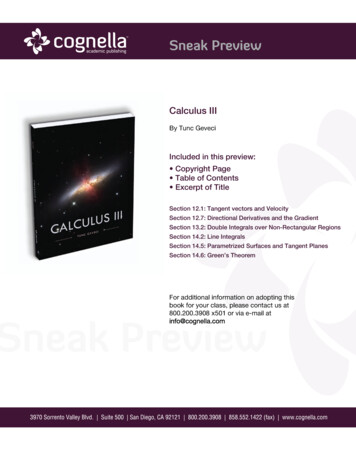
Chapter 0A PreviewIn this introductory course about calculus you will learn about two principalconcepts, differentiation and integration. We would like to explain them inan intuitive manner using examples. In Figure 1 you see the graph of afunction. Suppose it represents a function which describes the size of aP(t)20015010050123456tFigure 1: Yeast population as a function of timepopulation of live yeast bacteria in a bun of pizza dough. Abbreviating1
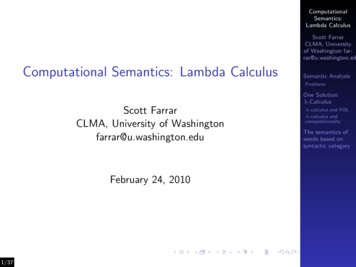
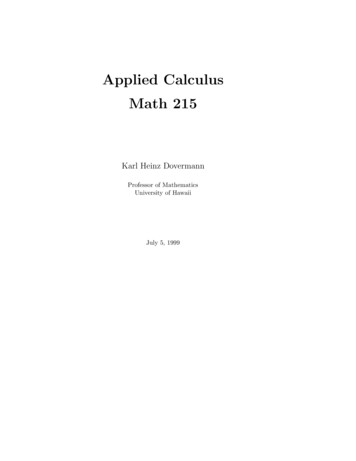
CHAPTER 0. A PREVIEW2time by t (say measured in hours) and the size of the population by P (saymeasured in millions of bacteria), we denote this function by P (t). You liketo know at what rate the population is changing at some fixed time, say attime t0 4. For a straight line, the rate of change is its slope.We like to apply the idea of rate of change or slope also to the function P (t),although its graph is certainly not a straight line.What can we do? Let us try to replace the function P (t) by a line L(t),at least for values of t near t0 . The distance between the points (t, P (t))and (t, L(t)) on the respective graphs isE(t) P (t) L(t) .(1)This is the error which we make by using L(t) instead of P (t) at time t. Wewill require that this error is “small” in a sense which we will precise soon.If a line L(t) can be found so that the error is small for all t in some openinterval around t0 , then we call L(t) the tangent line to the graph of P att0 . The slope of the line L(t) will be called the slope of the graph of P (t) atthe point (t0 , P (t0 )), or the rate of change of P (t) at the time t t0 .P(t)P(t)603.83.955200501504510040504.14.2Figure 2: Zoom in on a point.t123456tFigure 3: Graph & tangent lineLet us make an experiment. Put the graph under a microscope or,on your graphing calculator, zoom in on the point (4, P (4)) on the graph.This process works for the given example and most other functions treatedin these notes. You see the zoom picture in Figure 2. Only under close
3scrutiny, you detect that the graph is not a line, but still bent. So, let usignore this bit of bending and pretend that the shown piece of graph is aline. Actual measurements in the picture let you suggest that the slope ofthat line should be about 70. This translates into the statement that thepopulation of the live bacteria decreases at a rate of roughly 70 million perhour. In Figure 3 we drew the actual tangent line to the graph of P (t) att 4. A calculation based on the expression for P (t), which you should beable to carry out only after having studied a good part of this manuscript,shows that the value of the slope of this line is about 67.0352. You mayagree, that the geometric determination of the rate of change was quiteaccurate.To some extent, it is up to us to decide the meaning of the requirement P (t) L(t) is small for all t near t0 .One possible requirement1 , which it technically rather simple and whichwe will use, is: The exists a positive number A and an open interval (a, b) which contains t0 , such that(2) P (t) L(t) A(t t0 )2for all t in (a, b).The inequality in (2) dictates how close we require the graph of P (t)to be to line L(t). There may, or there may not, exist an interval and anumber A such that the inequality holds for an appropriate line. If the line,the interval, and A exist, then the line is unique. Its slope is called thederivative of P (t) at t0 , it is denoted by P 0 (t0 ), and we say that P (t) isdifferentiable at t0 . Remembering that the rate of change of line L(t) is itsslope, we say If P (t) is a function which is differentiable at t0 , then P 0 (t0 ) is, bydefinition, the rate at which P (t) changes when t t0 .1In a standard treatment a weaker condition, which depends on the notion of limits,is imposed at this point. Our choice of requirement and our decision to avoid limits isbased on the desire to keep the technicalities of the discussion at a minimum, and to makethese notes as accessible as possible. Different interpretations of the word ‘small’ lead todifferent ideas about differentiability. More or fewer functions will be differentiable. Thenotion of the derivative, if it exists, is not effected by the choice of meaning for the word.On the other hand, the interpretation of the word ‘small’ has to imply the uniqueness ofthe derivative.
CHAPTER 0. A PREVIEW4In due time we will explain all of this in more detail. You noticed thatwe need the idea of a line. When you look at (2) and see the square of thevariable you can imagine that we need parabolas. So we review and elaborate on lines and parabolas in Chapter 1. We also introduce the, possibly,two most important functions in life science applications, the exponentialfunction and the logarithm function.Chapter 2 is devoted to the precise definition of the derivative and theexploration of related ideas. Relying only on the definition, we calculate thederivative for some basic functions. Then we establish the major rules ofdifferentiation, which allow us to differentiate many more functions.Chapter 3 is devoted to applications. We investigate the ideas of monotonicity and concavity and discuss the 1st and 2nd derivative tests for finding extrema of functions. In many applications of calculus one proceedsas follows. One finds a mathematical formulation for a problem which oneencounters in some other context. One formulates the problem so that itssolution corresponds to an extremum of its mathematical formulation. Thenone resorts to mathematical tools for finding the extrema. Having found thesolution for the mathematically formulated problem one draws conclusionsabout the problem one started out with.E.g., look at a drop of mercury. Physical principles dictate that thesurface area be minimized. You can derive mathematically that the shapeof a body which minimizes the surface area, given a fixed volume, is a ball.This is roughly what you see. There is a slight perturbation due to the effectof gravity. This effect is much greater if you take a drop of water, for whichthe internal forced are not as strong as the ones in a drop of mercury.Often calculus is used to solve differential equations. These are equationsin which a relation between a function and its rate of change is given2 . Theunknown in the equation is the function. E.g., for some simple populationmodels the equation (Malthusian Law)P 0 (t) aP (t)is asserted. The rate at which the population changes (P 0 (t)) is proportionalto the size of the population (P (t)). We solve this and some other populationrelated differential equations. We will use both, analytical and numericalmeans.The second principal concept is the one of the integral. Suppose you needto take a certain medication. Your doctor prescribes you a skin patch. Let2In more generality, the relation may also involve the independent variable and higherderivatives.
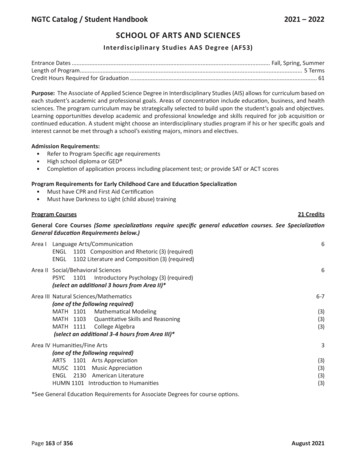
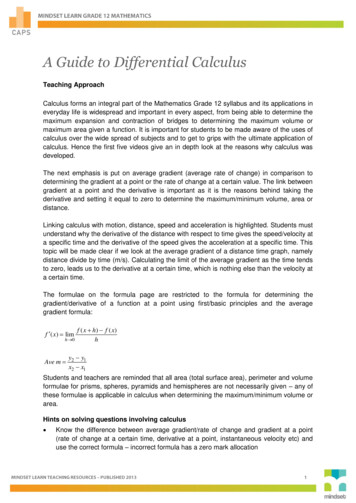
ure 4: Constant Rate234tFigure 5: Amount absorbedus say that the rate at which the medication is absorbed through the skinis a function R(t), where R stands for rate and t for time. It is fair to say,that over some period of time R(t) is constant, say .3 mg/hr. The situationis graphed in Figure 4. Over a period of three hours your body absorbs.9 mg of the medication. We multiplied the rate at which the medicationis absorbed with the length of time over which this happened. Assumingthat you applied the patch at time t 0, the three hours would end attime t 3. An interpretation of the total amount of medication which isabsorbed between t 0 and t 3 is the area of the rectangle bounded bythe line t 0, the line t 3, the x-axis, and the graph of the functionR(t) .3. Its side lengths are 3 and .3. In Figure 5 you see the functionA(t) .3t. It tells you, as a function of time, how much medication hasbeen absorbed.Suppose next that the medication is given orally in form of a pill. Asthe pill dissolves in the stomach, it sets the medication free so that yourbody can absorb it. The rate at which the medication is absorbed is proportional to the amount dissolved. As time progresses, the medication ismoved through your digestive system, and decreasing amounts are availableto being absorbed. A function which could represent the rate of absorptionas a function of time is shown in Figure 6. We denote it once more by R(t).Again you may want to find out how much medication has been absorbedwithin a given time, say within the first 4 hours after swallowing the pill.Set the time at which you took the pill as time t 0. It should be reasonable to say (in fact a strong case can be made for this) that the amount of
CHAPTER 0. A 050.1123456Figure 6: Time dependent ratet123456tFigure 7: Amount absorbedmedication which has been absorbed between t 0 and t T is the areaunder the graph of R(t) between t 0 and t T . We denote this functionby A(T ). Using methods which you will learn in this course, we found thefunction A. The graph is shown in Figure 7. You may find the value forA(4) in the graph. A numerical calculation yields A(4) 0.6735.More generally, one may want to find the area under the graph of afunction f (x) between x a and x b. To make sense out of this we firstneed to clarify what we mean when we talk about the area of a region, inparticular if the region is not bounded by straight lines. Next we need todetermine the areas of such regions. In fact, finding the area between thegraph of a non-negative function f and the x-axis between x a and x bmeans to integrate f from a to b. Both topics are addressed in the chapteron integration.The ideas of differentiation and integration are related to each other. Ifwe differentiate the function shown in Figure 7 at some time t, then we getthe function in Figure 6 at t. You will understand this after the discussionin Section 4.6. In this section we also discuss the Fundamental Theorem ofCalculus, which is our principal tool to calculate integrals.The two basic ideas of the rate of change of a function and the areabelow the graph of a function will be developed into a substantial bodyof mathematical results that can be applied in many situations. You areexpected to learn about them, so you can understand other sciences wherethey are applied.
Chapter 1Some Background MaterialIntroductionIn this chapter we review some basic functions such as lines and parabolas.In addition we discuss the exponential and logarithm functions for arbitrarybases. In a prior treatment you may only have been exposed to special cases.Remark 1. Calculus (in one variable) is about functions whose domain andrange are subsets of, or typically intervals in, the real line. So we will notrepeat this assumption in every statement we make, unless we really wantto emphasize it.1.1LinesLines in the plane occur in several contexts in these notes, and they arefundamental for the understanding of almost everything which follows. Atypical example of a line is the graph of the function(1.1)y(x) 2x 3drawn in Figure 1.1. More generally, one may consider functions of the form(1.2)y(x) mx bwhere m and b are real numbers. Their graphs are straight lines with slopem and y-intercept (the point where the line intersects the y axis) b. In theexample the slope of the line is m 2 and the y-intercept is b 3. Evenmore generally than this, we have the following definition.7
CHAPTER 1. SOME BACKGROUND MATERIAL8Definition 1.1. A line consists of the points (x, y) in the x y-plane whichsatisfy the equation(1.3)ax by cfor some given real numbers a, b and c, where it is assumed that a and b arenot both zero.If b 0, then we can write the equation in the form x c/a, and thismeans that the solutions of the equation form a vertical line. The value forx is fixed, and there is no restriction on the value of y. Lines of this kindcannot be obtained if the line is specified by an equation as in (1.2). Theline given by the equation 2x 3 is shown as the solid line in Figure 1.2.If a 0, then we can write the equation in the form y c/b, and thismeans that the solutions of the equation form a horizontal line, the valuefor y is fixed, and there is no restriction on the value of x. The line givenby the equation 2y 5 is shown as the dashed line in Figure 1.2.If b 6 0, then ax by c translates into y ab x cb , and the equationdescribes a line with slope a/b and y-intercept c/b.yy3-2-112x2-21-4-1123x-6-1Figure 1.1: y(x) 2x 3Figure 1.2: 2x 3 & 2y 5Exercise 1. Sketch the lines 5x 10 and 3y 5.Exercise 2. Sketch and determine the y-intercept and slope of the lines3x 2y 6 and 2x 3y 8.
1.1. LINES9In application, we are often given the slope of a line and one of its points.Suppose the slope is m and the point on the line is (x0 , y0 ). Then the lineis given by the equationy m(x x0 ) y0 .Using functional notation, the line is the graph of the function(1.4)y(x) m(x x0 ) y0 .To see this, observe that y(x0 ) y0 , so that the point (x0 , y0 ) does indeedlie on the graph. In addition, you can rewrite the expression for the functionin the form y(x) mx ( mx0 b) to see that it describes a line withslope m. Its y-intercept is mx0 b.Example 1.2. The line with slope 3 through the point (1, 2) is given bythe equationy 3(x 1) 2. Occasionally, we want to find the equation of a line through two distinct,given points (x0 , y0 ) and (x1 , y1 ). Assume that x0 6 x1 , otherwise the lineis vertical. Set(1.5)y(x) y1 y0(x x0 ) y0 .x1 x 0This isslope formula for a line through the point (x0 , y0 ) withh the pointiy1 y0slope x1 x0 . You should check that y(x1 ) y1 . This means that (x1 , y1 )is also a point on the line. In slope intercept form, the equation of the lineis: y1 y0y1 y0y(x) x x0 y 0 .x1 x 0x1 x 0Example 1.3. Find the equation of the line through the points (x0 , y0 ) (1, 1) and (x1 , y1 ) (3, 4).Putting the points into the equation of the line, we find 4 ( 1)57y(x) (x 1) ( 1) x . 3 122The line is shown in Figure 1.3.
CHAPTER 1. SOME BACKGROUND MATERIAL10y42123x-2-4Figure 1.3: Line through (1, 1) & (3, 4)Summarizing the three examples, we ended up with three different waysto write down the equation of a non-vertical line, depending on the datawhich is given to us: Intercept-Slope Formula: We are given the y-intercept b and slopem of the line. The equation for the line isy mx b. Point-Slope Formula: We are given a point (x0 , y0 ) on the line andits slope m. The equation of the line isy m(x x0 ) y0 . Two-Point Formula: We are given two points (x0 .y0 ) and (x1 , y1 )with different x-coordinate on the line. The equation of the line isy(x) y1 y0(x x0 ) y0 .x1 x 0
1.1. LINES11Exercise 3. Suppose a line has slope 2 and (2, 1) is a point on the line.Using the point (2, 1), write down the point slope formula for the line andconvert it into the slope intercept formula. Find the x and y-intercept forthe line and sketch it.Exercise 4. Find the point-slope and intercept-slope formula of a line withslope 5 through the point ( 1, 2).Exercise 5. A line goes through the points ( 1, 1) and (2, 5). Find the twopoint and slope intercept formula for the line. What is the slope of the line?Where does the line intersect the coordinate axes? Sketch the line.Intersections of LinesLet us discuss intersections of two lines. Consider the linesl1 : ax by c &l2 : Ax By C.They intersect in the point (x0 , y0 ) if this point satisfies both equations. I.e.,to find intersection points of two lines we have to solve two equations in twounknowns simultaneously.Example 1.4. Find the intersection points of the lines2x 5y 7 &3x 2y 5.Apparently, both equations hold if we set x 1 and y 1. This meansthat the lines intersect in the point (1, 1). As an exercise you may verifythat (1, 1) is the only intersection point for these two lines. The lines ax by c and Ax By C are parallel to each other if(1.6)Ab aB,and in this case they will be identical, or they will have no intersection point.Example 1.5. The lines2x 5y 7 &4x 10y 14are identical. To see this, observe that the second equation is just twicethe first equation. A point (x, y) will satisfy one equation if and only if itsatisfies the other one. A point lies on one line if and only if it lies on theother one. So the lines are identical.
12CHAPTER 1. SOME BACKGROUND MATERIALExample 1.6. The lines2x 5y 7& 4x 10y 15are parallel and have no intersection point.To see this, observe that the first equation, multiplied with 2, is 4x 10y 14. There are no numbers x and y for which 4x 10y 14 and4x 10y 15 at the same time. Thus this system of two equations in twounknowns has no solution, and the two lines do not intersect. To be parallel also means to have the same slope. If the lines are notvertical (b 6 0 and B 6 0), then the condition says that the slopes a/b ofthe line l1 and A/B of the line l2 are the same. If both lines are vertical,then we have not assigned a slope to them.If Ab 6 aB, then the lines are not parallel to each other, and one canshow that they intersect in exactly one point. You saw an example above.If Aa bB, then the lines intersect perpendicularly. Assuming thatneither line is vertical (b 6 0 and B 6 0), the equation may be written asa A 1.b BThis means that the product of the slopesof the first line and A/B the one of theof one line is the negative reciprocal of thethe condition which you have probably seenperpendicularly.of the lines ( a/b is the slopesecond line) is 1. The slopeslope of the other line. This isbefore for two lines intersectingExample 1.7. The lines3x y 1 &x 3y 7have slopes 3 and 1/3, resp., and intersect perpendicularly in (x, y) (1, 2). Exercise 6. Find the intersection points of the linesl1 (x) 3x 4&l2 (x) 4x 5.Sketch the lines and verify your calculation of the intersection point.
1.2. PARABOLAS AND HIGHER DEGREE POLYNOMIALS13Exercise 7. Determine the slope for each of the following lines. For eachpair of lines, decide whether the lines are parallel, perpendicular, or neither.Find all intersection points for each pair of lines.l1 : 3x 2y 7l2 : 6x 4y 6l3 : 2x 3y 3l4 : 6x 4y 5Exercise 8. Suppose a line l(x) goes through the point (1, 2) and intersectsthe line 3x 4y 5 perpendicularly. What is the slope of the line? Findits slope point formula (use (1, 2) as the point on the line) and its slopeintercept formula. Sketch the line.1.2Parabolas and Higher Degree PolynomialsA parabola is the graph of a degree 2 polynomial, i.e., a function of the form(1.7)y(x) ax2 bx cwhere a, b, and c are real numbers and a 6 0. Depending on whether a ispositive or negative the parabola will be open up- or downwards. Abusinglanguage slightly, we say that y(x) is a parabola. We will study parabolas intheir own right, and they will be of importance to us in one interpretationof the derivative.Typical examples of parabolas are the graphs of the functionsp(x) x2 2x 3 andq(x) x2 x 1shown in Figures 1.4 and 1.5. The first parabola is open upwards, the secondone downwards.The x-intercepts of the graph of p(x) ax2 bx c are also called rootsor the zeros of p(x). To find them we have to solve the quadratic equationax2 bx c 0.The solutions of this equation are found with the help of the quadraticformulaip1 hp(x) 0 if and only if x (1.8) b b2 4ac .2aThe expression b2 4ac under the radical is referred to as the discriminantof the quadratic equation. There are three cases to distinguish:
CHAPTER 1. SOME BACKGROUND MATERIAL14yy6154-23-112x-
Karcher had learned calculus this way from his teacher, Heinz Schwarze. There are German language college level textbooks by K utting and M oller and a high school level book by M uller which use this approach. Calculus was developed by Sir Isaac Newton (1642{1727) and Gottfried Wilhelm Leibnitz (1646{1716) in the 17th century. The emphasis .