Transcription
The SAS Add-In forMicrosoft Office: ABeginner's GuideSAS INSTITUTESAS Institute, Inc.Cary, NC
The correct bibliographic citation for this manual is as follows: SAS Institute. 2021. TheSAS Add-In for Microsoft Office: A Beginner’s Guide. Cary, NC: SAS Institute Inc.Introduction to Statistical and Machine Learning Methods for Data ScienceCopyright 2021, SAS Institute Inc., Cary, NC, USAISBN 978-1-955977-76-0 (Web PDF)All Rights Reserved. Produced in the United States of America.For a hard copy book: No part of this publication may be reproduced, stored in aretrieval system, or transmitted, in any form or by any means, electronic, mechanical,photocopying, or otherwise, without the prior written permission of the publisher, SASInstitute Inc.For a web download or e-book: Your use of this publication shall be governed by theterms established by the vendor at the time you acquire this publication.The scanning, uploading, and distribution of this book via the Internet or any othermeans without the permission of the publisher is illegal and punishable by law. Pleasepurchase only authorized electronic editions and do not participate in or encourageelectronic piracy of copyrighted materials. Your support of others’ rights is appreciated.U.S. Government License Rights; Restricted Rights: The Software and itsdocumentation is commercial computer software developed at private expense and isprovided with RESTRICTED RIGHTS to the United States Government. Use, duplication,or disclosure of the Software by the United States Government is subject to the licenseterms of this Agreement pursuant to, as applicable, FAR 12.212, DFAR 227.7202-1(a),DFAR 227.7202-3(a), and DFAR 227.7202-4, and, to the extent required under U.S. federallaw, the minimum restricted rights as set out in FAR 52.227-19 (DEC 2007). If FAR52.227-19 is applicable, this provision serves as notice under clause (c) thereof and noother notice is required to be affixed to the Software or documentation. TheGovernment’s rights in Software and documentation shall be only those set forth in thisAgreement.SAS Institute Inc., SAS Campus Drive, Cary, NC 27513-2414October 2021SAS and all other SAS Institute Inc. product or service names are registered trademarksor trademarks of SAS Institute Inc. in the USA and other countries. indicates USAregistration.Other brand and product names are trademarks of their respective companies.SAS software may be provided with certain third-party software, including but notlimited to open-source software, which is licensed under its applicable third-partysoftware license agreement. For license information about third-party softwaredistributed with SAS software, refer to http://support.sas.com/thirdpartylicenses.
ContentsAbout This Bookvii1.Getting Started12.Working with Data in Excel153.Working with Tasks334.Working with Stored Processes545.Customizing Results716.Advanced Features79
About This BookWHAT DOES THIS BOOK COVER? The SAS Add-In for Microsoft Office taps into the power of SAS for dataexploration, reporting, and analytics directly from Microsoft Office viaintegrated menus and toolbars. SAS provides two add-ins for MicrosoftOffice: the SAS Add-In for Microsoft Office and SAS Visual Analytics Add-Infor Office.With the SAS Add-In for Microsoft Office, you can explore data or insertSAS tables and charts into a spreadsheet or document to work with themin Office – all with no programming skills required! Seamless integrationmakes it easy to collaborate and share analytics-driven reports,visualizations, KPIs, and dashboards with the rest of your team.This book shows you how to use the SAS add-in’s dynamic features tocreate customized results in various applications including Excel, Outlook,PowerPoint, and Word. This book explains the features of the SAS add-inand shows you how to get the most out of the integration between SAS andMicrosoft Office. This book covers how to do the following: Create a connection profile to connect the SAS desktopapplication to your metadata server Use the SAS tab and the SAS panel Manage favorites View and edit data in Excel Use SAS tasks to create charts and tables Run a stored processvii
ABOUT THIS BOOKviii Apply and customize styles to your reports Submit SAS code Automate basic actions and tasks Use the SAS Visual Analytics Add-In for Office to interact with SASVisual Analytics reports And more!WHAT MATERIALS WERE USED TO DEVELOP THISBOOK?This book is based on the series of how-to tutorial videos on the SAS Add-Infor Microsoft Office Version 8 available at https://video.sas.com/category/videos/version-8. Other resources used to develop this book include thedocumentation for the SAS Add-In 8.3 for Microsoft Office available c/8.3/amoug/titlepage.htm.IS THIS BOOK FOR YOU?This book is for anyone who wants to learn more about the SAS Add-Infor Microsoft Office. The SAS Add-In for Microsoft Office and SAS VisualAnalytics Add-In for Office are designed for people with limited SASknowledge and experience. The SAS add-in allows for point-and-clickexploration of data and easy generation of reports with zero programmingskills required. However, if you have programming experience, you canwrite and submit SAS code in the add-in as well. You might even be able towrite and submit code in Python and R, depending on your SAS installation.WHAT SHOULD YOU KNOW ABOUT THE EXAMPLES?This book includes examples for you to follow to gain hands-on experiencewith the SAS add-in. Your version of the SAS add-in might differ based onthe features available in your installation of SAS Office Analytics.
ABOUT THIS BOOKixSOFTWARE USED TO DEVELOP THE BOOK’S CONTENTThe SAS Add-In for Microsoft Office is part of SAS Office Analytics, SAS Enterprise BI Server, and SAS Enterprise Miner . The SAS Add-In 8.3 forMicrosoft Office was used to develop the book’s content.You might notice a few changes from version 7. The following listexplains some of the new features that you might notice as you make thetransition to this release. SAS Tab: New to the SAS add-in in version 8 are the icons forCurrently Open and Recent. You can also access those itemsusing the Home tab in the SAS panel. Opening a Table: The process of opening a table in version 8 isno different from what you are accustomed to in previousreleases. Only the name of the icon has changed. The name ofthe icon is now “Data” instead of “SAS Data”. Inserting Results: You are no longer prompted where to insertresults. One of the changes is that the results now appear in aseparate panel. This is the SAS panel, which is new for the SASAdd-In 8.3 for Microsoft Office. The Results tab in the SAS panel islike a more flexible Preview window.To insert results, select the table or chart, and then click the icon to insertthe selected results.WE WANT TO HEAR FROM YOUSAS Press books are written by SAS Users for SAS Users. We welcome yourparticipation in their development and your feedback on SAS Press booksthat you are using. Please visit sas.com/books to do the following: Sign up to review a book Recommend a topic Request information about how to become a SAS Press author Provide feedback on a book
xABOUT THIS BOOK
CHAPTER 1INTRODUCTIONThe SAS Add-In for Microsoft Office provides transparent access to thepower of SAS for data access, reporting, and analytics directly fromMicrosoft Office via integrated menus and toolbars. SAS provides two addins for Microsoft Office: SAS Add-In for Microsoft Office and SAS VisualAnalytics Add-In for Office.In this chapter, you will learn how to start using the SAS Add-In forMicrosoft Office version 8. (See Chapter 6 for information about the SASVisual Analytics Add-In for Office.)Note: To determine which SAS add-in you are running, on the SAS tab click Help About SAS Add-In for Microsoft Office.The SAS add-in is part of the SAS Enterprise BI Server and SAS OfficeAnalytics solutions. The add-in extends Office functionality by enabling youto use the power of SAS analytics and access data directly from MicrosoftExcel, Word, PowerPoint, and Outlook.The main benefit of the add-in is that even if you have limited SASknowledge and are more comfortable in Excel, you can still access the1
SAS INSTITUTE2powerful analytical and statistical tools available in SAS. There is no need todo a separate dump into Excel. Another benefit is that SAS does not havethe same row limitations as Excel, so large data sets can also be broughtinto Excel because the data is being processed through the SAS server.Perhaps the best benefit to using the add-in is that the file can refresh thesource data without requiring the data be completely brought in new orthe file needing to be re-created.[1]The functionality that is available for the SAS add-in varies amongMicrosoft Office applications. (See Table 1.1.) In Excel, PowerPoint, andWord, you can run analyses, generate reports, and share SAS content withother users at your site. In Excel, you can open and edit data sources.In Outlook, you can monitor reports and share reports with other users.However, you cannot create new reports or run a SAS task in Outlook.Table 1.1: Microsoft Office Features ComparisonExcelOpen DataSourceEdit DataSourceRunAnalysesGenerateReportsShare ION PROFILEIn this section, you will learn how to create and manage connection profilesin the SAS Add-In for Microsoft Office. A connection profile is a small filestored on the local machine that contains the information necessary toconnect the SAS desktop application to your metadata server.
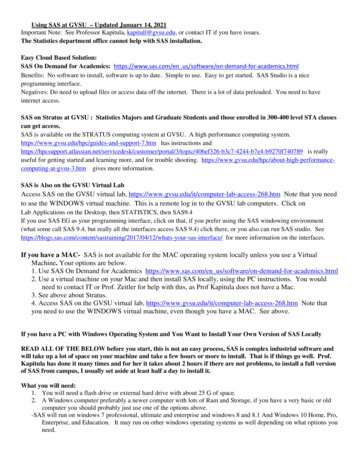
CHAPTER 1: GETTING STARTED3Note: Your SAS administrator might have already completed this step for you.CREATE A CONNECTION PROFILETo create a new connection, you need to access the SAS Connectionswindow. There are several ways to access the Connections window. In aMicrosoft Office application, click Home in the SAS tab to open the SASpanel. In the SAS panel, click Reports. This lets you see all of your serverconnections and their status.To create a new connection, click Manage Connections. This opens theSAS Connections window as shown in Figure 1.1.Figure 1.1: SAS Connections WindowAlternatively, you can access Connections from the SAS tab in Excel, Word,and PowerPoint by clicking Tools Connections. In Outlook, select
SAS INSTITUTE4Connections. You can also access Connections in SAS Enterprise Guide byclicking My Server in the lower right corner of the window or selectingTools Options Administration.Note: If you have installed the SAS add-in but do not see the SAS tab in yourOffice application, you might need to enable the SAS Add-In for Microsoft Office. Inyour Office application, go to File Options Add-Ins. From the Manage AddIns drop-down menu, select COM Add-Ins, and then click Go. Select the SAS checkbox if it is unchecked. Then click OK.The SAS Connections window displays a list of existing connections that youcould use to designate the active SAS9 metadata profile. To create a newprofile, click Manage, and then in the Connections window, click Add.In the Create Profile window, you can name the profile and specifythe machine and port information. Your SAS9 administrator will have themachine and port information for your organization. Enter the user nameand password. There are a few other settings available in the Create Profilewindow. The Save login in profile option enables the user to beautomatically connected when using this profile. The Use Integrated Windows Authentication option enablesthe user’s Windows credentials to also be used to connect to theserver. Authentication domain lets you specify the authenticationdomain for the profile to enable resource use without prompting.If the domain of the resource matches the value specified in theprofile, the user is not prompted to enter credentials.When all the settings are ready, click Save. In the Connections window,
CHAPTER 1: GETTING STARTED5make this new connection the active connection by clicking Set Active.Any specifications that you make in the Connections window are valid foryour current and future Microsoft Office sessions. In the SAS Connectionswindow, you can see that the new profile that you’ve added appears as theactive SAS9 metadata profile. If you had forgotten to make the new profilethe active profile, you can also set that in this window.When you return to the Reports tab, it displays the new profile as theactive connection. Click the profile to see a list of folders available to theuser and make sure everything is working as expected.Note: If you use the SAS add-in without a profile, you can access a SAS serverinstalled on your local machine only. You cannot define libraries or share SASresources with other SAS applications.THE SAS TABThe SAS Add-In for Microsoft Office places a new tab on the ribbon thatsurfaces SAS functionality. Figure 1.2 shows the ribbon in Excel.Figure 1.2: SAS Tab in ExcelIn Microsoft Excel, Word, and PowerPoint, there are three groups on theSAS tab: General Selection Tools
SAS INSTITUTE6In Outlook, there are only two groups because there is no Selection section.GENERALLet’s look first at the General group. Notice in Figure 1.2 that there are iconsfor the following: Home – Clicking Home opens the SAS Panel. From the SAS Panel,you can quickly access reports, tasks, and programs, as well asany available results. The SAS Panel will be discussed in moredetail in the next section. Data – The Data option is only available in Excel. It enables you toopen a data source into a worksheet. Reports – Use this option to access reports. Tasks – Use this option to access tasks. (Not included in Outlook.) Programs – Use this option to access SAS programs. (Notincluded in Outlook.) Currently Open – This option shows a list of currently opencontent. There is also a selection to open the Manage Contentwindow in which you can perform a variety of tasks such asdeleting SAS content, refreshing analyses and data sources, andsending the results from an analysis to another Microsoft Officeapplication. Recent – This option provides a list of recently opened items. Youcan specify the number of items to include in this list. The defaultvalue is 25. Favorites – These are the items that you access frequently andare shared between Excel, Word, PowerPoint, and Outlook withaccess determined by the functionality available in theapplication. If a favorite cannot run in your current MicrosoftOffice application, then it is dimmed.
CHAPTER 1: GETTING STARTED7SELECTIONThe Selection group enables you to refresh or modify SAS content orchange the properties associated with the content type. Items are dimmeduntil content is open and selected.TOOLSIn the Tools group, there are two choices: Tools and Help.The Tools item enables you to perform actions such as viewing thestatus of processes, accessing the Style Manager, and opening the Optionswindow. The Tools item also enables you to manage the connection to yourmetadata server. This menu is much shorter in Outlook than in the otherOffice applications. In Outlook, there are only three choices: Connections,Status, and Options.The Help item gives you access to the Help facility for the SAS add-in.Additional groups and options become available when you select SAScontent or work with data sources. For example, if you open a SAS table in aworksheet in Excel, you will notice two new groups on the SAS tab: Navigateand External Data. The options that you find in these groups are specific toworking with a data source.CUSTOMIZING THE SAS TABYou can customize the icons that are show on the SAS tab by going to Tools Options Customize. In the Customize category, clear the check boxesfor any items that you do not want to show on the ribbon.SAS PANELThe SAS panel consolidates all of the SAS add-in functionality so that youcan quickly access everything in one place. Many of the same features inthe SAS tab are also available in the SAS panel. The SAS panel is fairlysimilar in all Office applications with the exception of Outlook. In Outlook,you cannot run tasks or submit SAS code.
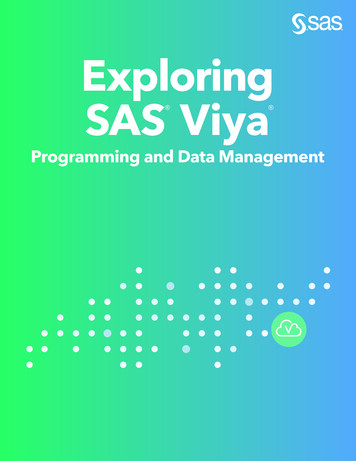
8SAS INSTITUTETo open the SAS panel, click Home on the SAS tab. The Home tab appearsfirst in the panel on the right side of your screen, as shown in Figure1.3. The other tabs are Reports, Tasks, Programs, and Search. When areport, task, stored process, or program has been run, a new tab, Results,becomes available.Figure 1.3: SAS Panel in ExcelLet’s look at each of the different tabs within the SAS panel and learn aboutwhat they do.HOMEInitially in the Home tab, a list of currently open items is displayed. Clickingthe down arrow enables you to change the view. In addition to theCurrently Open view, you can see Samples, Recent, and Favorites. TheRecent view shows tables, reports, stored processes, and tasks that youhave worked with.To open any of these items, simply click on the icon. If you open a table,the View SAS Data window appears. You can accept all the defaults andclick OK to open. The table is then opened into the current worksheet onthe left side of your screen. Now, if you change the view to Currently Openin the SAS panel, you will see the table.
CHAPTER 1: GETTING STARTED9In the Currently Open view, you can click the Select all check box toselect all open reports. Notice that you have three actions available. Youcan refresh the selected items, send the selected items to anotherMicrosoft Office application, or close all the selected items.Note: Data sets and pivot table reports are valid only inside Microsoft Excel andcannot be sent to another application.When you close an item, you are prompted to remove the content fromthe document or leave it in the document. If you leave the content in thedocument, that content is no longer connected to SAS.REPORTSFrom the Reports tab, you can see all your server connections and theirstatus. You can also open reports and run stored processes. Navigateto the location of the report or stored process that you want to openby clicking on the My Serverconnection and clicking through the folderstructure to find the name of the item. Follow any prompts to customizeyour report or stored process, and then click Run.Notice that a new tab, Results, has appeared in the SAS panel and is theactive tab. This tab displays the results of your report or stored process.TASKSFrom the Tasks tab, you can open any task that is included with the SASadd-in, any custom tasks, and any SAS Studio tasks, if your site has SASStudio licensed and installed. There are three views in this tab: All, Recent,and Favorites. You can change the view by clicking the down arrow next tothe current view at the top of the tab.Click on a task in the list to run it. Follow the prompts in the dialogue
SAS INSTITUTE10windows to customize your task, and then click Run. When a task is run,the report is displayed on the Results tab.RESULTSThe Results tab shows all the reports that are open. Clicking the downarrow next to the name of a report in the top of the panel shows thecomplete list of results. To the right of the result list, you will see a row ofsix icons. These icons enable you to perform the following actions: Insert results into document or remove results Insert selected results into document or remove selected results Search for a selection in the results Refresh the results View detailed information about the results More optionsIf a report contains multiple elements such as a table and a chart, you canselect the report elements to include in the Microsoft Office application.When you insert a result in Excel, the action is to place those results in theactive cell. If you don’t want the results to override the information youmight already have in your workbook, first open a new worksheet.You can insert all the results or only the selected results using the iconsat the top of the panel. To insert all results, click the Insert report intodocument icon. To insert select results, click on the element(s) that youwant, including any titles. Then click the Insert selected results intodocument icon. (See Figure 1.4.) Your results will now appear in theworksheet.
CHAPTER 1: GETTING STARTED11Figure 1.4: Insert Selected ResultsClick the More options icon to modify, export to PDF, email, send to, addto favorites, close, and close all.PROGRAMSThis tab includes a code editor that you can use to write and run SASprograms. The language editor includes a wide variety of features,including autocompletion, automatic formatting, pop-up help, andparenthesis matching.You can customize many of the settings for this editor. In the Programstab, click the More options ( ) icon and select Import program to openany existing SAS program saved on your server. When you have the finalcode ready in the editor, click the running man icon in the top right to run
12SAS INSTITUTEthe program. Notice that there are now three tabs: Code, Log, and Results,as shown in Figure 1.5.Figure 1.5: Programs TabThe Results tab displays the program output. You can insert all the resultsor just a selected portion. To view any warnings, errors, or notes, click theLog tab. To return to the program, click the Code tab.SEARCHUse the Search tab to search all available servers for a report. Enter a terminto the search bar to search for any reports with that term in the title. Clickon the search results to run the report that you want.
CHAPTER 1: GETTING STARTED13MANAGE FAVORITESBefore we end this chapter, let’s discuss one feature in more depth. SASFavorites enable you to quickly run tasks and stored processes or createreports in Microsoft Office applications. Let’s look at how to add andremove SAS Favorites. There are two locations where you can viewFavorites: The Favorites icon on the SAS tab The Favorites view in the Home tab of the SAS panelThe quickest way to view your favorites is by clicking the Favorites iconon the SAS tab. A drop-down menu with all favorited items will appear.Any items or tasks that cannot be run in your current Microsoft Officeapplication will not be displayed. When you select any item from this list,the results will appear in the SAS panel. From there, it is a simple step toinsert the results into your document.The other way to view your favorites is by clicking the Home tab in theSAS panel. From the drop-down Views menu, select Favorites. This viewwill show all items that you have added as a favorite.To add an item to your favorites, you will first need to run it. Using theResults tab in the SAS panel, you can add any open report, task, or wizardto your favorites. Select More Options and Add to Favorites.If you decide that you no longer want to mark a report or task as afavorite, it is easy to remove. Click the Home tab in the SAS panel and makesure the view is set to Favorites. Notice in Figure 1.6 that there is a filledstar icon in the bottom right corner of each favorited item. Click that staricon and the item is removed as a favorite. Be careful to click the star icon.If you click elsewhere, you will open the item.
14SAS INSTITUTEFigure 1.6: FavoritesIn this chapter, you learned what features are available in each MicrosoftOffice application and how to create a connection profile. You should nowbe familiar with the options in the SAS tab and the SAS panel. In the nextchapter, you will learn how to work with data in Excel so that you can createreports and tasks that can be used in other applications.[1] Davies, Jennifer (2013). “The Basics of Using SAS Excel Add-In.” NESUG2013, Burlington, VT. Available at https://www.lexjansen.com/nesug/nesug13/78 Final Paper.pdf.
CHAPTER 2Working with Data in ExcelINTRODUCTIONIn this chapter, we will explore SAS add-in functionality in Microsoft Excel.As was explained in the previous chapter, different Office applications havedifferent functionality. In Excel, you can access and edit data. You can alsocreate native Excel charts.One of the benefits of using the SAS add-in is that you can access andview data sources that exceed the record limitation in Excel. The SAS addin does its processing on the server, which enables the record limitation inExcel to be bypassed.VIEWING DATA IN A WORKSHEETYou can do any of the following in Microsoft Excel: Access data from a workspace server that your SAS administratorsets up Reference SAS data sources on remote servers by using metadatadefinitions Open data sources directly by using your computer’s file systemor by navigating to the server and the library folders that areaccessible from your computer.15
16SAS INSTITUTEOPENING DATATo open a data source, click the Data icon in the SAS Tab. This opens theView SAS Data window. If you have worked with a data set recently, it willappear in the Data drop-down menu at the top of the window. If the tablethat you need is not in the list, simply click Browse and navigate to thelocation where the file is stored.To see information about any applied filter, how the data is sorted, andhow many columns will appear in the worksheet, click the arrow next toDetails to expand the section as shown in Figure 2.1.Figure 2.1: View SAS Data WindowTo filter and sort the data before inserting it, click the Filter & Sort button.The Modify Data Source window appears where you can select whichvariables you want to include from the data set. Use the left and rightarrows to select individual variables or use the double left and right arrowsto move all variables into the Available or Selected areas. (See Figure 2.2.)
CHAPTER 2: WORKING WITH DATA IN EXCEL17Figure 2.2: Modify Data Source Window – VariableAfter you open the data, you can return to this window and make moremodifications using the Filter & Sort option in the Selection group on theSAS Tab. Click OK to return to the View SAS Data window.Note: If you select Data Sort, you are using the Microsoft Excel sort tool. Thisis not the same tool as the SAS sort tool in the Modify Data Source window.In the View section, verify that Worksheet is selected. (PivotTables arediscussed in the next section of this chapter.) Notice that only 500 records
SAS INSTITUTE18(or rows) are displayed at a time. You can change that number or displayall of the records in the table (not recommended for large data sets). Youcan choose to insert record numbers in the first column as well as displaythe data source and filter information in the worksheet. Depending on howyou set your default options, those boxes might be selected.By default, the data is placed into the existing worksheet. However, you canchange this location in the Location section. When you are done makingyour selection, click OK. The SAS table is now added to the worksheetlocation that you have selected.NAVIGATING DATAOn the SAS Tab, two new groups have been added: Navigate and ExternalData. (See Figure 2.3.)Figure 2.3: SAS TabUse the Navigate group to move through your data. By clicking the Go tothe end of your data icon ( ) you can see how many rows of data youhave.FILTERING DATAIf you want to further subset your data now, go to the Selection groupon the SAS tab and click Filter & Sort to open the Modify Data Sourcewindow. This is the same window that you are able to access when addingthe data. (See Figure 2.2.) Click the Filter tab at the top of the window. Youwill need to supply three pieces of information to create a simple filter: the variable that you want to subset the value(s) to which you want to subset the data and how you want to compare the two items.The value must match the values in the data set in name and case. If you
CHAPTER 2: WORKING WITH DATA IN EXCEL19are unfamiliar with the values in your data set, click on the ellipsis button( ) next to the third field. This action displays a list of values that you canselect for the value of the variable as shown in Figure 2.4.Figure 2.4: Modify Data Source Window – FilterClick OK to apply the filter and return to the worksheet.Notice that the filter information is displayed at the bottom of the Excelwindow beneath the worksheet tab. Displaying that information is thedefault setting. If you don’t like that functionality, use the Options windowto change it.You can always sort the data, adjust or remove the filter, as well aschange the columns that are displayed. Remember that if you choose notto display a column in the worksheet, it does not prevent you from using itin an analysis.
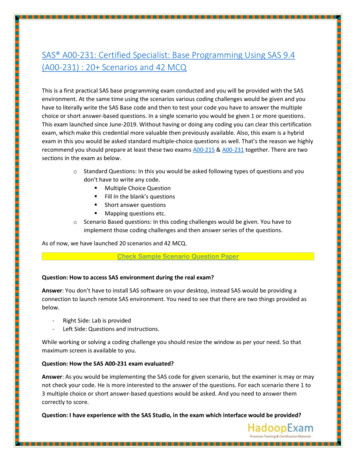
20SAS INSTITUTEVIEWING DATA IN A PIVOTTABLEIn this section, we will explore how the SAS add-in’s functionality enablesSAS data to be viewed in an Excel PivotTable.First, click Data to open the View SAS Data window. Select the data thatyou want to view from the recently accessed list or click Browse to navigateto the storage location. In the View section, select PivotTable as the way toview the data. Choose the location where you want the data to open, andthen click OK.Initially, no data is displayed in the report. Use the PivotTable Fieldspanel to select the items to be displayed. (See Figure 2.5.)Figure 2.5: PivotTable Fields PanelThis panel displays two sections: a field section at the top for adding andremoving fields, and a layout section at the bottom for rearranging andrepositioning fields. Select the check boxes next to the fields that you wantto add. These will appear as columns in the table on the left as you addthem. If you no longer need a column, simply uncheck the field in the panel.
CHAPTER 2: WORKING WITH DATA IN EXCEL21Note: To change the design of the table, click the Design tab in the ribbon tolocate and apply a different PivotTable style.You can use the PivotTable functionality to interact with your SAS data.Right-click on a column heading to see the actions that are available.EDITING SAS DATA IN A WORKSHEETThe data writeback feature is available only in Microsoft Excel. It enablesusers with the appropriate permissions to
Microsoft Office via integrated menus and toolbars. SAS provides two add-ins for Microsoft Office: SAS Add-In for Microsoft Office and SAS Visual Analytics Add-In for Office. In this chapter, you will learn how to start using the SAS Add-In for Microsoft Office version 8. (See Chapter 6 for information about the SAS