Transcription
THE JOURNAL OF FINANCE VOL. LVIII, NO. 6 DECEMBER 2003Competition among Trading Venues: Informationand Trading on Electronic Communications NetworksMICHAEL J. BARCLAY, TERRENCE HENDERSHOTT,and D. TIMOTHY McCORMICK nABSTRACTThis paper explores the competition between two trading venues, ElectronicCommunication Networks (ECNs) and Nasdaq market makers. ECNs o¡er theadvantages of anonymity and speed of execution, which attract informed traders. Thus, trades are more likely to occur on ECNs when information asymmetry is greater and when trading volume and stock-return volatility are high.ECN trades have greater permanent price impacts and more private information is revealed through ECN trades than though market-maker trades. However, ECN trades have higher ex ante trading costs because market makers canpreference or internalize the less informed trades and o¡er them better executions.TECHNOLOGICAL INNOVATIONS THAT ENABLE HIGH-SPEED, low-cost electronic tradingsystems are dramatically changing the structure of nancial markets. Exchanges and markets around the world are merging or forming alliances to improve liquidity and reduce costs in the face of increased competition from eachother and from these computerized trading systems. Trading volume on Electronic Communications Networks (ECNs) has grown rapidly over the past severalyears. ECNs are now involved in more than a third of Nasdaq tradingvolume and are attempting to increase their market share in NYSE-listednBarclay is at the Simon School of Business, University of Rochester; Hendershott is at theHaas School of Business, University of California at Berkeley; and McCormick is at NasdaqEconomic Research. We thank Rick Green (the editor), an anonymous referee, Robert Battalio, Ken Kavajecz, and seminar participants at the Financial Markets Research Center Conference on Market Quality at Vanderbilt University, Notre Dame University, the University ofCalifornia at Berkeley, the University of California at Davis, the University of Rochester, theUniversity of Texas at Austin, the 2001 NBER Market Microstructure meeting, the 2001 Workshop on Information Systems and Economics, the 2001 Western Finance Association meetings,and the 2002 American Finance Association meetings for helpful comments and suggestions.An anonymous referee provided numerous excellent ideas and Joel Hasbrouck provided manyhelpful suggestions regarding the nonstationary time-series analyses. A previous version ofthis paper titled ‘‘Electronic Communications Networks and Market Quality’’ won the NewYork Stock Exchange Award for the best paper on equity trading at the 2001 Western FinanceAssociation meetings. The views expressed herein are not intended to represent the views oro cial policy of The Nasdaq Stock Market, Inc. Hendershott gratefully acknowledges nancial support from the National Science Foundation. Any errors or omissions are the responsibility of the authors alone.2637
2638The Journal of Financeissues as well. ECNs o¡er the promise of greater operational e ciency,lower trading costs, improved limit order exposure, trader anonymity, and fasterexecutions.ECNs di¡er from Nasdaq market makers in several important dimensions.ECNs are open limit order books that facilitate customer-to-customer trades.ECNs compete with market makers by providing anonymous and immediateexecution and by improving the quotes (sometimes using smaller tick sizes). Market makers, in contrast, enter into long-term agreements with brokers who preference or internalize their customers’ orders regardless of the current quotes.The majority of small trades with market makers are preferenced or internalizedand market makers contract with brokers to attract the most pro table trades.Market makers also negotiate with institutional investors to intermediate largeorders.Using 1 month of data from June 2000 that identi es all ECN and marketmaker trades for a strati ed sample of 150 Nasdaq National Market stocks, weexplore how these di¡erences between ECNs and market makers a¡ect the trading choices of di¡erent types of traders. First, we examine the market conditionsunder which ECN trades are more likely to occur. We then investigate whetherinformed trades are more likely to occur with market makers or on ECNs, andstudy the role of ECN trading in the aggregate price discovery process. Finally,we document the trading costs on these electronic trading systems and comparethem with the trading costs for market-maker trades.Together, these results provide new insights about the competition for order ow across trading venues thato¡er di¡erent services to their customers.Trades on ECNs are smaller than trades with market makers and are morelikely to occur during periods of high trading volume and high stock-return volatility. ECN trades are also more likely to occur when spreads are narrow and, notsurprisingly, when ECNs are o¡ering better prices. In the cross section, ECNtrades are more prevalent in stocks that have high trading volume, large marketcapitalization, and fewer market makers.The higher frequency of ECN trades during periods of high trading volume andhigh stock-return volatility suggests that ECNs attract a higher fraction of informed trades than market makers. There are several reasons why this might bethe case. First, market makers are able to preference the less-informed order owand may force the more-informed trades on to an ECN. In addition, especially infast moving markets, informed traders may prefer the ECNs’ speed of executionand pre- and post-trade anonymity.To determine where informed trades are more likely to occur and to measurethe relative importance of ECN and market-maker trades in the price discoveryprocess, we decompose the stock-price variance into its trade-related and tradeunrelated components (Hasbrouck (1991a)), and show that ECN trading explainsabout two-thirds more of the stock-price variance than market-maker trades. Tocontrol for the contemporaneous correlation between ECN and market-makertrades, we also estimate vector autoregressions (Hasbrouck (1991b)) and measurethe permanent price impact of trades in di¡erent venues.When we conservativelyassume that all contemporaneous correlation between ECN and market-maker
Competition among TradingVenues2639trades is attributable to market-maker trading, we nd that the permanent priceimpact of an ECN trade is 50% larger than the permanent price impact of a market-maker trade.1The higher frequency of informed trades on ECNs directly a¡ects both ex anteand ex post trading costs. If market makers compete for the right to preferencethe less-informed orders, one might expect small trades with market makers tohave lower ex ante trading costs than similar trades on ECNs. Indeed, smalltrades (less than 1,000 shares) that are executed by market makers have slightlylower e¡ective spreads than small trades on ECNs, even after controlling formarket conditions at the time of the trade. However, because ECNs trades aremore informed, they have signi cantly smaller ex post trading costs, as measuredby the realized spread.The competition for large trades is more complex. Market makers can negotiate directly with institutional traders and price discriminate based on theirinferences about traders’ motives and information. Because these negotiationsare repeated, market makers can quote competitive prices for large liquiditytrades and impose costs on traders who take advantage of their private information. Our results show that market makers are extremely good at identifyinglarge liquidity trades and protecting themselves against large informed trades.Following large trades with market makers, prices actually move in the directionopposite the trade (down following customer purchases and up following customer sales), which makes the realized spreads on these trades larger than thee¡ective spreads.Traders who demand liquidity for large positions, but who cannot credibly signal that their trades are uninformed, receive inferior prices from market makers.As an alternative to paying a large spread to a market maker, these traders cansubmit a limit order to an ECN. By posting a limit order on an ECN, the liquiditytrader may receive the bid-ask spread rather than paying it, but he also bears theadverse-selection costs of trading with someone who has better information.Liquidity traders will use limit orders when the expected adverse-selection andopportunity costs are lower than the spread charged by a market maker. Largetrades will execute on an ECN only when one of these ‘‘natural’’counterparties iso¡ering su cient depth. Thus, although there are relatively few medium andlarge trades on ECNs, these trades have signi cantly lower e¡ective spreads thansimilar trades with market makers.Most ECNs use a smaller tick size than prescribed by Nasdaq.2 The ability tosubmit limit orders on fractional ticks also has a di¡erential e¡ect on informedand uninformed traders. Informed traders need to trade before the market price1These results are consistent with the results on trading after hours in Barclay and Hendershott (2003). They nd that after the close, information asymmetry is low and trades arelarge and tend to occur with market makers. Before the open, information asymmetry is high,trades are smaller, more likely to occur on an ECN, and are more informed.2During our sample period, some ECNs used a tick size of 1/256 compared with 1/16 onNasdaq. All quotes displayed on Nasdaq, including ECN quotes, are rounded to the nearest1/16.
2640The Journal of Financere ects their information. Uninformed traders can be more patient. Becausethey have no reason to believe the price will move against them, uninformedtraders can pro t by waiting for opportunities to get better executions. Thus,submitting a limit order to an ECN that improves the quote by a fractionaltick will have little e¡ect on the arrival of informed trades, but may attract anuninformed trade that is searching for better execution. We show that tradeson fractional ticks have lower e¡ective spreads, but larger realized spreadsthan trades on integer-ticks. Together, these results show that limit orderson fractional ticks do attract the less informed and consequently more patienttraders.Our results are related to the existing literature on multimarket trading.However, our results highlight important di¡erences between ECNs andother trading venues, such as regional exchanges, that have skimmed order ow from primary markets. Generally, when a secondary market skims ordersfrom the primary market, the secondary market skims the least informedand, consequently, most pro table orders. For example, Easley, Kiefer, andO’Hara (1996) show that the Cincinnati Stock Exchange attracts mostlyuninformed orders in NYSE stocks and Bessembinder and Kaufman (1997) nd this for the regional exchanges in general. In contrast, we nd thattrades on ECNs are more informed than trades with market makers. On Nasdaq,the market makers’ preferencing and internalization agreements allow them toretain the less-informed retail orders. Because ECNs match customer orderswithout participating in the trades, the more informed orders spill onto theECNs.ECNs are open limit order books that create a hybrid dealer/auction market onNasdaq. Thus, our results are related to the literature on limit order books andautomated markets. For example, Domowitz and Wang (1994) study the distributions of price and the dynamics of a limit order book for exogenous order submission strategies. Glosten (1994) examines the optimal prices schedule bycompeting liquidity suppliers in multiple markets and Parlour and Seppi (2003)study competition between a specialist/limit order market and a pure limit ordermarket. Examples of empirical analyses of limit order books include Coppejans,Domowitz, and Madhavan’s (2001) investigation of the dynamics of liquidity provision in an electronic limit order futures market and Holli eld, Miller, and Sand s’ (2001) estimation of the asset valuation implied by liquidity suppliers’ orderplacements and executions.Several previous papers have examined the e¡ect of ECN quotes. For example,Barclay et al. (1999) analyze the impact of Nasdaq’s new order-handling rules andshow that ECN quotes play an important role in reducing trading costs. Simaan,Weaver, and Whitcomb (2003) show that ECN quotes are more likely to be on anodd tick than market-maker quotes and how quote anonymity a¡ects marketmakers’quotes. Huang (2002) nds that ECN quote updates are more informativethan market-maker quote updates. Because these studies focus on quotes ratherthan on trades, however, they are unable to examine the role of ECN trading inthe price discovery process or determine the venue in which informed traderschoose to trade. This paper is the rst to use comprehensive data to examine
Competition among TradingVenues2641trading on ECNs.3 By examining ECN trades in addition to ECN quotes, we areable to focus on the demanders of liquidity, rather than on the suppliers of liquidity. We also are able to calculate more direct measures of market performancesuch as e¡ective and realized spreads, price improvement, and the permanentprice impact of trades.The paper proceeds as follows. Section I provides an overview of ECNs. SectionII describes our data. Section III examines investors’ choices of trading venues.Section IV investigates the price discovery process and provides evidence thatmore informed trades occur on ECNs. Section V compares the cost of ECN andmarket-maker trades. Section VI concludes.I. An Overview of ECNsThe SEC de nes ECNs as ‘‘electronic trading systems that automatically matchbuy and sell orders at speci ed prices’’ (http://www.sec.gov/answers/ecn.htm) anddescribes ECNs as having ‘‘become integral to the modern securities markets’’(U.S. Securities and Exchange Commission (2000), Part II, Section I.A). In August 2002, ECNs accounted for approximately 38% of total share volume and41% of the dollar volume traded in Nasdaq securities. ECNs accounted for approximately 3% of total share and dollar volume in listed securities. In contrast,in 1993 ECNs accounted for only 13% of share volume in Nasdaq securities andonly 1.4% of listed share volume (U.S. Securities and Exchange Commission(2000)).Competing ECNs o¡er di¡erent fee structures and levels of service and caterto di¡erent investor clienteles. However, all ECNs provide the same basic transaction services. ECN subscribers submit limit orders that are posted on the system for other subscribers to view. The ECN then matches contra-side orders forexecution. In most cases, the buyer and seller remain anonymous, as the tradeexecution reports list only the ECN as the contra-side party. Subscribers mayuse additional features of the ECN, such as negotiation or reserve size, and mayhave access to the entire ECN order book that contains important real-time information about the depth of trading interest.When ECNs rst developed, they served primarily as private trading vehiclesfor institutional investors and broker-dealers. The prices posted on ECNs bythese professional traders often were better than the prices posted on Nasdaq.Because the ECNs were not integrated into the Nasdaq market, many investors,particularly retail investors, traded at prices inferior to those displayed by market makers and other subscribers on ECNs. Essentially this created a two-tiered3In the cross section, Hasbrouck and Saar (2001) examine volatility’s impact on limit orderson Island. Biais, Bisiere, and Spatt (2002) study quote competition between Nasdaq and Islandand the pro tability of limit order strategies. Conrad, Johnson, and Wahal (2002) comparetrading costs for institutional trades on crossing networks and Instinet to those with traditional brokers. Weston (2001) uses ECNs’ monthly activity to examine their evolving competitive role in Nasdaq.
2642The Journal of FinancemarketFthe traditional public market, and the new ECN market with betterprices and limited access.In 1996, the SEC adopted new order-handling rules to integrate these markets.Before the adoption of the order-handling rules, market makers could post quotesin private ECNs that were better than the quotes they posted in the public market.This allowed market makers to segment their market, charging higher pricesto retail customers and lower prices to more price-sensitive institutional investors. Under the new order-handling rules, market makers and specialists wererequired to re ect in their public quote any better prices that they placed on anECN. The new order-handling rules had a large and immediate impact on thesecurities marketsFtrading costs fell dramatically, resulting in signi cant costsavings for investors (Barclay et al. (1999)).Today, almost any investor can trade through an ECN, including retail investors, institutional investors, market makers, and broker-dealers. The recent proliferation of new electronic markets led the SEC to consider how to incorporatethese trading venues into the national market system. In December 1998, the SECadopted Regulation ATS to establish a regulatory framework for alternativetrading systems to more fully integrate them into the national market system.The goals of Regulation ATS were to provide investors with access to the bestprices, provide a complete audit trail and surveillance on alternative trading systems, and reduce the potential for market disruption due to system outages.Once ECNs were fully integrated into the Nasdaq market, investors had todecide whether and when to utilize them. ECNs o¡er several potential bene tsto investors. First, ECNs typically o¡er an advantage in the speed of execution.Traditional orders are sent rst to a broker, either electronically or over thephone, who determines the market where they will be sent for execution. Thereare no SEC regulations concerning the time required to complete this task.Although trade executions are usually seamless and quick, they do take time. Infast-moving markets, investors using traditional brokers will not always receivethe price they see on their computer screen or the price their broker quotes overthe phone. By the time their orders reach the market, the price of the stock couldbe slightlyFor veryFdi¡erent.The immediate execution o¡ered by ECNs is oneof their major selling points.4 Immediate execution and anonymity are closelyrelated and both appeal to those investors who may have short-lived informationabout future price changes.Second, ECNs sometimes o¡er better prices than Nasdaq’s National Best Bidand O¡er (NBBO) because they use ner tick sizes and because not all ECNquotes are displayed in the Nasdaq NBBO. In the Nasdaq quote montage, ECNquotes are rounded to the nearest Nasdaq tick, but ECN trade prices are not.54Some market makers, such as Knight Securities, o¡er automated execution that is as fastas ECNs and the price is guaranteed, whereas the limit order on the ECN may disappearbefore the trade can be executed.5E¡ective June 3, 1997, Nasdaq moved to a tick of 1/16 for stocks with a bid price of 10 ormore, implying that ECN quotes are rounded to the nearest 1/16 of a dollar. Decimalization onNasdaq will reduce rounding, but will not eliminate it because some ECNs already utilize atick of less than one cent.
Competition among TradingVenues2643Thus, trades may occur on an ECN at a fraction of a tick below the NBBO. Inaddition, non-market makers (and ECNs with less than 5% of the volume in astock) may choose to have their orders displayed only on the ECN and not included in the NBBO. Such limit orders can execute only against orders originating on the same ECN.The potential bene ts of trading on an ECN must be weighed against the costs.ECNs charge fees for their services that are paid directly by subscribers and indirectly by nonsubscribers.6 In addition, market makers sometimes execute orders at prices better than the NBBO. This practice, known as price improvement, is one dimension on which market makers compete with each other.7 Inaddition, market makers sometimes execute orders larger than the inside quoteddepth, a practice referred to as size enhancement or size improvement. Finally,institutional trading arrangements on Nasdaq, such as preferencing and internalization, a¡ect the ECNs’ ability to attract orders and may allow market makersto retain order ow with more desirable characteristics.Institutional investors and broker-dealers who subscribe to an ECN can placeorders directly with the ECN. These traders may make dynamic choices to routean order to an ECN or to a market maker based on current market conditions. Forexample, best execution (see Macey and O’Hara (1997) for a more detailed discussion of best execution rules) does not require market makers to match therounded or nondisplayed quotes on an ECN. Thus, customers may go directly tothe ECN to get these better prices. If a subscriber sends a marketable order to anECN and the ECN is not currently posting the best bid or o¡er, then the ECN maysend the order to another market for execution. But brokers choosing to routeorders to ECNs, not the ECNs themselves, are responsible for meeting the bestexecution requirements.Individual investors can access an ECN through their broker. Some individual investors choose a particular broker expressly because that brokerroutes their orders to a speci c ECN. Other individual investors may or maynot be aware of the market to which their broker routes their orders. Marketmakers can also route customer orders to an ECN. Market orders can berouted to an ECN when the ECN is posting the best bid or o¡er, and the marketmaker does not want to match that price. Limit orders submitted to a marketmaker can also be routed to an ECN in accordance with the new order-handlingrules.6For subscribers these fees include a xed component, the cost of purchasing the ECNterminal and line feed, and a per-share fee for execution. For nonsubscribers an access feeof 0.25 to 2 cents per share is charged for orders that execute against a standing ECN order.During our sample period, this fee was paid by the intermediary routing the order to the ECNand was not charged directly to investors.7Because not all ECN orders are displayed in the NBBO, ECN trades sometimes occur atprices better than the NBBO. However, because ECNs simply match orders to buy with ordersto sell, generally there is no opportunity for price improvement beyond the unrounded or undisplayed quote on an ECN.
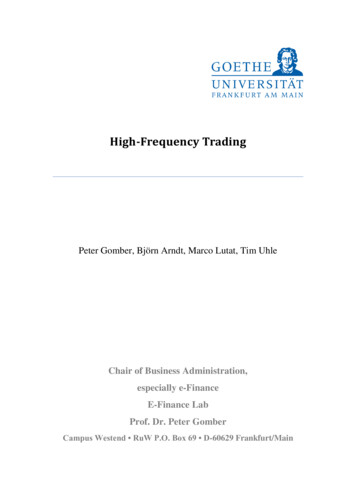
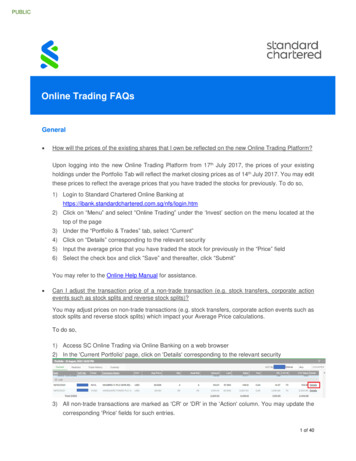
2644The Journal of FinanceII. Data and Descriptive StatisticsOur data contains all of the trades and quotes for 150 Nasdaq National Marketstocks during the normal trading hours from 9:30 a.m. to 4:00 p.m. in June 2000.The 150 stocks in our sample include the 50 highest dollar-volume stocks (highvolume), stocks with dollar-volume ranks from 501 to 550 (medium-volume), andstocks with dollar-volume ranks from 1,001 to 1,050 (low-volume).The data includealmost 19 million trades for 825 billion and a similar number of quote revisions.The bulk of our analysis uses data obtained from detailed trade, quote, andclearing databases maintained by Nasdaq.The data identify the unrounded tradeprice and volume, and include a number of unique features that allow us to accurately classify trades by venue.The trading venue is de ned as ECN if the trade isexecuted by an ECN or routed to or from an ECN for execution. All other tradesare classi ed as market-maker trades.8 The ECNs included in the analysis areArchipelago, Attain, Bloomberg TradeBook, Brass Utility LLC, Instinet, Island,Market XT, NexTrade, Redibook, and Strike Technologies LLC. A dummy variable, ecn, is set equal to one for trades that occurred on an ECN.We also classify trades by size and construct dummy variables, size1, size2, andsize3, that are set equal to one for trades that are small (1,000 shares or less),medium (1,001 to 9,999 shares), or large (10,000 shares or more), respectively. Thedummy variables ecn1, ecn2, and ecn3 are equal to the trade-size dummies interacted with the ECN dummy. To examine the importance of smaller tick sizes,frac1, frac2, and frac3 are the trade-size dummies interacted with a dummy variable that is set equal to one if the trade price is not divisible by 1/16, and ecnfrac1,ecnfrac2, and ecnfrac3 are these variables interacted with the ECN dummy.Using the Lee and Ready (1991) algorithm, trades are classi ed as buyer initiated ifthe trade price is greater than the quote midpoint, and seller initiated if the tradeprice is less than the quote midpoint.9 Trades executed at the midpoint are classi edwith the tick rule: Midpoint trades on an up-tick are classi ed as buyer initiated, andmidpoint trades on a downtick are classi ed as seller initiated.We represent the buy/sell indicator with the variable x ¼ þ 1 for a buy order and x ¼ 1 for a sell order.Table I provides descriptive statistics for the stocks in our sample by volumecategory. Not surprisingly, the highest volume category has the highest averagemarket capitalization, trade size, and price per share, as well as a lower average quoted spread and more market makers.10 Average trading volume in the8For con dentiality reasons, Nasdaq would not identify trades by individual ECN. Clearingdata is used to determine whether the trade involved an ECN and to correct for any missingdata in the trade database. Additional details on this process are available from the authors.9Trades are matched with quotes using execution times and the following algorithm thathas been found to perform well for the Nasdaq market. For SelectNet, SOES, and ACEStrades, we match the trade with the inside quote 1 second or more before the trade executiontime. Because SelectNet, SOES, and ACES are electronic trading systems run by Nasdaq, theexecution times are very reliable. For other trades, we match the trade with the inside quote 3seconds or more before the trade report time.10On a daily basis, we identify market makers in each security from the individual marketparticipant quote data. Any rm that has at least one valid quote during the day is classi edas a market maker in that security.
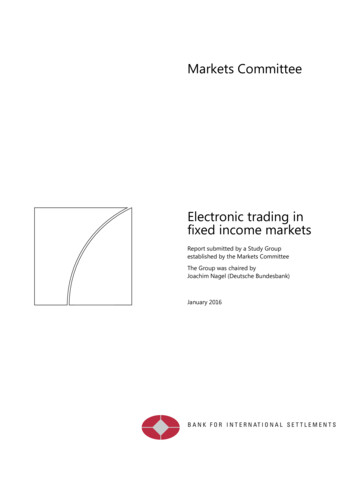
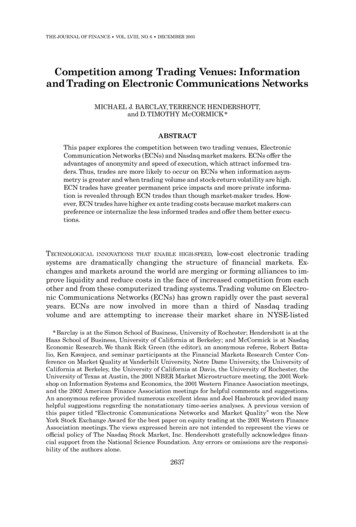
Competition among TradingVenues2645Table ISample Descriptive StatisticsDescriptive statistics for 150 Nasdaq National Market Stocks in June 2000. Volume categoriesare determined by ranking all rms traded on the Nasdaq National Market by total dollar trading volume in June 2000. The categories are de ned as high volume (ranks 1 to 50), medium volume (ranks 501 to 550), and low volume (ranks 1,001 to 1,050). Quoted depth is the average of theaggregate size of all inside bid quotes and all inside ask quotes in round lots. Descriptive statistics are calculated for each security and then averaged across securities.Volume CategoriesVariableHighMediumLowAllDaily trading volume ( million)Market cap ( billion)Average trade size ( 000)Share priceDaily return std. dev. (%)Quoted half-spread (basis points)Quoted depth (00)Number of marker makersDollar ECN volume 28.2315.3729.7330%high-volume stocks is 60 times larger than trading volume in the medium-volumestocks, and more than 200 times larger than trading volume in the low-volumestocks. Stock-return volatility is also slightly higher for the high-volume stocks,although volatility has little variation across the volume categories. Finally, 30%of the trading volume in our sample occurs on an ECN.The percentage of tradingon an ECN declines from 39% in the high-volume category to 23% in the lowvolume category.11Table II shows the percentage of dollar volume that occurs on ECNs by volumecategory and trade size. ECN trades are smaller, on average, than market-makertrades. For the high-volume stocks, 51% of the small-trade volume occurs onECNs. This percentage declines to 21% for medium-size trades, and to only 2%for large trades. The lower-volume stocks exhibit the same inverse relation between trade size and ECN volume. However these lower-volume stocks have fewerECN trades in all trade-size categories.The percentage of small trades occurringon an ECN is 34% for the medium-volume stocks and 26% for the low-volumestocks. Relatively few medium and large trades occur on ECNs in the mediumand low-volume categories. The percentage of dollar volume occurring on ECNsis generally lower than the percentage of trades, particularly for the large tradeswhere about 2% of the dollar volume occurs on ECNs in all dollar volumecategories.11The positive association between normal trading volume and the fraction of volume on anECN is evidence of a liquidity externality (Mendelson (1982) and others).
2646The Journal of FinanceTable IIPercentage Dollar Volume on ECNs by Volume Category and Trade SizeTrades are classi ed as ECN if either the buyer or seller submitted its order through an ECN.Volume categories are determined by ranking all rms traded on the Nasdaq National Marketby total dollar trading volume in June 2000. The categories are de ned as high volume (ranks 1to 50), medium volume (ranks 501 to 550), and low volume (ranks 1,001 to 1,050). Trade-size categories are based on number of shares traded. Percentage dollar volume on ECNs is calculatedstock by stock and then averaged across stocks.Volume CategoriesTrade-Size CategoriesHighMediumLowAll1 1,0001,001 9,99910,000 .0%1.6%23.1%37.1%16.1%2.1%29.6%III. The Choice of Trading on ECNs or with Market MakersThis paper explores the competition for order ow across venues that have different market designs and that o¡er di¡erent advantages and services to theirpotential customers. As a rst step, this section explores the market conditionsunder which trades are most likely to occur on an ECN. Estimating a probitregression for the choice
other and from these computerized trading systems.Trading volume on Electro-nic Communications Networks (ECNs) has grown rapidly over the past several years. ECNs are now involved in more than a third of Nasdaq trading volume and are attempting to increase their market share in NYSE-listed THE JOURNAL OF FINANCE VOL. LVIII, NO.6 DECEMBER 2003