Transcription
https://doi.org/10.24095/hpcdp.37.10.04Exploring sales data during a healthy corner storeintervention in Toronto: the Food Retail EnvironmentsShaping Health (FRESH) projectLeia M. Minaker, PhD (1); Meghan Lynch, PhD (2); Brian E. Cook, PhD (3); Catherine L. Mah, MD, PhD (2,4)This article has been peer reviewed.Tweet this articleAbstractIntroduction: Population health interventions in the retail food environment, such ascorner store interventions, aim to influence the kind of cues consumers receive so thatthey are more often directed toward healthier options. Research that addresses financialaspects of retail interventions, particularly using outcome measures such as store salesthat are central to retail decision making, is limited. This study explored store sales overtime and across product categories during a healthy corner store intervention in a lowincome neighbourhood in Toronto, Ontario.Methods: Sales data (from August 2014 to April 2015) were aggregated by product category and by day. We used Microsoft Excel pivot tables to summarize and visually present sales data. We conducted t-tests to examine differences in product category sales by“peak” versus “nonpeak” sales days.Results: Overall store sales peaked on the days at the end of each month, aligned withthe issuing of social assistance payments. Revenue spikes on peak sales days weredriven predominantly by transit pass sales. On peak sales days, mean sales of nonnutritious snacks and cigarettes were marginally higher than on other days of the month.Finally, creative strategies to increase sales of fresh vegetables and fruits seemed tosubstantially increase revenue from these product categories.Conclusion: Store sales data is an important store-level metric of food environmentintervention success. Furthermore, data-driven decision making by retailers can beimportant for tailoring interventions. Future interventions and research should considerpartnerships and additional success metrics for retail food environment interventions indiverse Canadian contexts.Keywords: retail food environment, population health intervention, sales data, conven ience storesIntroductionRetail food environment interventions instores (e.g. grocery store and corner storeinterventions) are increasingly recognizedas important public health interventionsto improve the nutritional quality of foodpurchases.1-4 Such interventions aim tosupport healthier dietary behaviours byimproving access to and availability ofaffordable, nutritious food options in thecommunity and consumer nutrition environments.5,6 Food stores are especiallyimportant sites for healthy eating interventions, since over 70 cents of everyhousehold food dollar is spent in stores(as opposed to restaurants).7Food sales data have been proposed as val uable, objective, cost-efficient and unobtrusiveHighlights Public health practitioners interested in retail food environmentinterventions can use sales data toinform comprehensive evaluations. Sales data can be used to tailorhealthy corner store interventions tothe local context (for example, special promotions on peak sales days). Using sales data is important forresearch and also for store owners,who can use sales data metrics toinform their own business practices.measures of diet-related behaviour thatplace no burden on individual participants.8 Store sales data (e.g. directly collected checkout scanner data, commerciallyavailable data sets and grocery receipts)have been used to monitor the effectiveness of interventions in a variety of typesof retail food stores,9-12 including a numberof recent small-store studies.13-17 Together,these studies suggest that sales data canactually be used in the design of retailfood interventions. For example, Fosterand colleagues9 found that low-cost strategies focussed on improving product availability and placement enhanced sales ofsome foods and beverage categories (milk,water, frozen meals) but not others (regular soda, diet soda, cereal).A recent systematic review of the effectiveness of supermarket interventionsaimed at improving the healthiness ofconsumer purchases found that of 49 relevant studies identified, none reported onthe economic or financial effects of theAuthor references:1. School of Planning, University of Waterloo, Waterloo, Ontario, Canada2. Dalla Lana School of Public Health, University of Toronto, Toronto, Ontario, Canada3. Toronto Food Strategy, Toronto Public Health, Toronto, Ontario, Canada4. Faculty of Health, Dalhousie University, Halifax, Nova Scotia, CanadaCorrespondence: Leia M. Minaker, School of Planning, University of Waterloo, 200 University Ave., W., Waterloo, ON N2L3G1; Tel: 519-888-4567 ext. 35615;Email: lminaker@uwaterloo.caHealth Promotion and Chronic Disease Prevention in CanadaResearch, Policy and Practice342Vol 37, No 10, October 2017
intervention on the retailer.4 A 2012 narrative review of grocery marketing strategiesaimed at improving diet found that only 5of 125 reviewed studies used sales data toevaluate impacts of diverse strategies.3Another 2012 review that examined impactsof retail interventions in small food storesfound the majority of studies (11 of 16evaluations) did not analyze sales data.2Only a few studies have used sales data toassess retail performance of the store asthe primary outcome of interest.18 Thereare many reasons why previous researchhas not used sales data, including thepotentially sensitive nature of the data,and its poor quality due to human error ortechnological barriers. However, the lackof published sales outcomes remains asignificant gap in this body of research,because even if well-designed retail foodenvironment interventions can successfully improve dietary behaviours in thepopulation, the population-level impactwill not be sustained unless the intervention’s effects align with retailers’ economic goals.Given the importance of economic data todecision making in retail settings, treatingsales data as an important metric in retailfood environment intervention evaluationis crucial for both implementation andintervention sustainability.4 Within theretail sector, smaller stores have reducedcapacity to engage in data-driven decisionmaking. Evaluating sales may increase thepotential to promote healthy retailinginterventions among a diversity of foodretailers,19 especially given store ownerconcerns about potential revenue loss.20,21Indeed, lack of sales data from previousstudies may act as a barrier to other storesadopting healthy food interventions. Inaddition to retailers, this type of information is also important for legislators whoare considering how to craft policies tosupport healthy food environments inCanadian jurisdictions.22The objective of the current study was tocharacterize store sales over time over thecourse of a healthy food retailing intervention in a low-income, urban neighbourhood. We examined food and beveragesales, as well as sales in several nonfoodproduct categories. We present nonfoodproduct category sales in this article toprovide context in terms of potential risksand opportunities small retailers facewhen they implement a healthy food retailintervention.Vol 37, No 10, October 2017MethodsThe Food Retail Environments ShapingHealth (FRESH) study was funded by thePublic Health Agency of Canada, led byToronto Food Strategy (an initiative ofToronto Public Health) and collected datafrom August 2014 to April 2015. TheFRESH study used mixed methods toassess individual-level dietary and foodsecurity impacts of a pilot healthy cornerstore intervention and a mobile good foodmarket intervention (a retrofitted city busthat distributed and sold fresh vegetablesand fruits to neighbourhoods with lowgrocery store access) in two low-incomeneighbourhoods in Toronto, Ontario. Thisarticle reports on sales data from the corner store that participated in the healthycorner store intervention. Unfortunately,sales data from the mobile good food market were of poor quality and thereforeunreportable.SettingThe neighbourhood in which the intervention corner store was situated was inScarborough East – Ward 43 in Toronto,Ontario, a ward in which 42% of residentslive in apartment buildings with morethan five stories, 52% of residents wereborn outside of Canada, 57% of residentsspeak English as a first language and average annual household income is roughly 20 000 less than the Toronto average.23,24The intervention corner store was situatedin the heart of Scarborough East, on themain floor of an apartment tower complex. The site was identified by TorontoFood Strategy in partnership with EastScarborough Storefront, a community organ ization aiming to support people andbuild community in Scarborough East. Weapproached storeowners to participate,and they became active participants in allintervention decisions and in sales datacollection. Unpublished data from thebroader FRESH study (which includedsurveys with n 199 residents who wereprimary food shoppers and lived in theintervention apartment tower) showedthat among residents of the apartmenttower complex in which the store waslocated, 83.3% were born outside Canada,69% had at least one child and 78% hadannual household incomes below 30 000.InterventionThe transformation of the conveniencestore pilot site was an iterative process343encompassing (1) business fundamentals,including food procurement, infrastructure and sales analytics; (2) customer service and engagement; and (3) variousmerchandising strategies. Key goals of theintervention were to improve supplierrelationships and merchandising toincrease availability and prominence ofnutritious foods and beverages. In thisintervention, “nutritious foods and beverages” were considered those that alignedwith Canada’s Food Guide recommendations. In collaboration with public healthdietitians from Toronto Public Health andwith the store owners, we identified specific nutritious foods and beverages to besold (e.g. fresh whole fruits and vegetables, water, popcorn, low-sugar granolabars, snack packs of vegetables). Weintroduced and promoted nutritious foodsover the course of the intervention.Nutritious items were priced competitively with comparable products at thenearby discount supermarket (approximately 1 km away). The initial recruitment of the corner store took place inDecember 2013; the infrastructure changesto support the sale of fresh produce, suchas purchasing and installing new refrigeration units and changes to existing shelving, happened between June 2014 andFebruary 2015; and fresh produce beganto be offered for sale in June 2014.To increase the store’s year-round freshfruit and vegetable supply, Toronto FoodStrategy connected store owners with aToronto-based fruit and vegetable distributor. Toronto Food Strategy helped storeowners open an account, and trainedthem in the ordering process. The storeowners also procured fruits and vegetables from a nearby local Asian supermarket. Members of the research team visitedthe store between one and three times perweek throughout the intervention to provide ongoing support, including trainingon sales data collection through the pointof-sale (POS) system (described below).Of relevance to this study was the factthat the apartment tower’s residentiallandlord company had its own ongoingfree snack program available every schoolday to all children living in the apartmenttower. Every week, the landlords purchased fresh produce for the snack program from a nearby warehouse-style clubstore to distribute to school children. InNovember 2014, the store owners successfully negotiated with the landlords toHealth Promotion and Chronic Disease Prevention in CanadaResearch, Policy and Practice
begin supplying the fresh produce for thesnack program at the same price.of sales data using graphing features inMicrosoft Excel.sales (p .0001) were significantly higheron peak than on nonpeak days.Several challenges to consistent implementation emerged throughout the intervention, including making improvementsto general business operations, engagingstore owners in considering data quality,building capacity in data-driven retaildecision making, creating merchandisingstrategies, establishing links with the community, and negotiating complex relationships between the store owners andregular customers. These challenges areconsistent with those observed in otherhealthy corner store intervention contexts.20First, we summarized total store sales byday and plotted the data on a graph overtime to visually inspect the consistency ofstore sales over time. Preliminary findingssuggested that store sales appeared tospike on certain days of the month, whichwe refer to as “peak” sales days throughout the remainder of this paper. Furtherinvestigation revealed that peak sales daysconsistently occurred the day after socialassistance payments were issued. Weexamined daily sales of products in different categories by “peak” versus “nonpeak” sales days, and created two-tailedt-tests with unequal variances to examinewhether product category sales differedsignificantly by “peak” and “nonpeak”days; p .05 was considered statisticallysignificant.Figure 3 shows monthly revenue generated from four product categories overtime: fresh produce, snacks (includingcandy, chocolate, potato chips and othersalty snacks and meat snacks), sweetenedbeverages and cigarettes. Throughout thecourse of the intervention, revenue fromcigarettes was high. Revenue from freshproduce went from 165 in August 2014 toover 1000 per month for the months ofJanuary to April 2015. Revenue generatedfrom fresh produce overtook revenue ofsweetened beverages and snacks inJanuary 2015, but fell slightly belowsweetened beverage and snack revenue inMarch and April 2015.MeasuresWe collected sales data through a POS system. The POS system was installed inJanuary 2014, and tracked the date andtime of sale, UPC code, researcher-programmed product category (e.g. sweetened beverage, bottled water, candy, fruit,vegetable, lottery tickets, cigarettes, etc.),quantity purchased and item price. Acompany that specializes in digital marketing inside convenience stores supported the project by providing the POSequipment, installation, maintenance andtraining at no cost. The company tracksadvertising effectiveness in the cornerstores with which they work, and agreedto advertise only nutritious foods and beverages throughout the project. Theresearch team was able to request updatedsales data on a regular basis from the POSprovider throughout the project. Althoughthe POS system was installed in January2014, it took several months for reliabledata to become available, and to buildpractical capacity in data managementand use of the POS system on the part ofthe store owners. Data presented heretherefore have been restricted to the consistently higher quality data obtained fromAugust 2014 to April 2015, the last monthfor which data were available. In addition,we restricted our analyses to revenue(overall store sales generated by retailitems) rather than profits (revenue lessexpenses), since comprehensive data onexpenses were not collected.AnalysisWe aggregated sales data by product category and by day to examine store salesover time. We used pivot tables to organize and summarize data in MicrosoftExcel. We also created visual representationsHealth Promotion and Chronic Disease Prevention in CanadaResearch, Policy and PracticeSecond, we graphically displayed monthlyrevenue generated by different productcategories over time. The sale of fruits andvegetables (as one of the main components of the intervention) was also examined visually over time. Given the storeowners’ negotiation with the landlords tosupply fresh produce for the free snackprogram in November 2014 (describedearlier), we present fruit and vegetablesales data with and without snack program sales to provide an accurate representation of fruit and vegetable sales toregular customers.ResultsFigure 1 shows the total daily sales(excluding lottery sales) of the pilot intervention corner store between August 2014and April 2015. Figure 2 shows mean dailysales of different product categories soldduring the peak sales days and the nonpeak sales days. During both peak andnonpeak sales days, transit passes andtickets, lottery tickets and cigarettesaccounted for the highest overall sales. Onpeak sales days, mean daily sales of cigarettes were marginally significantly higherthan nonpeak days ( 175.73 for peaksales days compared to 130.09 for nonpeak sales days, p .084). Mean sales ofnonnutritious snacks and beverages werealso marginally higher on peak days( 85.04 for snacks and 74.34 for beverages per day) than on nonpeak days( 61.67 for snacks [p .078] and 56.39for beverages [p .145] per day). Lotterysales (p .023) and public transit ticket344Finally, monthly gross revenue from fruitsand vegetables by overall revenue and byrevenue generated from individual consumer sales (i.e. excluding fruit and vegetable sales to the landlord) are presentedin Figure 4. On average, the store generated approximately 935 in revenue fromfresh produce per month over the sixmonths that landlords purchased fruitthrough the intervention store.DiscussionThis exploratory study described the characteristics of sales data from a corner storeparticipating in a government-led healthycorner store intervention in a low-incomeapartment tower neighbourhood inToronto, Ontario. The data presented areamong the first sales data to be examinedin a study of retail food environmentinterventions in a Canadian context,10,19and the first sales data to be examined ina healthy corner store intervention inCanada. This study does not make claimsabout consumer-level impacts but moresimply aims to characterize store revenuegenerated over the course of an intervention, along with potential interpretationsof sales trends in relation to the urbansmall-store retailing context.This study contributes three key findingsrelevant for research and public healthpractice in Canada. First, interventionstore sales peaked at predictable timeintervals (the day after social assistancecheques were issued). Furthermore, meansales of some product categories variedsignificantly between these peak salesdays and the other days of the month.Second, intervention store sales capturedVol 37, No 10, October 2017
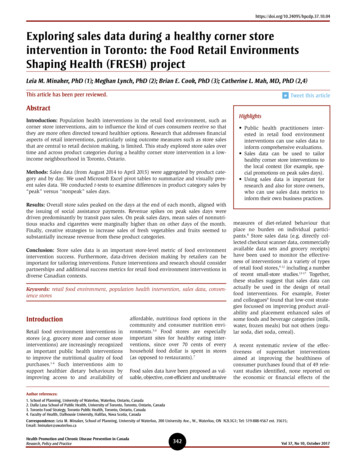
FIGURE 1Store total daily sales, excluding lottery sales, during a healthy corner store intervention in Toronto, Ontario, August 2014 to April 2015 2000 1800 1600 1400 1200 1000 800 600 400 200 0August 1, 2014September 1, 2014October 1, 2014longitudinal change in product mix overtime. Third, reporting, visualizing andassisting the store owners with interpreting sales promoted the concept of datadriven decision making, and seemed tocatalyze store owners’ willingness toincorporate new products such as freshfruits and vegetables.November 1, 2014December 1, 2014January 1, 2015February 1, 2015Each of these findings is addressed inmore detail below.March 1, 2015April 1, 2015for corner store interventions in similarneighbourhood contexts. Specifically,strategies to shift consumer purchasingbehaviours on peak sales days (whenstore traffic may be higher), including instore interventions, could be explored.The proportion of overall store sales fromlottery tickets, transit tickets, cigarettes andFirst, this is the first study, to our knowledge, to report how corner store salespeaked the day after social assistancecheques were issued in a low-income neigh bourhood. This finding has implicationsFIGURE 2Average daily sales for different product categories for peak (highest sales days) and nonpeak days during a healthycorner store intervention in Toronto, Ontario, August 2014 to April 2015Transit passes and ticketsLotteryCigarettesNon-nutritious snacksNon-nutritious beveragesBottled waterVegetables and fruitHousehold items 0 200 400 600Peak averageVol 37, No 10, October 2017345 800 1100 1200 1400Nonpeak averageHealth Promotion and Chronic Disease
ships between the store owners and regular customers. These challenges are consistent with those observed in other healthy corner store intervention contexts.20 sweetened beverages and snacks in Measures We collected sales data through a POS sys - tem. The POS syste