Transcription
AgriculturalMarketingServiceFebruary 2014Railroad Concentration, Market Shares, and RatesMarvin Prater Adam Sparger Daniel O’Neil, Jr.SummarySince the passage of the Staggers Act in 1980, many railroads have merged. The market share of Class I railroads hasincreased since then, while the number of Class I railroads has fallen to only seven. Through railroad mergers, rail-torail competition has been reduced, railroad market power has increased, and rail costs have fallen by over half in realterms. Over much of this period, most of these reduced costs were passed on to shippers as savings through lowerrates. Since 2004, however, average rail rates per ton-mile for all commodities have climbed 36 percent, negatingsome of the savings over the period. Although some of these real rail rate increases have contributed to record railprofitability and capital investment, most of the rate increases are the result of increased railroad costs; real rail costs,adjusted for productivity, increased 29 percent during the same period.Although deregulation of railroads in 1980 produced more than 550 regional and local railroads throughout America,the 7 Class I railroads originated well over half the grain and oilseed shipments in 2011.IntroductionFor many years, railroads have been merging in order to increase efficiency and develop financially stable railbusinesses large enough to compete with other modes of transportation, mostly trucks and barges. Following thepassage of the Staggers Rail Act of 1980,1 the pace of merger activity increased as railroads strove to reduce costs,increase efficiency, and increase the area they served, while eliminating unnecessary lines and enhancing theirmarket power.Railroad MergersSince the 1920s, railroads have undergone many mergers. During the 1960s and 1970s, many of the mergerscombined financially weak railroads with stronger firms in hopes of developing financially stable businesses largeenough to compete effectively with other transportation modes. After the Staggers Rail Act of 1980, the pace ofmerger activity picked up as railroads strove to increase geographic range, eliminate duplicate lines, reduce costs, andgain increased market power. In 1980, there were 33 Class I railroads in the United States; today there are only 7.1 E-94-Pg1895.pdf (PDF)1
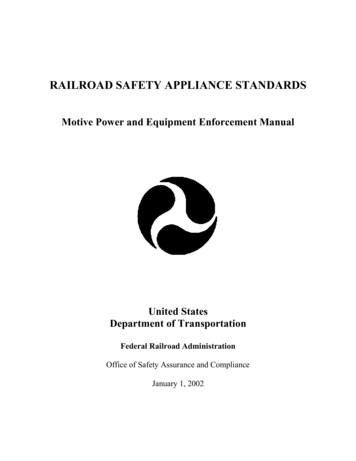
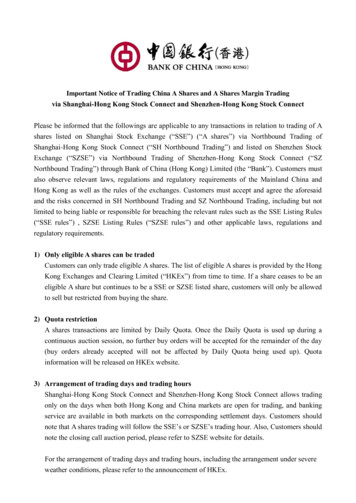
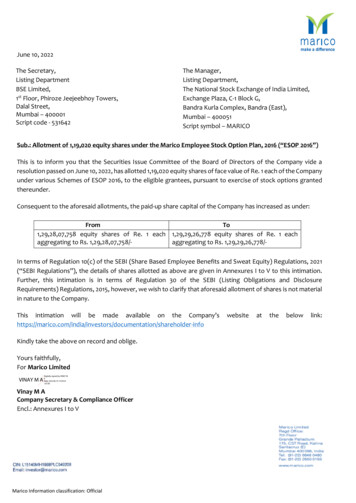
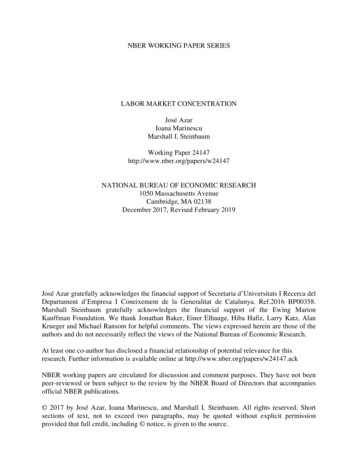
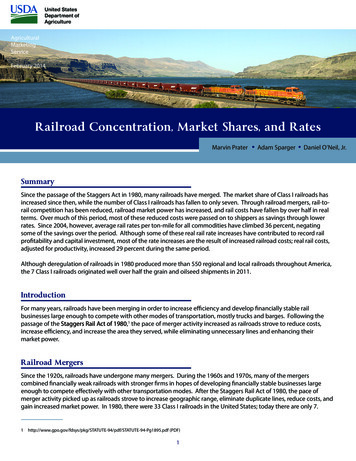
When the Staggers Act was enacted, many shippers did not foresee the extent of the loss of rail-to-rail competitionbecause of mergers and the resulting increase in market power of the railroads. Economists, however, anticipatedthe rationalization of the rail network because the regulated railroad industry was characterized by overcapacity,so a reduction in excess capacity was a logical and expected result of deregulation. The concentration of increasedtonnage on fewer track miles has enabled railroads to reap the benefits from economies of density, under which firmsgain cost savings from the density of traffic within their network. Studies have shown that rail rates have fallen 60percent in real terms—and that most of these savings have been passed on to shippers.2Today there are two major duopolies for grain transportation—BNSF Railway and Union Pacific Railroad serve theWestern United States, and CSX Transportation and Norfolk Southern serve the East. In addition to these four megarailroads, three smaller Class I railroads—Canadian National Railway, Canadian Pacific, and Kansas City SouthernRailway—serve the central portion of the Nation. In 2011, in addition to these Class I railroads, there were also 21regional and 539 local railroads. (Before the Staggers Act, there were about 220 regional and local railroads.)3 Seetable 1 for a summary of the Class I railroad mergers.Table 1. Railroad MergersPredecessor RailroadsMerged RailroadBurlington NorthernAtchison, Topeka, & Santa FeChicago & NorthwesternMissouri PacificSouthern PacificUnion PacificIllinois Central GulfConrail (58 percent)Norfolk & WesternSouthernConrail (42 percent)Louisville & NashvilleMilwaukeeSooBurlington Northern Santa Fe (BNSF)Union PacificCanadian National (U.S.)Norfolk SouthernCSX TransportationCanadian Pacific (U.S.)Market Concentration and ShareThe top four Class I railroads originated 86 percent of grain and oilseed traffic in 2011, compared to only 53 percent in1980 (figs. 1 and 2). In addition, the market share of the current railroads has changed from that of their predecessors.The Burlington Northern and the Atchison, Topeka & Santa Fe, which combined to form Burlington Northern SantaFe (BNSF), together accounted for only 30 percent of grain and oilseeds originations in 1980. By 2011, the BNSF had47 percent of the market. This market share growth contrasts with the 31 percent held by Chicago & Northwestern,Union Pacific, and Missouri Pacific in 1980 that combined into the Union Pacific (UP), which has decreased to only 19percent in 2011.2Surface Transportation Board, Study of Railroad Rates: 1985-2007, January 2009. oadRateStudy.pdf (PDF)3”Regional and Short Line Railroads in the United States,” Transportation Quarterly, Fall 2002.Web. Rail-Finance.pdf (PDF)2
Figure 1. Railroad Grain Origination Market Share, 1980Illinois Central Gulf6%Others12%Southern3%Norfolk & Western4%Burlington Northern19%Conrail4%Louisville & Nashville4%Milwaukee3%Soo3%Atchison, Topeka &Santa Fe11%Missouri Pacific8%Chicago & Northwestern12%Union Pacific11%Source: Association of American RailroadsFigure 2. Railroad Grain Origination Market Share, 2011Canadian National (U.S.)5%Kansas City Southern2%BNSF47%Norfolk Southern10%CSX Transportation10%Soo(Canadian Pacific U.S.)8%Union Pacific18%Source: Association of American Railroads3
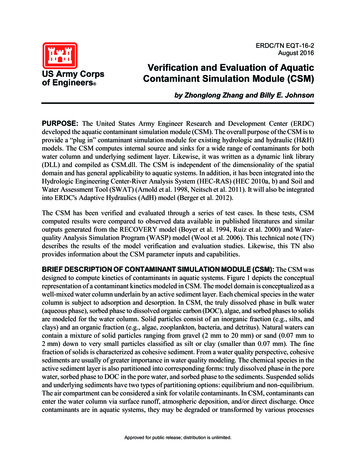
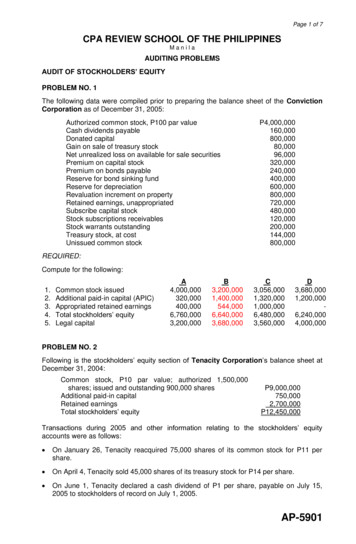
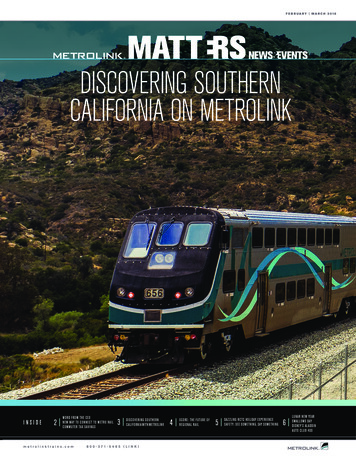
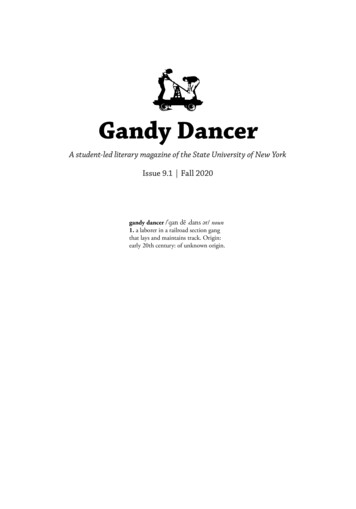
Railroad concentration and market share are even higher for specific commodities. For instance, the top four Class Irailroads transported 96 percent of wheat in 2011 compared to 80 percent in 19944 (see figs. 3 and 4). Over that time,the consolidation was unevenly distributed between the railroads. The market share for BNSF remained the same incomparison to its predecessors—55 percent in 2011 compared to 55 percent in 1994. The UP market share decreasedover the same timeframe; it had only 21 percent in 2011 compared to the 29 percent of its predecessors in 1994. TheSoo (Canadian Pacific U.S.) market share increased to 12 percent in 2011 from only 4 percent in 1994, while the CSXmarket share increased to 8 percent compared to only 4 percent for its predecessors.The level of rail-to-rail competition in agriculture should not be viewed as a function of the market concentrationof railroads in the Nation as a whole. Instead, it is a function of the quality and effectiveness of competitive optionsin particular markets. Regional markets are especially important when reviewing agricultural transportation ascompared with other products because farming can only happen in certain regions, most of them far away fromcost-effective inter-modal competition. Railroads compete not only with other railroads, but also with other modes oftransportation.Using a Herfindahl-Hirschman analysis of rail-to-rail competition applied to crop reporting districts, the U.S.Department of Agriculture (USDA) and the U.S. Department of Transportation (DOT) found that the level of railto-rail competition for grains and oilseeds decreased significantly between 1992 and 2007.5 Almost 75 percentof agricultural areas lost rail competition from 1992 to 2007, and the areas in which a railroad had a monopoly intransporting grain and oilseeds increased from 10 percent to 15 percent. At the same time, the revenue-to-variablecost ratio, a measure of railroad profitability, increased in 83 percent of those areas.Figure 3. Railroad Wheat Origination Market Share, 1994Kansas City Southern2%Canadian National (U.S.)1%Norfolk Southern4%Conrail2%CSX Transportation3%Burlington Northern41%Soo4%Southern Pacific4%Chicago & Northwestern4%Union Pacific21%Atchison, Topeka& Santa Fe14%Source: Association of American Railroads4Data for wheat is only available after 1994.5U.S. Department of Agriculture and U.S. Department of Transportation, Study of Rural Transportation Issues, April 2010. Chap. 6, 217–221. http://dx.doi.org/10.9752/TS041.04-2010 4
Figure 4. Railroad Wheat Origination Market Share, 2011Canadian National (U.S.)0%Kansas City Southern1%Norfolk Southern3%Burlington NorthernSanta Fe55%CSX Transportation8%Soo(Canadian Pacific U.S.)12%Union Pacific21%Source: Association of American RailroadsRail RatesRailroad mergers have resulted in reduced rail-to-rail competition and increased railroad market power. From 1980until 2004, railroads passed some of their reduced costs on to shippers through lower rail tariff rates.6 The index of railrates decreased from 100 in 1985 to 56.8 in 2004, a decrease of 43.2 percent in real (inflation adjusted) rail rates (seefig. 5). Rail capacity constraints first appeared in 2004, resulting in increased rail rates through 2007. The rail rate indexincreased to 65.5 in 2007, an increase of 15 percent in real rail rates in just 3 years. The Christensen report concludedthat these rate increases were due mainly to cost increases rather than market power.7Even though a recession started in December 2007, railroads continued to raise rail rates, partly to support recordrailroad capital investments and higher costs. Average real rail rates per ton-mile for all commodities increased 36percent between 2004 and 2011.8 Real rail costs adjusted for railroad productivity increased 29 percent during thesame period (see table 2). This indicates that most of the increase in rail rates was due to increased rail cost, but theincreased rail rates also contributed to record rail profits. In comparison, real truck rates have increased 27 percentsince 2004 (see fig. 6).6Surface Transportation Board, Study of Railroad Rates:1985-2007, January 2009. oadRateStudy.pdf (PDF).7Laurits R. Christensen Associates, Inc., A Study of Competition in the U.S. Freight Railroad Industry and Analysis of Proposals That Might Enhance Competition,November, 2008. dy.html .8Association of American Railroads, Railroad Ten-Year Trends, 2001-2010, pg. 50.5
Figure 5. Rail rate index, 1985–2007 (real revenue per ton-mile in 1985 100)100.0100.094.4Tornqvist rce: Surface Transportation BoardTable 2. Annual Rail Cost Adjustment Factor (RCAF) (Adjusted for productivity)(4Q 2002 100 for unadjusted RCAF)YearRCAF 0.56520080.65920090.55420100.61420110.665Source: Association of American Railroads Railroad Cost Indexes660.858.857.256.865.5
Figure 6. Index of for-hire truckload revenue per mile150146.9144.5141.5140136.7134.1131.0130Up 39 percent since : American Trucking Associations, Economics & Statistics Group, Trucking Activity ReportConclusionThe concentration of the remaining Class I railroads has increased since 1980, the year the Staggers Rail Act waspassed. The make-up of the railroad industry has changed dramatically by consolidations, mergers, and railabandonments. Through railroad mergers, the few remaining Class I railroads have established large market sharesof the rail grain transportation market, increased efficiency and market power, and reduced costs. Many of thesechanges have also benefitted shippers—particularly through reductions in real rail rates—up until about 2004. Sincethen, however, real rail rates per ton-mile have climbed 36 percent, while real productivity-adjusted rail costs haveincreased 29 percent. In comparison, real truckload rates have increased 27 percent since 2004.7
Page 1 photo credit: Dan SchwanzPreferred citation:Prater, Marvin E., Adam Sparger, and Daniel O’Neil, Jr. Railroad Concentration, Market Shares, and Rates. U.S.Department of Agriculture, Agricultural Marketing Service, February 2014. Web. http://dx.doi.org/10.9752/TS094.022014 For more information, contact Marvin.Prater@ams.usda.gov.The U.S. Department of Agriculture (USDA) prohibits discrimination against its customers. If you believe youexperienced discrimination when obtaining services from USDA, participating in a USDA program, or participatingin a program that receives financial assistance from USDA, you may file a complaint with USDA. Information abouthow to file a discrimination complaint is available from the Office of the Assistant Secretary for Civil Rights. To file acomplaint of discrimination, complete, sign and mail a program discrimination complaint form, available at any USDAoffice location or online at www.ascr.usda.gov, or write to: USDA, Office of the Assistant Secretary for Civil Rights,1400 Independence Avenue, S.W., Washington, D.C. 20250-9410. Or call toll free at (866) 632-9992 (voice) to obtainadditional information, the appropriate office or to request documents. Individuals who are deaf, hard of hearing orhave speech disabilities may contact USDA through the Federal Relay service at (800) 877-8339 or (800) 845-6136(in Spanish). USDA is an equal opportunity provider, employer and lender. Persons with disabilities who requirealternative means for communication of program information (e.g., Braille, large print, audiotape, etc.) should contactUSDA’s TARGET Center at (202) 720-2600 (voice and TDD).8
5 Rail Rates Railroad mergers have resulted in reduced rail-to-rail competition and increased railroad market power. From 1980 until 2004, railroads passed some of their reduced costs on to shippers through lower rail tariff rates.6 The index of rail rates decreased from 100 in 1985 to 56.8 in 2004, a decrease of 43.2 percent in real (inflation adjusted) rail rates (see