Transcription
MCAT Update2019 Regional Meetings,Reno, NV; Boston, MA; Louisville, KY 2019. May not be reproduced without permission.
What will we talk about today? How are admissions officers working with MCAT scores andundergraduate GPAs? How well do MCAT scores and undergraduate GPAs predictstudents’ performance in medical school? What do we know about recent test takers? How are examinees preparing for the MCAT exam? Q&A2 2019. May not be reproduced without permission.
This is the fifth year of the current version of the MCAT examExamineesApplicants/MatriculantsYear 1Year 01920193 2019. May not be reproduced without permission.Over 85,000examineestested in2018
Representatives from medical schools and pre-health programs areworking together to evaluate the current version of the MCAT exam4 2019. May not be reproduced without permission.
How are admissions officers workingwith MCAT scores and undergraduate GPAs?55 2019. May not be reproduced without permission.
Your admissions committees use holistic review to build classes that contributeto your schools’ missions, goals, and diversity interestsYou select students who will: Contribute to teaching and learning atyour school and to the practice ofmedicine Help balance the class across thecriteria needed by your school toachieve desired outcomes Help contribute to a diverse physicianworkforce6 2019. May not be reproduced without permission.
Admissions committees used holistic review practices to put MCAT scores andundergraduate GPAs in context in 2017 and 2018 selection77 2019. May not be reproduced without permission.
Some 2017 and 2018 applicants w/ high UGPAs and MCATscores weren’t accepted11% of applicantswith GPAs at orabove 3.8 andMCAT scores ator above 518 werenot admitted intoany medicalschools8 2019. May not be reproduced without permission.
Other 2017 and 2018 applicants with modest credentialswere accepted13% of applicantswith GPAs 3.00 3.19 andMCAT scores498-501 wereadmitted into atleast one medicalschool9 2019. May not be reproduced without permission.
Let’s see what we can learn about applicants at different MCATscore ranges10Lower Third(472 to 494)Middle Third(495 to 504)Upper Third(505 to 528) 2019. May not bereproduced withoutpermission.
Considering applicants with a wider range of scores gives your admissionscommittees more flexibility in building classes that meet your schools’missions, goals, and diversity interestsBackground characteristics of 2017-2018 applicants, by MCAT score 7%7%5%2%0%No parent withBachelor's degree11Parents in service,clerical, skilled,unskilled occupationsNon-native EnglishspeakerMiddle Third (495-504)Grew up in rural areaGrew up in medicallyunderserved areaUpper Third (505-528)Under-represented onrace/ethnicity 2019. May not be reproducedwithout permission.
Considering applicants with a wider range of scores gives your admissionscommittees more flexibility in building classes that meet your schools’missions, goals, and diversity interestsMany ofthese applicantsareon multiplecharacteristicsBackgroundcharacteristicsof diverse2017-2018 applicants,by MCATscore 7%7%5%2%0%No parent withBachelor's degree12Parents in service,clerical, skilled,unskilled occupationsNon-native EnglishspeakerMiddle Third (495-504)Grew up in rural areaGrew up in medicallyunderserved areaUpper Third (505-528)Under-represented onrace/ethnicity 2019. May not be reproducedwithout permission.
How well do MCAT scores and undergraduate GPAspredict students’ performance in medical school?1313 2019. May not be reproduced without permission.
We are presenting validity findings for five preclerkshipoutcomesPerformance OutcomeSummative Performance Across Preclerkship CoursesType of OutcomeContinuousSource ofOutcome Data16 Validity SchoolsStep 1 scores from the 1st AttemptContinuousNationalStep 1 scores from the Final AttemptContinuousNationalProgression to M2 On Time and within 1 Extra YearPass/FailNationalProgression to M3 On TimePass/FailNationalProgression to M3 within 1 Extra YearPass/FailNationalPassing the Step 1 Exam on the 1st AttemptPass/FailNationalPassing the Step 1 Exam EventuallyPass/FailNationalGraduate in 4 or 5 yearsPass/FailNational1414 2019. May 2019.not beMayreproducedwithoutpermission.not be reproducedwithoutpermission.
How Well Do MCAT Scores andUndergraduate GPAs Predict Performance onthe Continuous Outcomes?15 Summative Performance Across Preclerkship Courses Step 1 Scores (First Attempt) 2019. May not be reproduced without permission.
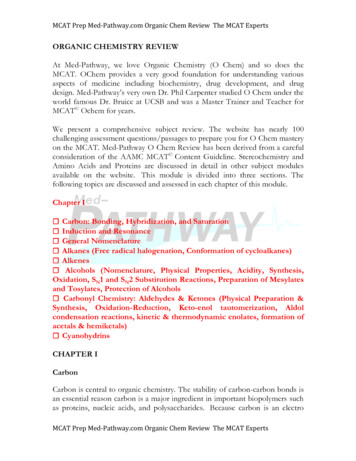
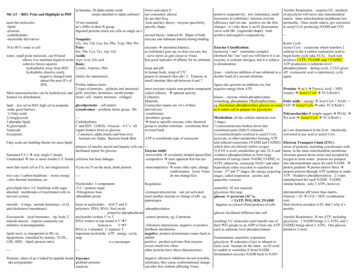
10090At this validity school, studentswith higher MCAT scoresperformed better inpreclerkship courses8070At every MCAT total score, some studentsperformed better than expected, and othersperformed less well6050 225245265280MedianMCAT total score:50816MCAT Total ScoreCorrectedcorrelation .81 2019. May not be reproduced without permission.
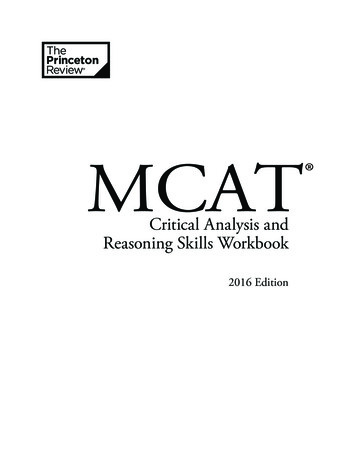
At the 16 validity schools, MCAT total scores show medium to large correlationswith 2016 entrants’ performance across preclerkship courses1.0Correlationof MCATTotalScorewith withCorrelationof Courses:Median and Interquartile Range (Nschool 16)Median and Interquartile Range (Nschool 16)0.60.8Correlation at the75th Correlation at the25th percentile17CONFIDENTIAL – DO NOT DISTRIBUTENotes:1. This figure was generated based on datafrom 2016 participants (N 953) at 16 validityschools that had 30 or more 2016participants with scores from the currentMCAT exam.2. Because more 2017 applicants to the validityschools had scores from the current examthan the 2016 applicants, the corrections forrange restriction were made using data fromthe 2017 admissions cycle.3. The horizontal line with a y-axis value at 0.3is the reference line for a medium association(Cohen, 1992).4. For students who took the MCAT exam morethan once, the most recent MCAT score atthe time of matriculation was used in thisanalysis.rEffect Size0.1Small 2019. May not be reproduced without permission. 0.30.5MediumLarge
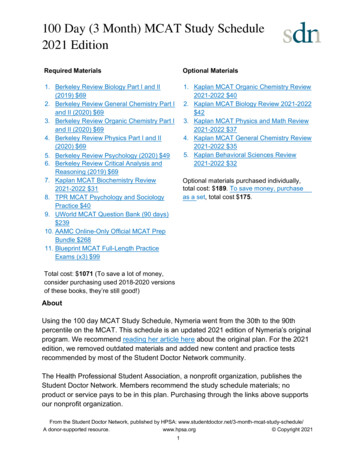
At the validity schools, MCAT scores and UGPAs predict 2016 entrants’ performance acrosspreclerkship courses. Combined, they predict better than either one alone0.60.81.0Correlations of Academic Metrics with Summative Performance across Preclerkship Courses:Median and Interquartile Range (N school 16)0.59 00.20.4 MCAT Total Scores only0.51 0.68Undergraduate GPAs only MediumEffectMCAT Total Scores Undergraduate GPAsNotes:1. This figure was generated based on data from 2016 participants (N 953) at 16 validity schools that had 30 or more students with scores from thecurrent MCAT exam.2. Because more 2017 applicants to the validity schools had scores from the current exam than the 2016 applicants, the corrections for rangerestriction were made using data from the 2017 admissions cycle.3. The horizontal line with a y-axis value at 0.3 is the reference line for a medium association (Cohen, 1992).4. For students who took the MCAT exam more than once, the most recent MCAT score at the time of matriculation was used in this analysis.18rEffect Size0.1Small0.3Medium 2019. May not be reproduced without permission. 0.5Large
280260240At this validity school, studentswith higher MCAT scoresperformed better on Step 1220200At every MCAT total score, some studentsperformed better than expected, and othersperformed less well180160140MedianMCAT total 165185205225245265280 19MCAT Total ScoreCorrectedcorrelation .70 2019. May not be reproduced without permission.
At MD-granting medical schools, MCAT total scores also showmedium to large correlations with 2016 entrants’ Step 1 scoresCorrelation of MCAT Total Scores with Step 1 Scores:Median and Interquartile Range (Nschool 103)20Notes:1. This figure was generated based on datafrom 2016 entrants (N 6,534) at 103 U.S.medical schools who took Step 1 by midSeptember 2018. In these 103 schools, atleast 30 or more 2016 entrants took Step 1by mid-September 2018. Data for studentswho come from schools with less than 30students who took Step 1 by mid-September2018 were not included in the analysis.2. Because more 2017 applicants to the validityschools had scores from the current examthan the 2016 applicants, the corrections forrange restriction were made using data fromthe 2017 admissions cycle.3. The horizontal line with a y-axis value at 0.3is the reference line for a medium association(Cohen, 1992).4. For students who took the MCAT exam morethan once, the most recent MCAT score atthe time of matriculation was used in thisanalysis. 2019. May not be reproduced without permission.rEffect Size0.1Small0.3Medium0.5Large
At MD-granting medical schools, MCAT scores and UGPAs predict 2016 entrants’Step 1 scores. Combined, they predict better than either one alone0.60.81.0Correlations of Academic Metrics with Step 1 Scores:Median and Interquartile Range (N school 103)0.58 0.4 00.2 MCAT Total Scores only 210.47Undergraduate GPAs only0.63 MediumEffectMCAT Total Scores Undergraduate GPAs 2019. May not bereproduced withoutpermission. Notes:1. This figure was generated based on data from 2016 entrants (N 6,534) at 103 U.S. medical schools who took Step 1 by mid-September 2018.In these 103 schools, at least 30 or more 2016 entrants took Step 1 by mid-September 2018. Data for students who come from schools with lessr Effect Sizethan 30 students who took Step 1 by mid-September 2018 were not included in the analysis.Small2. Because more 2017 applicants to the validity schools had scores from the current exam than the 2016 applicants, the corrections for range restriction p1scoreswereexcludedfromtheanalysis.were made using data from the 2017 admissions cycle.0.3Medium3. The horizontal line with a y-axis value at 0.3 is the reference line for a medium association (Cohen, 1992).0.5Large4. For students who took the MCAT exam more than once, the most recent MCAT score at the time of matriculation was used in this analysis.
How Well Do MCAT Scores andUndergraduate GPAs Predict Performance onthe Dichotomous Outcomes?22 Progression to M2 on Time and within 1 Extra Year Progression to M3 on Time 2019. May not be reproduced without permission.
Together, MCAT scores and undergraduate GPAs tell moreabout 2016 entering students’ progression to M2 on timeGPA T 3293%13/14------99%757/76596%7,572/7,855less than 6/1,178Notes:1. Blue shading passing rates of 90–100%; green shading passing rates of 80–89%; orange shading passing rates of 70–79%.2. Dashes cells with fewer than 10 observations; blank cells cells with 0 observations.3. For students who took the MCAT exam multiple times, the most recent MCAT total score was used in this analysis.23 4. Students entering medical school with advanced standing from medical, graduate, or other programs, enrolled in joint programs (e.g., MD-PhD)at the time of matriculation or graduation, participating in special research/non-research studies, or deceased are not included in this table. 2019. May not bereproduced withoutpermission.
Most students progressed to M2 within 1 extra yearGPA CAT /75100%32/32100%14/14----less than 66/1,178Notes:1. Blue shading passing rates of 90–100%; green shading passing rates of 80–89%; orange shading passing rates of 70–79%.2. Dashes cells with fewer than 10 observations; blank cells cells with 0 observations.3. For students who took the MCAT exam multiple times, the most recent MCAT total score was used in this analysis.24 4. Students entering medical school with advanced standing from medical, graduate, or other programs, enrolled in joint programs (e.g., MD-PhD)at the time of matriculation or graduation, participating in special research/non-research studies, or deceased are not included in this table.99%761/76599%7,771/7,855 2019. May not bereproduced withoutpermission.
Together, MCAT scores and undergra
4. For students who took the MCAT exam more than once, the most recent MCAT score at the time of matriculation was used in this analysis. Correlation of MCAT Total Scores with Summative Performance across Preclerkship Courses: Median and Interquartile Range (N school 16) CONFIDENTIAL –DO NOT DISTRIBUTE Correlation at the 75th percentile Median