Transcription
The AAPS Journal (2022) 24: CH ARTICLEComparison of Titer and Signal to Noise (S/N) for Determinationof Anti‑drug Antibody Magnitude Using Clinical Data from an IndustryConsortiumMarta Starcevic Manning1 · Mohamed Hassanein2 · Michael A. Partridge3 · Vibha Jawa4 · Johanna Mora4 ·Josiah Ryman5 · Breann Barker6,7 · Christian Braithwaite8 · Kevin Carleton9 · Laura Hay10 · Charles Hottenstein11 ·Robert J. Kubiak12 · Viswanath Devanarayan13Received: 11 May 2022 / Accepted: 17 June 2022 / Published online: 12 July 2022 The Author(s) 2022AbstractDuring biotherapeutic drug development, immunogenicity is evaluated by measuring anti-drug antibodies (ADAs). Thepresence and magnitude of ADA responses is assessed using a multi-tier workflow where samples are screened, confirmed,and titered. Recent reports suggest that the assay signal to noise ratio (S/N) obtained during the screening tier correlates wellwith titer. To determine whether S/N could more broadly replace titer, anonymized ADA data from a consortium of sponsorswas collected and analyzed. Datasets from clinical programs with therapeutics of varying immunogenicity risk levels (lowto high), common ADA assay platforms (ELISA and MSD) and formats (bridging, direct, solid-phase extraction with aciddissociation), and titration approaches (endpoint and interpolated) were included in the analysis. A statistically significantcorrelation between S/N and titer was observed in all datasets, with a strong correlation (Spearman’s r 0.8) in 11 out of15 assays (73%). For assays with available data, conclusions regarding ADA impact on pharmacokinetics and pharmacodynamics were similar using S/N or titer. Subject ADA kinetic profiles were also comparable using the two measurements.Determination of antibody boosting in patients with pre-existing responses could be accomplished using similar approachesfor titer and S/N. Investigation of factors that impacted the accuracy of ADA magnitude measurements revealed advantagesand disadvantages to both approaches. In general, S/N had superior precision and ability to detect potentially low affinity/avidity responses compared to titer. This analysis indicates that S/N could serve as an equivalent and in some cases preferablealternative to titer for assessing ADA magnitude and evaluation of impact on clinical responses.Keywords Immunogenicity · Anti-drug antibodies · Biotherapeutic · Magnitude · Titer* Marta Starcevic Manningmstarcev@amgen.com1Translational Safety and Bioanalytical Sciences, AmgenResearch, One Amgen Center Drive, MS 30E‑3B,Thousand Oaks, California 91320, USA7Present Address: Incyte Corporation, Wilmington, Delaware,USA8BioAgilytix, Boston, Massachusetts, USA9Janssen Preclinical Safety and Translational Sciences,Spring House, Pennsylvania, USA2Early Clinical Development, Precision Medicine, Pfizer Inc.,Cambridge, Massachusetts, USA10Bioanalytical Lab, PPD Clinical Research Services, ThermoFisher Scientific, Richmond, Virginia, USA3Bioanalytical Sciences, Regeneron, Tarrytown, New York,USA11Bioanalysis, Immunogenicity and Biomarkers,GlaxoSmithKline, Collegeville, Pennsylvania, USA4Non‑clinical Disposition and Bioanalysis, Bristol MyersSquibb, Princeton, New Jersey, USA12Clinical Pharmacology and Safety Sciences, AstraZeneca,Gaithersburg, Maryland, USA5Quantitative Pharmacology and Pharmacometrics, Merck,Kenilworth, New Jersey, USA13Data Science, Eisai Inc., Nutley, New Jersey, USA6Specialty Bioanalytics, Teva Pharmaceuticals, West Chester,Pennsylvania, USA13Vol.:(0123456789)
81 Page 2 of 13AbbreviationsADAs Anti-drug antibodiesECL ElectrochemiluminescenceELISA Enzyme-linked immunosorbent assaymAbs Monoclonal antibodiesS/N Signal to noise ratio (also known as signal-tonegative control ratio)MSD Meso Scale DiscoveryMRD Minimum required dilutionPD PharmacodynamicsPK PharmacokineticsSPEAD Solid-phase extraction with acid dissociationIntroductionThe assessment of immunogenicity of biotherapeutics is aregulatory requirement to determine the effects of anti-drugantibodies (ADA) on patient safety, drug concentrations,or product efficacy. A multi-tiered approach for ADA characterization is typically used in clinical trials (1). In thisapproach, the magnitude of ADA response is characterizedby testing a serial dilution of confirmed positive samplesto obtain titer values. The titer value of a given sample isexpressed as the reciprocal of the highest dilution that stillyields a positive result in the assay (endpoint titer) or as aninterpolated value from the sample dilution curve at a predetermined cut point (interpolated titer) (2).Titer has been widely applied in the pharmaceuticalindustry and medical community as an indirect way tomeasure antibody levels in clinical samples. Historically,many legacy clinical serological tests, such as viral hemagglutination and complement fixation test assays, utilized titervalues guided by references specific to a particular antigenor antibody (3, 4). The first generation of ADA assays wereELISAs, with limited sensitivity and dynamic range thatrequired sample titration to assess response magnitude (5).Current industry-standard ADA assays have significantlyimproved sensitivity (low ng/mL) and dynamic range (several orders of magnitude) compared to older techniques suchas ELISA (6). These technological advances, combined withthe generally lower magnitude of ADA responses to biologics compared to vaccines, may reduce the need for titration.While titer determination is useful for the stratificationof ADA levels and evaluation of their impact on safety andefficacy, it can suffer from multiple limitations. Additionalmanipulation of the sample and interpolation of titer resultsfrom signals located in the lower plateau of the assay rangeoften result in poor precision. The endpoint titer approachmay lead to inferior result resolution and an inability to differentiate low-level ADA responses. As titration is the thirdtier of ADA testing, samples analyzed for titer may haveundergone extensive handling (e.g., refrigerated storage,13The AAPS Journal (2022) 24: 81multiple freeze-thaw cycles) which can impact ADA integrity and reproducibility. Titration is performed by dilutingsamples in a pool of a qualified drug-naïve matrix whichmay result in foreign matrix components blocking a subsetof the ADA population. Titer may not be effective in detecting samples with low-affinity ADA as they may be prone todilutional nonlinearity. In certain types of studies, such asthose with pediatric patients, there may be challenges collecting a sufficient sample volume to allow for three ADAanalysis tiers or assessment of other analytes. Finally, performing titration for large clinical studies increases the costof pharmaceutical development and delays the availabilityof potentially important patient safety data. While someof these limitations can be avoided by assay optimization(e.g., titer cut point adjustment), it is desirable to identifyadditional options for measuring the magnitude of ADA tobiologic drugs.A recent report proposes an alternative approach to titerthat utilizes the signal to noise ratio (S/N) to assess ADAmagnitude in clinical samples (7). S/N is defined as thesignal of the sample derived from the screening assay oruntreated portion of the confirmatory assay, divided by thesignal of the negative control analyzed on the same plate.Normalization of the sample signal using a negative controlto represent the biological background reduces sample resultvariability across plates or runs. This report demonstratedthat S/N data correlated well with titer in three clinical trials. In addition, a robust correlation of the assay signal withtiter assay results was recently reported for a flow cytometryimmunogenicity assay for a chimeric antigen receptor (CAR)T-cell therapeutic (8).To determine whether the S/N approach could be suitableas an alternative to traditional titer assessment for different therapeutic modalities with varied immunogenicity riskprofiles and assay formats, a consortium was formed fromnine pharmaceutical and biotechnology companies. Fifteenindependent and anonymized clinical ADA datasets providedby the contributing organizations were analyzed for S/N versus titer correlation. In addition, ADA magnitude resultsdetermined using both approaches were used to perform thestandard ADA characterization analyses including the impactof ADA on pharmacokinetics (PK) and pharmacodynamics(PD) and evaluation of ADA kinetics within a subject.Materials and MethodsData CollectionSponsor companies provided the statistician with therapeutic information, assay characteristics, validation summary data, and study data in a standardized data collection template. Requested study data included S/N and titer
The AAPS Journal (2022) 24: 81Page 3 of 13 81results from ADA-positive subjects, PK data (drug concentration of the same sample or same sampling time pointcorresponding to the ADA result), primary and/or secondary pharmacodynamic marker data (optional), and interassay precision data of the positive control and titer assaycontrol. Requested validation data included assay range(positive control dose-response curve results spanning lowto high concentrations), inter-assay precision results forS/N and titer, and drug tolerance results for S/N and titer.The statistician anonymized data sources and shared thecollated dataset with working group members. Nine sponsor companies contributed data from 15 assays, referredto as assays or datasets A1 to A15 within this manuscript.ADA AssaysADA assays were performed according to the format andplatform indicated in Table I as described previously(9–12). S/N was calculated by dividing the mean clinicalstudy sample signal by the mean signal of the negativecontrol analyzed on the same screening assay plate. Titration was performed by serially diluting samples in pooledserum using a 2-fold dilution scheme. Titer results weredetermined by linear interpolation at the titer cut pointfrom dilutions producing signals above and below the titercut point (interpolated titer) or by reporting the reciprocal of the last dilution testing above the titer cut point(endpoint titer).Assay Validation ParametersADA assays were validated according to applicable whitepapers and regulatory agency guidance available at the timeof validation (1, 13, 14). For the purposes of this analysis, assay precision (%CV) was based on in-study precisiondata for the low and high positive controls (S/N) or the titerpositive control whenever possible. For assays that lackedin-study precision data for both measurements, precisionwas estimated using sensitivity curve data when at least 6separate runs were available. S/N precision was based onthe highest %CV detected across any concentration producing values above the assay cut point. For titer precision, theserial dilution of the highest concentration of the sensitivitycurve was used to determine a titer result according to themethod used for clinical samples. Titer inter-assay precision was based on the %CV of the titer results. S/N linearity was determined using validation assay range data afterconfirming that it covered at least 90% of clinical studyresponses. For concentrations testing above the screeningassay cut point, acceptable linearity was concluded if theobserved S/N value, after subtracting 1 for background (i.e.,S/N 1), was within 50% of the S/N value expected basedon the next lower concentration and the dilution factor. Thepercentage of samples located in the upper S/N assay plateau of clinical study data was calculated by dividing thenumber of samples that had a differentiation of titer valuesaccompanied by saturation of S/N values divided by the totalnumber of samples. Drug impact on ADA magnitude measurements was not evaluable for most assays because it wasTable I Assay and Clinical Study CharacteristicsSourceAssay numberAssay platformAssay formatTherapeutic modalityImmunogenicity risklevelStudy populationTreatment-emergentimmunogenicity mAbmAbmAbmAbFusion proteinmAbmAbmAbmAbBispecificFusion owLowLowMediumMediumMediumAutoimmune diseaseAutoimmune diseaseOncologyStrokeType 1 diabeticHealthyOncologyOncologyI&I diseaseI&I diseaseI&I diseaseAsthmaUlcerative colitisOncologyAutoimmune disease12%23%2%40%100%92%31%70% 20% 5% 5%6%38%74%85%I&I immune and inflammatory, MSD Meso Scale Discovery, ELISA enzyme-linked immunosorbent assay, SPEAD solid-phase extraction withacid dissociation, mAb monoclonal antibody13
81 Page 4 of 13not determined for titer results in any assay validations. Inaddition, the impact of drug on S/N could not be assessedfor most assays as the lowest drug concentrations that hadan impact on S/N recovery during validation were higherthan drug concentrations present in clinical study samples.Statistical AnalysisThe strength of the relationship between S/N and titer, andS/N or titer and PK or PD, was assessed using log-transformed S/N, titer, PK, and PD data and Spearman’s rank correlation coefficient (r). ADA-positive samples that had botha S/N and titer result were used in the analysis. Very strongand moderate correlation were defined as Spearman’s r 0.8and r 0.6, respectively (15). Correlations with p-value 0.05 were considered statistically significant. For correlationof S/N or titer vs. PK or PD, datasets that had nonzero PK orPD data available for at least 50% of ADA-positive sampleswere included in the analysis (6 out of 15 assays for PK, and3 out of 15 assays for PD).One assay (A7) was selected for more detailed PK association analysis as it had a rich dataset due to intense PK/ADA sampling and available dosing information. For thisanalysis, drug trough concentrations were dose-normalizedto the actual dose given and ADA responses were stratifiedinto S/N or titer quartiles (2). The small sample size of eachsubgroup precluded the application of statistics for subgroupcomparison.Evaluation of ADA Kinetics and Treatment Boostingin Pre‑existing Antibody‑Positive SubjectsWithin each dataset, the subject with the highest S/Nresponse and at least 4 available time points was selectedfor the evaluation of the kinetics of ADA development overtime. Titer and S/N values were plotted on the left and righty-axes, respectively.Dataset A15 was selected as a case study for treatmentboosting because it contained the highest number of preexisting antibody-positive subjects with full ADA profiles.As the provided titer results only captured the titration dilution, these results were multiplied by the assay’s minimumrequired dilution (MRD) (100) to reflect current guidance fortiter reporting (1). Samples producing S/N values betweenthe screening and titer cut points and samples whose firstdilution tested below the titer cut point were reported witha titer result equivalent to the MRD (16). To calculate thefold increase in ADA magnitude following drug exposure,the postdose result (titer, S/N, or S/N 1) was divided bythe pre-dose result. Treatment boosting was determined byapplying a simple criterion (4-fold, to reflect the 2-fold endpoint titer dilution scheme for this method) or the minimumsignificant ratio (MSR). The median MSR was calculated13The AAPS Journal (2022) 24: 81using in-study log-transformed low and high positive control S/N or S/N 1 values as described in (16). In-studyprecision data was used because validation data coveringprecision across a wide range of ADA magnitudes was notavailable for this dataset.ResultsClinical Dataset Characteristics and S/N vs. TiterCorrelationsFifteen datasets from nine different sponsors were assessedfor correlation of the ADA magnitude outputs measured aseither S/N or titers. ADA results were derived from ELISAor MSD-based platforms, represented multiple assay formats(13 bridging, 1 indirect, and 1 SPEAD), and spanned diversemodalities of biologics including monoclonal antibodies,fusion proteins, and bispecifics (Table I). The treatmentemergent clinical immunogenicity incidences varied fromlow (2%) to high (100%) in autoimmune, oncology, andinflammatory disease indications. A statistically significantcorrelation between S/N and titer values was observed in all15 assays (Table II and Fig. 1). In 11 out of 15 assays (73%),the correlation was very strong (Spearman’s r 0.8). In14 out of 15 assays (93%), the correlation was moderate tostrong (Spearman’s r 0.6).Impact on PK and PDThe impact of immunogenicity (by either S/N or titer) onpharmacokinetics (PK) and/or pharmacodynamic (PD)markers was assessed for 6 and 3 of the datasets, respectively. A modest negative correlation between ADA leveland PK was observed for most datasets with the strongestcorrelation detected for dataset A7 (Table II). The negativecorrelation indicates a decline in drug concentrations withthe increase in ADA magnitude as measured by either S/Nor titer. For most cases, S/N and titer had comparable levelsof correlation with PK.Similar conclusions for impact of ADA on PD were alsofound in the 3 datasets using S/N and titer (Table II). Fordatasets A4 and A6, a decline in PD marker levels was associated with an increase in ADA magnitude whether measured by S/N or titer. Another PD marker (PD2) for datasetA6 was not significantly correlated with ADA magnitude,whether measured by S/N or titer. Finally, dataset A2 showeda positive correlation of increased PD marker levels associated with increased ADA titer and S/N.A more detailed analysis of the association of ADA withPK was performed using the A7 dataset by grouping ADApositive subjects into quartiles based on their magnitudes.A similar trend of decreasing drug trough concentrations
The AAPS Journal (2022) 24: 81Page 5 of 13 81Table II Correlation of S/N vs. Titer, and ADA Magnitude (S/N or Titer) vs. PK/PDAssay numberA1A2A3A4A5A6A7A8A9A10A11A12A13A14A15Number of positive Number of positive Spearman’s rank correlation coefficient (r)subjectssamplesS/N vs. titerPK vs. S/NPK vs. 750.921 0.456PD vs. S/NPD vs. titer0.4000.358 0.406 0.414 0.332/ 0.081 0.332/ 0.055 0.286 0.182 0.204 0.776 0.725 0.294 0.288 0.348 0.296 0.169 0.192Italics indicate significant correlation values (two-tailed p-value 0.05). For correlation of ADA magnitude (S/N or titer) with PK or PD, datasets were included in the analysis if at least 50% of the positive samples had a nonzero PK or PD measurement. Assay A6 had data for two PDmarkers submittedADA anti-drug antibody, PK pharmacokinetics, PD pharmacodynamicswas detected as the ADA magnitude increased across thefirst and second quartiles of S/N or titer, with the lowestdrug trough concentrations present in the third and fourthquartiles (Fig. 2).Overall, the evaluation of impact of immunogenicity onPK or PD markers produced the same conclusions independent of the approach used to assess ADA magnitude (S/N ortiter).ADA Kinetics and Pre‑existing Antibody BoostingADA magnitude results are used to monitor ADA kinetics within a subject over the course of the study. Titer andS/N values were plotted over time for the subject with thehighest S/N and at least four positive postdose time pointswithin each dataset (Fig. 3). For the majority of samples inall assays, a similar trend of increasing or decreasing ADAresponse was observed compared to the previous time pointregardless of whether S/N or titer was used.In subjects with pre-existing antibodies, ADA magnituderesults can also be used to determine whether there was anincrease in antibody response following drug administration, referred to as treatment boosting. Recommendationsfor criteria used to define a significant increase in the ADAresponse in a postdose sample compared to a pre-dose sample have been described in regulatory guidance and whitepapers (1, 2). For methods using endpoint titer, an increasein postdose titer equal to or greater than 2 dilution steps(e.g., 4-fold or 9-fold, depending on the titration dilutionscheme) is defined as treatment-boosted. For methodsusing interpolated titer, the proposed criterion for treatmentboosting is based on the minimum significant ratio (MSR),a measure of assay variability calculated using validationprecision data.These criteria for treatment boosting were evaluated forboth measures of ADA magnitude (S/N and titer) using aclinical dataset with the highest number of pre-existing positive subjects (A15). Treatment boosting was determined byapplying the 4-fold or the MSR criterion to postdose titeror S/N results. In addition, as the S/N measure includes thecontribution of the assay background, which is not expectedto increase following drug administration, determination ofboosting was also performed using pre-dose and postdoseS/N values after subtracting the background (S/N 1). Treatment boosting results are shown in Table III for four subjectsrepresenting each scenario encountered in the study. In twosubjects, the timing of detection of initial treatment boostingwas different depending on which measure of ADA magnitude (titer, S/N, or S/N 1) was used. For subject 17, S/Nand S/N 1 approaches identified treatment boosting at anearlier time point (day 15) compared to titer (day 169). Forsubject 16, the S/N 1 or the S/N approach combined withthe MSR criterion was the only method that resulted in determination of treatment boosting at an early ADA time point(day 29). Both of these subjects had very low pre-existingantibody responses just above the screening assay cut point.13
81 Page 6 of 1313The AAPS Journal (2022) 24: 81
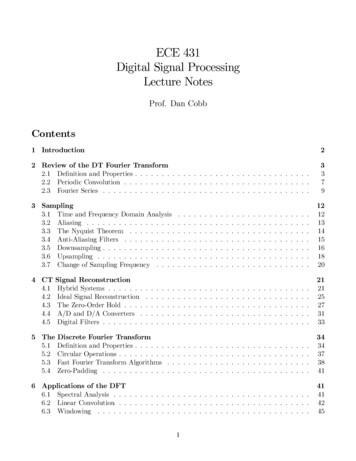
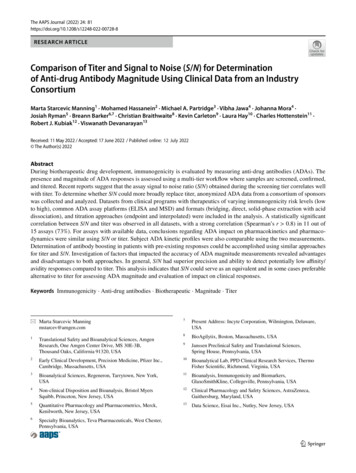
The AAPS Journal (2022) 24: 81 Fig. 1 Correlation of S/N vs. titer results in clinical studies from fif-teen ADA assays from nine sponsors. Data is from ELISA- or MSDbased platforms; bridging, indirect, or SPEAD formats; and monoclonal antibody, bispecific, and fusion protein modalitiesAt later study time points in subjects 16 and 17 and at alltime points for subjects 1 and 46, treatment boosting conclusions were equivalent irrespective of the ADA magnitudemeasure or boosting criteria.Factors That Impact Titer and S/N AssessmentsS/N Signal Plateau with High ADA ResponsesMost assays had an adequate S/N assay range, as the clinicaldata demonstrated good titer and S/N correlation throughoutthe response range including at high titer (Fig. 1) and acceptable S/N linearity during validation (Table IV). Datasets A4,A8, A10, A14, and A15 had a strong overall correlation ofS/N and titer; however, there was some evidence of a S/Nplateau (Fig. 1). Four of these assays (A8, A10, A14, andA15) used the MSD platform with a much wider dynamicrange compared to spectrophotometric ELISAs. In thesecases, saturation of the S/N response occurred at very highS/N values (S/N 1000) and affected only a small number ofclinical study samples (between 2 and 9%; Table IV). Dataset A4, however, used an ELISA platform and saturationoccurred at fairly low S/N values (S/N 20) and impacted37% of study samples.Three of the MSD assays (A8, A10, and A15) had assayrange validation data spanning the breadth of clinical ADAresponses. Nonlinearity of the positive control S/N responseduring method validation was detected starting at approximately the same level seen in clinical study data. For example, study S/N responses in assay A8 did not show signsof saturation below S/N 1000 (Fig. 1). Similarly, positivecontrol S/N responses during validation were also linear upuntil S/N 1000 (Supplemental Figure 1).Improved Precision of S/N Measurements Compared to TiterPrecision is a critical component for any assay, including forADA magnitude determination. In-study precision data wasavailable for low and high positive controls (S/N precision)and titer positive control (titer result precision) for threedatasets. In all these cases, precision of S/N was substantially better than titer precision (Table IV, bold values). Forthe two methods using endpoint titer or one method usinginterpolated titer, the titer positive control varied 4-fold or2-fold from the median value, respectively. Within thosemethods, sample titer results can be expected to deviate upto 4-fold from the true result. The remaining datasets did notmonitor titer precision during clinical sample analysis andPage 7 of 13 81did not formally evaluate this parameter during validation.For those assays, titer precision was estimated using sensitivity curves which included a serial dilution (titration) ofthe positive control across at least 6 separate runs. Althoughthis approach underestimates titer imprecision as the highestpoint of the curve was generally at a low to medium concentration, in all evaluable assays, titer precision was inferiorto S/N precision.Titer imprecision can impact samples with high ADAresponses due to the extensive serial dilution required toproduce the titer result. In addition, samples with low ADAresponses suffer from poor titer result resolution, especiallywhen endpoint titer is used. In assay A11 (S/N vs. titer correlation Spearman’s r 0.618), almost 90% of the sampleshad low-titer ADA responses (MRD or the next lowest dilution) and the less robust correlation was likely due to theinherent lack of endpoint titer resolution within the lowerrange of the assay.Although interpolated titer is preferable to endpoint titerin terms of improved result resolution, it can also be imprecise due to sample manipulation and result interpolation inthe lower assay range. In dataset A7, the titer cut point waslocated in the lower plateau of the assay (equivalent to thescreening cut point). Several subjects in this dataset hadindividual time points for which the titer result did not matchthe S/N measurement and noticeably deviated from the restof the subject’s ADA profile (Supplemental Figure 2a, redcircles), suggesting titer imprecision.Drug and Target InterferenceDrug interference with either S/N or titer measurementscan also impact the accuracy of ADA magnitude results.Although all assays evaluated drug tolerance in terms ofthe ability to correctly detect positives in the presence ofdrug, the impact of drug on titer results was not tested inany of the assay validations. Despite acceptable overall drugtolerance in terms of identifying positives, S/N results wereaffected to some degree by the presence of drug in mostassays. However, the lowest drug levels tested in validationwere much higher than drug levels detected in clinical studysamples. Therefore, the effect of drug on ADA magnitudemeasurements (S/N or titer) could not be robustly evaluatedusing validation data. In one assay (A3; S/N vs. titer correlation Spearman’s r 0.553), the validated drug tolerancelimit was close to or below drug concentrations present instudy samples, suggesting that circulating drug may haveinterfered with S/N and/or titer measurements. In addition,this dataset had the smallest sample size and narrow rangeof positive responses, which may have impacted endpointtiter accuracy.Another assay with a less robust S/N vs. titer correlation (A12, Spearman’s r 0.697) was reported to have13
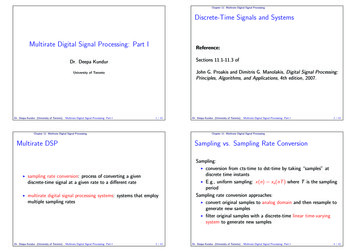
81 Page 8 of 13The AAPS Journal (2022) 24: 81Fig. 2 Impact of ADA magnitude on dose-normalized drugmean trough concentrationsfor assay A7. Each box plotshows the distribution of drugconcentrations as lower extreme(lower whisker), first quartile(lower hinge), median (middleline), mean (open diamond),third quartile (upper hinge), andupper extreme (upper whisker).The outliers ( 1.5 times thebox length) are shown as closedcircles. Q1 to Q4 indicate S/Nor titer quartilessignificant target interference, requiring an additional targetconfirmatory assay and potentially affecting the correlationanalysis.Low Affinity/Avidity ResponsesClinical data from assays A1, A2, A5, and A8 suggests thatthe screening (S/N) and titer tiers may capture the contributions of affinity/avidity on final results differently. In thesedatasets, a small subset of confirmed positive samples hadrelatively high S/N values but low titer values (equivalentto the MRD or within 2 dilutions; Fig. 1). Interestingly, allof these samples were from subjects that were either positive for pre-existing antibodies and/or treated with placebo.In assays A5 and A8, pre-existing positive subjects hadsignificant increases in S/N values postdose despite titerresults remaining low (Supplemental Figure 2b). Upondilution in the titer assay, these potentially lower affinity/avidity antibodies could dissociate faster or be blocked bythe exogenous matrix added during titration. S/N may therefore be preferable for appropriate quantification of at leasta subset of ADA responses that may be prone to dilutionalnonlinearity.DiscussionSample titration is a valuable tool to assess the magnitude ofresponse in assays with readouts that have a limited dynamicrange or for measurement of the significantly higher immuneresponses to vaccines compared to biologics. However,titration-based methods are operationally more complex andhave numerous drawbacks that are frequently overlooked.Plate-based immunoassays with numerical responses as areadout (S/N) and the advent of new technologies — such aselectrochemiluminescence (ECL), the use of bridging assayformats, and novel approaches to minimize drug interference13— have improved the concentration-response range, sensitivity, specificity, and drug tolerance of immunogenicityassays. These advances enable the evaluation of the assayS/N ratio as a simpler alternative to titration.This study found a statistically significant correlationof S/N and titer in all 15 clinical immunogenicity datasets re
industry and medical community as an indirect way to measure antibody levels in clinical samples. Historically, many legacy clinical serological tests, such as viral hemag - glutination and complement xation test assays, utilized titer values guided by references specic to a particular antigen or antibody ( 3, 4).