Transcription
11472-07 Rodrik rev2.qxd3/6/091:20 PMPage 365DANI RODRIKHarvard UniversityThe Real Exchange Rateand Economic GrowthABSTRACT I show that undervaluation of the currency (a high realexchange rate) stimulates economic growth. This is true particularly for developing countries. This finding is robust to using different measures of the realexchange rate and different estimation techniques. I also provide some evidence that the operative channel is the size of the tradable sector (especiallyindustry). These results suggest that tradables suffer disproportionately fromthe government or market failures that keep poor countries from convergingtoward countries with higher incomes. I present two categories of explanationsfor why this may be so, the first focusing on institutional weaknesses, and thesecond on product-market failures. A formal model elucidates the linkagesbetween the real exchange rate and the rate of economic growth.Economists have long known that poorly managed exchange rates canbe disastrous for economic growth. Avoiding significant overvaluationof the currency is one of the most robust imperatives that can be gleanedfrom the diverse experience with economic growth around the world, andone that appears to be strongly supported by cross-country statistical evidence.1 The results reported in the well-known papers by David Dollar andby Jeffrey Sachs and Andrew Warner on the relationship between outwardorientation and economic growth are largely based on indices that capturethe degree of overvaluation.2 Much of the literature that derives policy recommendations from cross-national regressions is now in disrepute,3 but it1. Razin and Collins (1997); Johnson, Ostry, and Subramanian (2007); Rajan and Subramanian (2006).2. Dollar (1992); Sachs and Warner (1995); Rodriguez and Rodrik (2001).3. Easterly (2005); Rodrik (2005).365
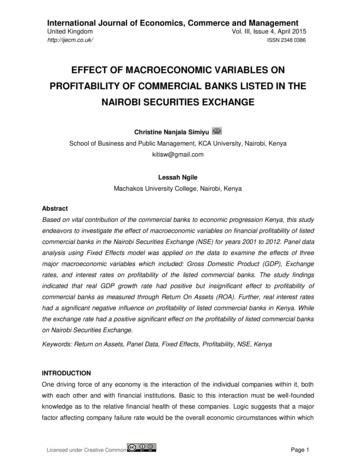
11472-07 Rodrik rev2.qxd3663/6/091:20 PMPage 366Brookings Papers on Economic Activity, Fall 2008is probably fair to say that the admonishment against overvaluationremains as strong as ever. In his pessimistic survey of the cross-nationalgrowth literature,4 William Easterly agrees that large overvaluations havean adverse effect on growth (although he remains skeptical that moderatemovements have determinate effects).Why overvaluation is so consistently associated with slow growth is notalways theorized explicitly, but most accounts link it to macroeconomicinstability.5 Overvalued currencies are associated with foreign currencyshortages, rent seeking and corruption, unsustainably large current accountdeficits, balance of payments crises, and stop-and-go macroeconomic cycles,all of which are damaging to growth.I will argue that this is not the whole story. Just as overvaluation hurtsgrowth, so undervaluation facilitates it. For most countries, periods of rapidgrowth are associated with undervaluation. In fact, there is little evidenceof nonlinearity in the relationship between a country’s real exchange rateand its economic growth: an increase in undervaluation boosts economicgrowth just as powerfully as a decrease in overvaluation. But this relationship holds only for developing countries; it disappears when the sample isrestricted to richer countries, and it gets stronger the poorer the country.These findings suggest that more than macroeconomic stability is at stake.The relative price of tradable goods to nontradable goods (that is, the realexchange rate) seems to play a more fundamental role in the convergenceof developing country with developed country incomes.6I attempt to make the point as directly as possible in figure 1, whichdepicts the experience of seven developing countries during 1950–2004:China, India, South Korea, Taiwan, Uganda, Tanzania, and Mexico. Ineach case I have graphed side by side my measure of real undervaluation(defined in the next section) against the country’s economic growth rate inthe same period. Each point represents an average for a five-year window.To begin with the most fascinating (and globally significant) case, thedegree to which economic growth in China tracks the movements in myindex of undervaluation is uncanny. The rapid increase in annual growth ofGDP per capita starting in the second half of the 1970s closely parallelsthe increase in the undervaluation index (from an overvaluation of close to4. Easterly (2005).5. See, for example, Fischer (1993).6. Recently, Bhalla (forthcoming), Gala (2007), and Gluzmann, Levy-Yeyati, andSturzenegger (2007) have made similar arguments.
11472-07 Rodrik rev2.qxd3/6/091:20 PMPage 367367DANI RODRIKFigure 1. Undervaluation and Economic Growth in Selected Developing Countries,1950–2004ChinaLog units0.250–0.25–0.50–0.75–1.00Percent a year86420Growth in GDPper capita (right scale)ln UNDERVAL (left scale)1960197019801990IndiaLog unitsPercent a year0.60.43ln UNDERVALGrowth inGDP per capita0.2019601970198021990South KoreaPercent a yearLog unitsln UNDERVAL60.240Growth inGDP percapita–0.219602197019801990TaiwanLog units0–0.1–0.2–0.3–0.4–0.5Percent a year8ln UNDERVAL765Growth in GDPper capita19601970419801990(continued)
11472-07 Rodrik rev2.qxd3/6/091:20 PM368Page 368Brookings Papers on Economic Activity, Fall 2008Figure 1. Undervaluation and Economic Growth in Selected Developing Countries,1950–2004 (Continued)UgandaLog unitsPercent a year0.500.250–0.25–0.50–0.75Growth in GDPper capita420–2lnUNDERVAL1960–419701980TanzaniaLog units–0.2–0.3ln UNDERVAL–0.4–0.5–0.6Growth in GDP–0.7per capita–0.8196019701990Percent a year42019801990MexicoPercent a yearLog units3210–10.20ln UNDERVAL–0.2Growth in GDPper capita–0.41960197019801990Sources: Penn World Tables version 6.2, and author’s calculations.100 percent to an undervaluation of around 50 percent7), and both undervaluation and the growth rate plateau in the 1990s. Analysts who focus onglobal imbalances have, of course, noticed in recent years that the yuan isundervalued, as evidenced by China’s large current account surplus. Theyhave paid less attention to the role that undervaluation seems to haveplayed in driving the country’s economic growth.7. Recent revisions in purchasing power parity indices are likely to make a big difference to the levels of these undervaluation measures, without greatly affecting their trendsover time. See the discussion below.
11472-07 Rodrik rev2.qxdDANI RODRIK3/6/091:20 PMPage 369369For India, the other growth superstar of recent years, the picture is lessclear-cut, but the basic message is the same as that for China. India’sgrowth in GDP per capita has steadily climbed from slightly above 1 percent a year in the 1950s to 4 percent by the early 2000s, while its realexchange rate has moved from a small overvaluation to an undervaluationof around 60 percent. In the case of the two East Asian tigers depicted infigure 1, South Korea and Taiwan, what is interesting is that the growthslowdowns in recent years were in each case preceded or accompanied byincreased overvaluation or reduced undervaluation. In other words, bothgrowth and undervaluation exhibit an inverse-U shape over time.These regularities are hardly specific to Asian countries. The next twopanels in figure 1 depict two African experiences, those of Uganda andTanzania, and here the undervaluation index captures the turning points ineconomic growth exceptionally well. A slowdown in growth is accompanied by increasing overvaluation, and a pickup in growth is accompaniedby a rise in undervaluation. Finally, the last panel of figure 1 shows asomewhat anomalous Latin American case, that of Mexico. Here the twoseries seem quite a bit out of sync, especially since 1981, when the correlation between growth and undervaluation turns negative rather than positive. Those familiar with the recent economic history of Mexico willrecognize this to be a reflection of the cyclical role of capital inflows ininducing growth in that country. Periods of capital inflows in Mexico areassociated with consumption-led growth booms and currency appreciation; when the capital flows reverse, the economy tanks and the currencydepreciates. The Mexican experience is a useful reminder that there is noreason a priori to expect a positive relationship between growth and undervaluation. It also suggests the need to go beyond individual cases andundertake a more systematic empirical analysis.In the next section I do just that. First, I construct a time-varying indexof real undervaluation, based on data from the Penn World Tables on pricelevels in individual countries. My index of undervaluation is essentially areal exchange rate adjusted for the Balassa-Samuelson effect: this measureof the real exchange rate adjusts the relative price of tradables to nontradables for the fact that as countries grow rich, the relative prices of nontradables as a group tend to rise (because of higher productivity in tradables).I next show, in regressions using a variety of fixed-effects panel specifications, that there is a systematic positive relationship between growth andundervaluation, especially in developing countries. This indicates that theAsian experience is not an anomaly. I subject these baseline results to aseries of robustness tests, employing different data sources, a range of alter-
11472-07 Rodrik rev2.qxd3703/6/091:20 PMPage 370Brookings Papers on Economic Activity, Fall 2008native undervaluation indices, and different estimation methods. Althoughascertaining causality is always difficult, I argue that in this instance causality is likely to run from undervaluation to growth rather than the other wayaround. I also present evidence that undervaluation works through its positive impact on the share of tradables in the economy, especially industry.Hence developing countries achieve more rapid growth when they are ableto increase the relative profitability of their tradables.These results suggest strongly that there is something “special” abouttradables in countries with low to medium incomes. In the rest of the paperI examine the reasons behind this regularity. What is the precise mechanism through which an increase in the relative price of tradables (andtherefore the sector’s relative size) increases growth? I present two classesof theories that would account for the stylized facts. In one, tradables are“special” because they suffer disproportionately (that is, compared withnontradables) from the institutional weakness and inability to completelyspecify contracts that characterize lower-income environments. In theother, tradables are “special” because they suffer disproportionately fromthe market failures (information and coordination externalities) that blockstructural transformation and economic diversification. In both cases, anincrease in the relative price of tradables acts as a second-best mechanismto partly alleviate the relevant distortion, foster desirable structural change,and spur growth. Although I cannot discriminate sharply between the twotheories and come down in favor of one or the other, I present some evidence that suggests that these two sets of distortions do affect tradableactivities more than they do nontradables. This is a necessary condition formy explanations to make sense.In the penultimate section of the paper, I develop a simple growth modelto elucidate how the mechanisms I have in mind might work. The model isthat of a small, open economy in which the tradable and nontradable sectorsboth suffer from an economic distortion. For the purposes of the model,whether the distortion is of the institutional and contracting kind or of theconventional market failure kind is of no importance. The crux is the relative magnitude of the distortions in the two sectors. I show that when thedistortion in tradables is larger, the tradable sector is too small in equilibrium. A policy or other exogenous shock that can induce a real depreciation will then have a growth-promoting effect. For example, an outwardtransfer, which would normally reduce domestic welfare, can have thereverse effect because it increases the equilibrium relative price of tradables and can thereby increase economic growth. The model clarifies howchanges in relative prices can produce growth effects in the presence of
11472-07 Rodrik rev2.qxd3/6/091:20 PMPage 371371DANI RODRIKdistortions that affect the two sectors differently. It also clarifies the sensein which the real exchange rate is a “policy” variable: changing its levelrequires complementary policies (here the size of the inward or outwardtransfer).I summarize my findings and discuss some policy issues in the concluding section of the paper.Undervaluation and Growth: The EvidenceI will use a number of different indices in what follows, but my preferredindex of under- or overvaluation is a measure of the domestic price leveladjusted for the Balassa-Samuelson effect. This index has the advantagethat it is comparable across countries as well as over time. I compute thisindex in three steps. First, I use data on exchange rates (XRAT) and purchasing power parity conversion factors (PPP) from the Penn WorldTables version 6.2 to calculate a “real” exchange rate (RER):8ln RERit ln ( XRATit PPPit ) ,where i indexes countries and t indexes five-year time periods. (Unlessspecified otherwise, all observations are simple averages across years.)XRAT and PPP are expressed as national currency units per U.S. dollar.9Values of RER greater than one indicate that the value of the currency islower (more depreciated) than indicated by purchasing power parity. However, in practice nontradable goods are also cheaper in poorer countries(through the Balassa-Samuelson effect), which requires an adjustment. Soin the second step I account for this effect by regressing RER on GDP percapita (RGDPCH):(1)ln RERit α β ln RGDPCH it ft uit ,where ft is a fixed effect for time period and u is the error term. This regression yields an estimate of β (βˆ) of 0.24 (with a very high t statistic ofaround 20), suggesting a strong and precisely estimated Balassa-Samuelsoneffect: when incomes rise by 10 percent, the real exchange rate falls byaround 2.4 percent. Finally, to arrive at my index of undervaluation, I takethe difference between the actual real exchange rate and the BalassaSamuelson-adjusted rate:8. The Penn World Tables data are from Heston, Summers, and Aten (2006).9. The variable p in the Penn World Tables (called the “price level of GDP”) is equivalent to RER. I have used p here as this series is more complete than XRAT and PPP.
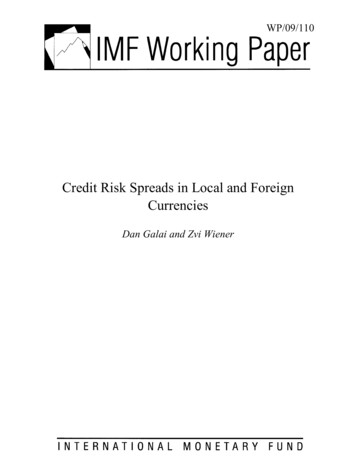
11472-07 Rodrik rev2.qxd3723/6/091:20 PMPage 372Brookings Papers on Economic Activity, Fall 2008 ,ln UNDERVALit ln RERit ln RERit is the predicted value from equation 1.where ln RERitDefined in this way, UNDERVAL is comparable across countries andover time. Whenever UNDERVAL exceeds unity, it indicates that theexchange rate is set such that goods produced at home are relatively cheapin dollar terms: the currency is undervalued. When UNDERVAL is belowunity, the currency is overvalued. In what follows I will typically use thelogarithmic transform of this variable, ln UNDERVAL, which is centeredat zero and has a standard deviation of 0.48 (figure 2). This is also the measure used in figure 1.My procedure is fairly close to that followed in recent work by SimonJohnson, Jonathan Ostry, and Arvind Subramanian.10 The main differenceis that these authors estimate a different cross section for equation 1 foreach year, whereas I estimate a single panel (with time dummies). Mymethod seems preferable for purposes of comparability over time. Iemphasize that my definition of undervaluation is based on price comparisons and differs substantially from an alternative definition that relates tothe external balance. The latter is typically operationalized by specifying asmall-scale macro model and estimating the level of the real exchange ratethat would achieve balance of payments equilibrium.11One issue of great significance for my calculations is that the WorldBank’s International Comparison Program has recently published revisedPPP conversion factors for a single benchmark year, 2005.12 In someimportant instances, these new estimates differ greatly from those previously available and on which I have relied here. For example, price levelsin both China and India are now estimated to be around 40 percent abovethe previous estimates for 2005, indicating that these countries’ currencieswere not nearly as undervalued in that year as the old numbers suggested(15 to 20 percent as opposed to 50 to 60 percent). This is not as damagingto my results as it may seem at first sight, however. Virtually all my regressions are based on panel data and include a full set of country and timefixed effects. In other words, as I did implicitly in figure 1, I identify thegrowth effects of undervaluation from changes within countries, not fromdifferences in levels across a cross section of countries. So my results10. Johnson, Ostry, and Subramanian (2007).11. See Aguirre and Calderón (2005), Razin and Collins (1997), and Elbadawi (1994)for some illustrations.12. International Comparison Program (2007).
11472-07 Rodrik rev2.qxd3/6/091:20 PMPage 373373DANI RODRIKFigure 2. Distribution of the Undervaluation MeasureDensity1.00.80.60.40.2–20UNDERVAL2Source: Author’s calculations.should remain unaffected if the revisions to the PPP factors turn out to consist of largely one-time adjustments to the estimated price levels of individual countries, without greatly altering their time trends. Even thoughthe time series of revised PPP estimates are not yet available, preliminaryindications suggest that this will be the case.In fact, the revised data yield a cross-sectional estimate of β for 2005that is virtually the same as the one presented above ( 0.22, with a t statistic of 11). In other words, the magnitude of the Balassa-Samuelson effectis nearly identical whether estimated with the new data or the old.The Baseline Panel EvidenceMy dataset covers a maximum of 188 countries and 11 five-year periodsfrom 1950–54 through 2000–04. My baseline specification for estimatingthe relationship between undervaluation and growth takes the followingform:(2) growthit α β ln RGDPCH i ,t 1 δ ln UNDERVALit fi ft uit ,where the dependent variable is annual growth in GDP per capita. Theequation thus includes the standard convergence term (initial income percapita, RGDPCHi,t 1) and a full set of country and time dummies (fi and ft).
11472-07 Rodrik rev2.qxd3743/6/091:20 PMPage 374Brookings Papers on Economic Activity, Fall 2008My primary interest is in the value of δ̂. Given the fixed-effects framework, what I am estimating is the “within” effect of undervaluation,namely, the impact of changes in under- or overvaluation on changes ingrowth rates within countries. I present regressions with additional covariates, as well as cross-sectional specifications, in a later subsection.Table 1 presents the results. When estimated for the panel as a whole(column 1-1), the regression yields a highly significant δ̂ of 0.017. However,as columns 1-2 and 1-3 reveal, this effect operates only for developingcountries. In the richer countries in the sample, δ̂ is small and statisticallyindistinguishable from zero, whereas in the developing countries δ̂ rises to0.026 and is highly significant. The latter estimate suggests that a 50 percentundervaluation—which corresponds roughly to one standard deviation inUNDERVAL—is associated with a boost in annual growth of real incomeper capita during the same five-year period of 1.3 percentage points (0.50 0.026). This is a sizable effect. I will discuss the plausibility of this estimate later, following my discussion of robustness tests and theore
DANI RODRIK 367 Figure 1. Undervaluation and Economic Growth in Selected Developing Countries, 1950-2004 China 0 4 2 6 8 -0.50 -0.75 -1.00 0 Log units Percent a year