Transcription
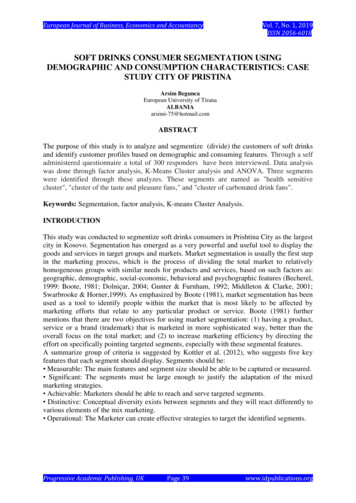
U.S. Carbonated Soft Drinks &Sparkling FunctionalBeverages Topline2022 Edition (To be published September 2022. Data through 2021. Marketprojections through 2026.) More than 25 pages, with text analysis and charts.U.S. Carbonated Soft Drinks and Functional SparklingFor A FullBeverages Topline from Beverage Marketing Corporation provideskey category data and five year forecasts. Perfect for investors,entrepreneurs requiring statistics for their business plan, adagencies preparing an account pitch or anyone who needs a quickview of the carbonated soft drink sector. Includes a briefoverview of key trends including discussion of the upheavalcaused by the covid-19 pandemic.Catalog ofReports andDatabases,Go Tobmcreports.comINSIDE:REPORT OVERVIEWAVAILABLE FORMAT &PRICINGA brief discussion of keyfeatures of this report. 2TABLE OF CONTENTSDirect DownloadWord & PDFA detailed outline of thisreport’s contents and datatables.6 995To learn more, to place an advance order or to inquire aboutadditional user licenses call: Charlene Harvey 1 212.688.7640ext. 1962 charvey@beveragemarketing.comHAVEQUESTIONS?SAMPLE TEXT ANDINFOGRAPHICSA few examples of thisreport’s text, data contentlayout and style.7Contact Charlene Harvey: 212-688-7640 x 1962charvey@beveragemarketing.comBeverage Marketing Corporation850 Third Avenue, 13th Floor, New York, NY 10022Tel: 212-688-7640 Fax: 212-826-1255
The answers you needQuestions answered in U.S. Carbonated Soft Drink and Functional Sparkling Beverages Topline include: How much carbonated soft drinks (CSDs) are consumed on a per capita basis in the UnitedStates? How has this changed in recent years? How is CSD volume apportioned by region and how has this changed from past years? Which flavors are gaining popularity? Which are expected lose market share by 2026? Which are the leading CSD companies? What market share do they command and how has thatchanged? What are the top 20 brands by advertising expenditures? What are the latest trends involving CSD-style offerings boasting functional benefits? What is the expected performance of fountain versus packaged CSDs to 2026?This report featuresU.S. Carbonated Soft Drink and Functional Sparkling Beverages Topline contains key informationconcerning the U.S. CSD market; it features category volume and per capita consumption data; leadingcompanies' market share and five-year projections.
U.S. Carbonated SoftDrinks and SparklingFunctional BeveragesTopline
NOTE: The 2022 edition of this report has not yet been published. The dates on tables ofcontents/exhibits and sample data reflect information from last year’s edition of this report.The 2022 edition you receive will have updated data through 2021 and projections through 2026 whereapplicable.U.S. Carbonated SoftDrinks ToplineDecember 2021RESEARCH DATA CONSULTINGNOTE: The information contained in this report is confidential and solely intended for the benefitof the immediate recipient hereof.Copyright 2021 Beverage Marketing Corporation of New York, P.O. Box 2399, Wintersville, OH 43953,(212) 688-7640. All rights reserved. Reproductions in any form prohibited by law.
ContentsTable of Contents
U.S. Carbonated Soft Drinks ToplineTABLE OF CONTENTSTABLE OF CONTENTS -----------------------------------iSummaryU.S. CARBONATED SOFT DRINKS TOPLINEThe National Soft Drink Market --------------- Overview --------------------------------11 Volume ---------------------------------Per Capita ---------------------------12 Growth ------------------------34 Quarterly Growth Trends --------------Recent Trends --------------------------45The Regional Soft Drink Markets ------------- Overview --------------------------------77 Regional Per Capita Consumption ----Exhibits912U.S. Carbonated Soft Drink Market Volume and Change 1960 – 2025 ------------------U.S. Carbonated Soft Drink Market Per Capita Consumption 1970 – 2025 --------------121334U.S. Carbonated Soft Drink Market Compound Annual Growth 1970 – 2025 -----------U.S. Carbonated Soft Drink Market Quarterly Volume Shares in Measured Channels142003 – 2020 ------------------------------U.S. Q1, Q2 and First Half 2021 Estimated Volume, Share and Growth by Diet155vs. Regular CSDs -------------------------U.S. Carbonated Soft Drink Market Volume Comparisons Between Pre-Covid-19 and166177Post-Covid-19 2020 – 2025 --------------U.S. Carbonated Soft Drink Market Wholesale Dollar Comparisons Between188Pre-Covid-19 and Post-Covid-19 2020 – 2025 --------------------------------------------U.S. Carbonated Soft Drink Market Retail Dollar Comparisons Between Pre-Covid-199and Post-Covid-19 2020 – 2025 ---------Regional Soft Drink Markets Volume 2015 – 0 Regional Soft Drink Markets Share of Volume 2015 – 2025 -----------------------------11 Regional Soft Drink Markets Change in Volume 2016 – 2025 -----------------------------212212 Regional Soft Drink Markets Compound Annual Growth 2005 – 2025 -------------------13 Regional Soft Drink Markets Per Capita Consumption 2015 – 2025 ----------------------232414 U.S. Soft Drink Market Packaged and Fountain Share 1975 – 2025 ---------------------15 U.S. Soft Drink Market Share by Flavor 2015 – 2025 -------------------------------------252616 The Leading Soft Drink Companies Share 2015 – 2020 -----------------------------------2717 U.S. Soft Drink Market National Brands vs. Private Label Gallonage and Share1993 – 2025 ------------------------------18 The Top Soft Drink Brands by Advertising Expenditures 2015 – 2020 -------------------2829AppendixA. U.S. Population by Region 1982 – 2020 --iCopyright 2021 Beverage Marketing Corporation of New YorkReproduction without written permission is strictly prohibited30
A number of variables affect the per capita consumption of CSDs, including weather, historicalconsumption trends, strength of local bottlers and success of product alternatives. Relatively hot weather and fewer alternative beverages characterize the Southand the Southwest. The West Central and the East Central regions also havefewer alternative beverages than the coastal regions. Since the Northeast and the Pacific have many more alternative beverage choicesthan other regions, both have a CSD per capita consumption rate beneath thenational average. Nonetheless, the per capita consumption rate of CSDs in the Northeast stoodnearly 15 gallons higher than that in the Pacific region in 2020. This is probablybecause healthy lifestyles are given especial importance in the latter region. The Pacific has had a long history of heavy bottled water consumption. In 2002,a sort of watershed event occurred — people in the Pacific drank more bottledwater than CSDs for the first time. This has since occurred in two other regions:the Northeast and the Southwest. When compared to the East Central, the Northeast continues to confoundexpectations. Despite having nearly 11 million more people, the Northeast lagsbehind the East Central in terms of overall CSD consumption. The West region also trails the national average. Per capita consumption in theregion decreased from 28.6 gallons in 2019 to 27.4 gallons in 2020. All regions are expected to have dwindling per capita consumption in the next fiveyears.Copyright 2021 Beverage Marketing Corporation of New YorkReproduction without written permission is strictly prohibited
Copyright 2021 Beverage Marketing Corporation of New YorkReproduction without written permission is strictly prohibited
Beverage Marketing Corporation 850 Third Avenue, 13th Floor, New York, NY 10022 Tel: 212-688-7640 Fax: 212-826-1255 U.S. Carbonated Soft Drinks and Functional Sparkling Beverages Topline from Beverage Marketing Corporation provides key category data and five year forecasts. Perfect for investors,