Transcription
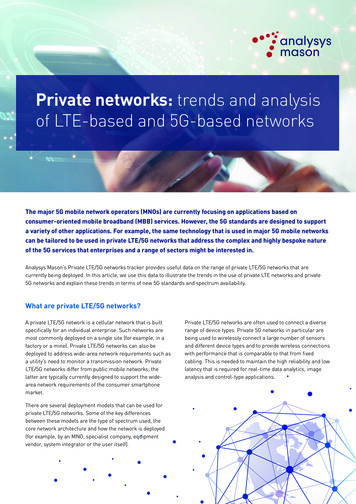
An Introduction to the Analysys Mason DataHubAnalysys Mason DataHub:Introduction to key featuresand content overviewHilary Bailey, Research Director, Head of DataOctober 2019
An Introduction to the Analysys Mason DataHub2The DataHub, our database tool, enables clients to access our core data productsfrom a single online portalActuals andforecastsportals:over 2600metrics in totalOn-screendefinitions andupdate dates80 countries,8 ionFORECASTS:Core, IoT,BusinessServices, payTV metric setsand more Save and reload searchesActualsupdatedquarterly,forecasts twicea yearActuals:operator andcountry,quarterly andannual data(270 metrics)Actuals:around 550operators,normalised andas-reported, data,including financialKPIs for GroupsExport to Excelfor furtheranalysisOn-screencharts, easycomparisons
An Introduction to the Analysys Mason DataHub3Geographical coverage: more than 80 countries in 8 regions, regional totalsand worldwide resultsGeographical coverage of Analysys Mason Core Data, May 2019Western Europe2North SpainSwedenSwitzerlandUKCentral and Eastern EuropeLatin atviaCzech Republic erging Asia–PacificMiddle East and North angladeshCambodiaChinaIndiaIndonesiaQatarSaudi pinesSri LankaThailandVietnamSub-Saharan AfricaCameroonNigeriaTanzaniaCôte d’Ivoire RwandaUgandaGhana South Africa ZambiaKenyaSudanZimbabwe1Developed Asia–PacificAustralia New ZealandHong Kong SingaporeJapanSouth KoreaTaiwan1Historical data only2Plus a limited set of actuals for Iceland
An Introduction to the Analysys Mason DataHubResearch from Analysys Mason: many datasets now reside in the DataHubanalysysmason.com/researchKEY: Datasetsin DataHubCoreData4TopicData
An Introduction to the Analysys Mason DataHub5Analysys Mason DataHub – what kind of questions can the data address?Worldwide fixed and mobile telecoms service revenue (USD Bn)1 6001 4001 2001 00080060040020005G mobile connections by region (millions)3002502001501005002012 2013 2014 2015 2016 2017 2018 2019 2020 2021 2022Mobile2017NAMFixedWorldwide Total Value Chain IoT Revenue (USD obile fourth entrant market shares of mobile connections30030%20020%100201810%02013 2014 2015 2016 2017 2018 2019 2020 2021 2022 2023 2024 2025 2026AgricultureHealthSmart buildingsAutomotiveIndustrySmart citiesFinanceRetailTracking0%20122013Peru (Bitel)France (Free)Romania (Digi)20142015Poland (Play)Chile (WOM)Slovakia (SWAN)20162017Rwanda (Airtel)USA (T-Mobile)
An Introduction to the Analysys Mason DataHub6Analysys Mason DataHub – key conceptsChoose betweenACTUALS andFORECASTS:Actuals:The most recentcountry and operatordata, includingquarterly and asreported data (whereavailable).Forecasts:A coherent set ofcountry forecastsbased on a timestamped set ofhistorical data. Theyrun for at least fiveyears into the future,in the context ofhistorical data from2008 or earlierLOAD A SEARCH:Re-use a saved search(countries, operators,metrics, years)ABOUT THE DATAHUB:Key information aboutyour subscription,recent updates andhow to use theDataHubThe “new data” iconshows when data hasrecently beenrefreshed
An Introduction to the Analysys Mason DataHub7Analysys Mason DataHub – main featuresOn-screen help givesdefinitions, updatedates and details of ourtaxonomyDynamic filtering:Find the metrics youneed by filtering on keyidentifiersTiered metric namesmake our taxonomyclearSaved searches:Repeat regular searchesSee Version log (detailsof latest updates),subscription details, fullmetrics list and otheruseful information hereForecast views:See themed data sets:filters rearranged andjust the relevant metricsand geographies areshownDataset alert box:describes the sub-set ofthe database currentlybeing viewed. switch offselected view by clickingon “remove”Levels:Pick out top-levelmetrics, or a greaterdegree of granularityCountry count:Easy to see how muchdata is available
An Introduction to the Analysys Mason DataHub8Analysys Mason DataHub – results features (FORECASTS)On-screen charting foreasy comparisonsInstant currencyconversionView data roundedor unroundedExport to Excel for furtheranalysisOn-screen help givesdefinitions, update datesView a single row withthis quick chartColours distinguishbetween historical dataand forecasts
An Introduction to the Analysys Mason DataHubAnalysys Mason DataHub – operator search features (ACTUALS)Select operators by geographySelect operators by network fixed or mobileSelect operators by type Mobile – entrant order Fixed - technologyFree-text search helps you tofind all instances of anoperator name9
An Introduction to the Analysys Mason DataHub10Analysys Mason DataHub – results features (ACTUALS)Select country,operator data, orbothView datarounded orunroundedOn-screencharting for easycomparisonsInstant currencyconversionExport to Excelfor furtheranalysisSelect Annual,quarterly, halfyearly data, or allOn-screen helpgives definitions,update datesView a single rowwith this quickchart
An Introduction to the Analysys Mason DataHub11Analysys Mason DataHub – direct links from report landing pagesClicking on this link willtake you directly to theDataHub and load theresults relevant to thisreport. (You need to belogged in for this towork, and you will seeas much of the data asoverlaps with yoursubscription.)
An Introduction to the Analysys Mason DataHub12Analysys Mason DataHub – direct links: for a small dataset the results are shownimmediately, eg India country reportExpand search criteria toreturn to the filters andchange your selection of data,Export to Excel for furtheranalysis
An Introduction to the Analysys Mason DataHub13Analysys Mason DataHub – direct links: for a large dataset the filters are shown sothat you can refine your search further, eg Emerging Asia–Pacific Telecoms forecastThe countries andregions associatedwith this report arepre- selectedThe metricsassociated with thisreport are preselectedReturn to viewingeverything byremoving this viewRefine your searchfurther by selectingadditional filtersSearch when you areready to see yourdata selection
An Introduction to the Analysys Mason DataHub14Analysys Mason DataHub contains core data plus extended topic datasetsCore data:All metrics fromthe regionalmarketsprogramme whichdescribe the totaltelecoms marketat country levelfor forecasts andcountry andoperator level nessServicesEuropeAPACCore Pay TVKEYForecastsActualsBothGlobalforecastData trafficforecasts(fixed andwireless)More tocome More tocome Topicdatasets:Typically forecasts,which expand onthe core metricswith much greatergranularity. Datasupplied fromother programmesin the AnalysysMason Researchportfolio, such asOperator BusinessServices and IoTand VideoStrategies
An Introduction to the Analysys Mason DataHub15Core v Topic: adding granular topic forecasts to the DataHub – the example of IoTCOREFORECAST DATA( 350 metrics) Mobile connections Handset MBB IoT Penetration Mobile service revenue Voice Data Handset data MBB IoT Mobile ARPU/ASPU Mobile traffic Fixed connections Fixed revenue Fixed ARPU/ASPU Fixed traffic Fixed Mobile Pay-TV IoT FORECAST( 1200 metrics)Top level results: IoT connx/revGranular data: Automotive Fleet tracking HGV Fleet tracking LCV Connected cars Finance Health Industry Public sector Retail Security Utilities Top level results correspond to the IoT results inthe core dataset. The IoT dataset expands onthese to provide high level of detail
An Introduction to the Analysys Mason DataHub16Core data: all metrics are standardised to common definitions for valid comparisonsACTUALS ( updated quarterly)Metrics, timespanandGeographyCOUNTRY RESULTS(Common to both portals)ValuesComparativemetricsOPERATOR RESULTSValuesComparativemetrics FORECASTS80 countries, around 550 operatorsAnnuals: 2003-2018Quarters/Half years: 3Q 2004 – latest quarter (eg. 2Q 2019)Over 190 metrics (plus 80 more for Europe only)(updated twice yearly) 80 countries, 8 regions, worldwide totals Annuals: 2008-2023/4 Over 180 core metrics (plus around 150 more forEurope only)Revenue(total/voice/data)Socioeconomicdata ( EIU)Connections (split bytechnology, devices,payment plan)Traffic (voice,data, SMS)ARPU(total/voice/data)Revenue perminute or MB,per capita, asshare of GDPPenetration, share bytechnology/deviceTraffic ares ofrevenueChurnConnectionsPrepaidshareMarketshares ofconnectionsTrafficTraffic perconnxMarketshares oftrafficFinancialKPIsEBITDAmargin,CAPEX/Revenue1 We provide both normalised and as-reported operator data for key metrics
An Introduction to the Analysys Mason DataHub17Core data: historical data and forecasts for around 180 metrics in all 80 markets,with extra detail (150 additional metrics) for EuropeFIXEDMOBILE Mobile connections andpenetration:Connections Prepaid/contract Prepaid/contract 2G/3G/4G/5G 2G/3G/4G/5G Handset/mobilebroadband/M2M Smartphone/nonsmartphone Service revenue: Wholesale/retail Prepaid/contract Handset/mobilebroadband/IoTRevenue 2G/3G/4G/5G Voice/messaging/data Revenue per capita, % ofGDPTraffic Mobile handsets:Retail revenue: Handset/mobilebroadband/IoT Voice/messaging/data Revenue per GBARPU: Overall Total fixed voiceconnections: narrowband DSL, VDSL, FTTH/B VoIP Cable modem Pay TV subscribers BFWA, 5G/sub-5G Dial-up connections Other fixed broadband Service revenue Retail revenue: Fixed voice Fixed broadband Pay TV Specialist businessservices Excluding M2M Dial-up internet Handset: Revenue per capital, %of GDP Prepaid/contract Voice/non-voice Outgoing voice traffic and MoU, data traffic Fixed broadbandconnections: Fixed broadband retailrevenue: DSL revenue FTTH/B revenue Cable modemrevenue BFWA revenue(5G/sub-5G) Other fixed broadbandrevenue Outgoing voice traffic and MoU
An Introduction to the Analysys Mason DataHub18Topic datasets give more granular analysis of key development subjectsIoT forecastsGranular forecasts from the Digital Economy Strategiesresearch programme, providing around 1200 metrics,encompassing 10 sectors and 6 value chain elements for over80 countries and 9 regional totalsOperator Business Services forecastsOver 850 key telecoms metrics split by size of enterprise –micro, small, medium and large. Specialist business servicescovered include emerging services such as SaaS, IaaS,security, as well as traditional voice and connectivity services.We show operator revenue and revenue for all providers(including third-party/OTT players). Over 50 markets (regionsand individual countries) are covered.FMC quarterly dataQuarterly historical metrics on FMC accounts, revenue andmarkets shares for 11 European countries (and 78 operators).Pay-TV forecastsOver 100 metrics for around 50 markets (regions andindividual countries), which size the market for traditional payTV by delivery platform.Communication services forecastsForecasts of voice and messaging services for operators andOTT players – around 40 metrics for 73 geographies.Data traffic forecasts33 wireless data traffic metrics for 48 countries and 12 fixeddata traffic metrics for 37 countries, split by technology anddevice, including downstream and Wi-Fi elements.We will add more topic datasets in the coming months, including forecasts for FTTx capex, smartphones and tablets
An Introduction to the Analysys Mason DataHub19From the IoT and M2M service practice: IoT forecasts (2013–2027) for around1200 metrics in all 84 country marketsWIRELESS IoT: CELLULAR AND LPWA Connections by technology (country markettotal): 2G, 3G/4G, 5G, NB-IoT, LTE-M, OtherLPWA Connections by sector/application bycountry marketConnections Agriculture (cattle, forest, irrigation) Automotive (fleet HGV, fleet LCV,embedded, aftermarket) Finance (ATMs) Health (chronic RPM, acute RPM, PERS) Industry (Heavy equipment, gas/oilpipelines, machine tools, warehousemanagement). Service revenue by technology Total value chain (TVC) revenue for 2G,3G/4G, 5G, NB-IoT, LTE-M, Other LPWARevenue Service revenue for cellular and LPWA Total value chain Retail (in-store, roadside, temporary,transit hub, public venue signage, PoS,vending machines) Smart building (security alarms, backup,security cameras, smoke alarms, whitegoods) Smart cities (CCTV, parking, streetlights,waste bins)FIXED Connections bysector/application bycountry marketSector/application as forcellular and LPWA whereapplicable for fixedtelecoms networks IoT tracking (bicycles, people, cylinders,high value assets, pets, skips) Utilities (electric meters, dual-fuel meters,gas meters, water meters, waterpipelines, smart grid) Other Service revenue by sector/application Total value chain Total value chain split by communicationshardware, device, hardware installation,connectivity service and application Total value chain split by communications ARPU for cellular and LPWA:hardware, device, hardware installation, Total blended ARPU for connectivityconnectivity service and applicationservice only Service revenue bysector/application Total value chain splitby communicationshardware, device,hardware installation,connectivity serviceand application ARPU Total blended ARPU forconnectivity service only
An Introduction to the Analysys Mason DataHub20From the Operator Business Services programmes: Worldwide Business forecasts(2013–2023) ional and worldwidetotals plus 45 individualmarkets in the followingregions: WE (11) CEE (7) DVAP (7) EMAP (7) MENA (6) SSA (3) NA (2) LATAM (2)Enterprise segmentsServicesSegments: Micro (0–9employees) Small (10–49employees) Medium (50–249employees) Large (250 employees)Mobile: Voice, messagingand handset data Mobile broadband IoT connectivity(cellular and LPWA)Fixed: Narrowband andVoBB ADSL/SDSL, vDSL,FTTP/B, cable,BFWA, other fixedbroadbandMetrics Operator revenue Whole addressablemarket revenue (ICTservices) Connections / Users ARPU Employees,enterprises andbusiness sites Dedicatedconnections up to100Mbps, 100Mbps and upto 1Gbps, and 1Gbps Traditionalmanaged servicesOther specialistbusiness services: Unifiedcommunications Security Colocation andhosting Private cloud Software-as-aservice (SaaS,public cloud) Platform-as-aservice (PaaS,public cloud) Infrastructure-as-aservice (IaaS, publiccloud) Enterprise mobility Desktopmanagement IoT connectivity Pay TV (Europe)Forecasts are updated annually, but also verified and adjusted at each bi-annual regional core forecast update
An Introduction to the Analysys Mason DataHub21From the Video Strategies programme: Worldwide Pay TV forecasts and historicalmarket share data for EuropeGeographyForecastsActualsRegional andworldwide totals plus41 individual markets: WE (16) CEE (10) DVAP (2) EMAP (7) MENA (4) SSA (0) NA (2) LATAM (0)Currently available for32 individual marketsin Europe, 11 in Asia–Pacific, 4 in MENAand 2 in NorthAmericaMetrics100 metrics: Connections Users Penetration Retail revenue ASPU30 metrics: Connections Market share ofconnections Penetration Retail revenue Market share ofretail revenueService platform Total traditionalCATVCATV – analogueCATV – digitalIPTVSatellitePay DTTOTT to the TV Total traditionalCATVCATV – analogueCATV – digitalIPTVSatellitePay DTTForecasts are updated annually, but also verified and adjusted at each bi-annual regional core forecast updateDetailed OTT video forecasts are due to be added to the DataHub shortly.Provider type Operator OTT/non-operator Operator
An Introduction to the Analysys Mason DataHub22From the Future Comms programme: Worldwide Communications Services forecasts(2012–2023)GeographyRegional andworldwide totals plus63 individual markets: WE (16) CEE (16) DVAP (7) EMAP (10) MENA (5) SSA (4) NA (2) LATAM (3)Commsservice typeMetrics 40 metrics: ConnectionsUsersRevenueASPUTraffic VoiceCircuit-switchedVoIPVoLTEWiFi callingMessagingMessaging – SMSMessaging – IPDevice HandsetSmartphoneTabletPC/laptopForecasts are updated annually, but also verified and adjusted at each bi-annual regional core forecast updateProvidertype Operator OTT/non-operator
An Introduction to the Analysys Mason DataHub23From the Network Traffic programme: wireless and fixed network data trafficforecasts provide data traffic presented as follows tion39 individual markets,8 regional results,plus worldwide total33 metrics:Data trafficvolume, usageper connectionand bandwidth Cellular:2G/3G/4G/5G Public/private Wi-Fi Handset Mobile broadband:– mid-screen Mobile broadband:– large screen Upstream Downstream26 individual markets,8 regional results,plus worldwide total12 metrics:Data trafficvolume, usageper connectionand bandwidth Internet/managedIP/multicast IPTV NGA/non-NGAForecasts are updated annually Upstream Downstream
An Introduction to the Analysys Mason DataHub24From the Convergence Strategies programme: European FMC market dataGeographyMetricsData for 96 operatorsin 14 markets: Belgium France Germany Italy Netherlands Portugal Spain UK Poland Romania Turkey Australia Malaysia Philippines9 metrics:FMC accounts users share of fixedbroadband householdpenetration operator marketshareFMC SIMS users SIMS per accountFMC revenue total Operator marketshareData available fortotal market and atthe operator level
An Introduction to the Analysys Mason DataHub25Analysys Mason DataHub: access combines a metric set and a geographical scope– you can choose the EXAMPLES Standard coreExtended core (more metrics just for Europe)Financial KPIsIoT datasetOperator Business Services/SME forecastsPay TV datasetCommunications forecastData traffic forecasts or a custom selectionGEOGRAPHIESEXAMPLES Europe [WE/CEE]Asia–Pacific [DVAP and/or EMAP]Middle East and Africa [MENA/SSA]Americas [NA/LATAM]Worldwide [forecasts only]Custom clusters [operator footprints,developed/developing markets, country]
An Introduction to the Analysys Mason DataHub26Adding granular topic forecasts to the DataHub: targets for rvicesCore DataAmericasGlobalFinancialKPIsTarget for2019TelecomSoftwaremarketsharesFixed yforecastsGlobalforecastFMCquarterlymetricsPay TVGlobal ICT modelNEWEUROPEAPACWirelessdata trafficforecastsSmartphoneforecastsFTTx Capexforecast
An Introduction to the Analysys Mason DataHub27Contact detailsHilary BaileyResearch Director, Head of sysmason.com/RSS/BostonTel: 1 202 331 3080boston@analysysmason.comManchesterTel: 44 (0)161 877 7808manchester@analysysmason.comCambridgeTel: 44 (0)1223 460600cambridge@analysysmason.comMilanTel: 39 02 76 31 88 34milan@analysysmason.comDubaiTel: 971 (0)4 446 7473dubai@analysysmason.comNew YorkTel: 212 944 5100newyork@analysysmason.comDublinTel: 353 (0)1 602 4755dublin@analysysmason.comNew DelhiTel: 91 124 4501860newdelhi@analysysmason.comHong KongTel: 852 3669 7090hongkong@analysysmason.comOsloTel: 47 920 49 000oslo@analysysmason.comKolkataTel: 91 33 4003 3093kolkata@analysysmason.comParisTel: 33 (0)1 72 71 96 96paris@analysysmason.comLondonTel: 44 (0)20 7395 9000london@analysysmason.comSingaporeTel: 65 6493 6038singapore@analysysmason.comMadridTel: 34 91 399 5016madrid@analysysmason.comStockholmTel: 46 709 211 719stockholm@analysysmason.com
An Introduction to the Analysys Mason DataHub28Analysys Mason’s consulting and research are uniquely positionedAnalysys Mason’s consulting services and research portfolioConsultingWe deliver tangible benefits to clients across the telecomsindustry: communications and digital service providers, vendors,financial and strategic investors, private equity andinfrastructure funds, governments, regulators, broadcastersand service and content providersOur sector specialists understand the distinct local challengesfacing clients, in addition to the wider effects of global forces.We are future-focused and help clients understand the challengesand opportunities new technology brings.ResearchOur dedicated team of analysts track and forecast the differentservices accessed by consumers and enterprises.We offer detailed insight into the software, infrastructure andtechnology delivering those services.Clients benefit from regular and timely intelligence, and directaccess to analysts.
An Introduction to the Analysys Mason DataHubResearch from Analysys MasonConsumer services programmesDigital economy programmesMobile ServicesDigital Economy StrategiesMobile DevicesFuture CommsFixed Broadband ServicesOperator business services and IoT programmesConvergence StrategiesVideo StrategiesDIGITALECONOMYOperator investment programmesOperator Investment StrategiesNetwork TrafficSpectrumTelecoms software and networksprogrammesTelecoms Software Market SharesNetwork-focusedNext-Generation Wireless NetworksOPERATORINVESTMENTLarge Enterprise Emerging Service OpportunitiesSME StrategiesIoT and M2M ServicesSMB ICTCHANNELSANDFORECASTSCONSUMERSERVICESSoftware Forecast and StrategyLarge Enterprise Voice and Data ConnectivityOPERATORBUSINESSSERVICESAND IOTRESEARCHPORTFOLIODigital Infrastructure StrategiesCustomer-focusedDigital ExperienceCustomer EngagementManaged Service Provider StrategiesGlobal Telecoms DataREGIONALMARKETSAmericasAsia–PacificMiddle East and AfricaService Design and OrchestrationNetwork Automation and OrchestrationSMB ICT channels and forecasts programmesRegional markets programmesVideo and Identity PlatformsAutomated AssuranceIoT Platforms and TechnologyEuropean Core ForecastsTELECOMSSOFTWARENETWORKSFORECASTSAND MARKETSHARESMonetisation PlatformsTELECOMSSOFTWARECONSUMEREuropean Telecoms Market MatrixEuropean Country ReportsDataHub 2500 forecast and 250 historical metricsRegional results and worldwide totalsOperator historical dataAI and Analytics29
An Introduction to the Analysys Mason DataHubConsulting from Analysys Mason30
An Introduction to the Analysys Mason DataHubPUBLISHED BY ANALYSYS MASON LIMITED IN AUGUST 2018Bush House North West Wing Aldwych London WC2B 4PJ UKTel: 44 (0)20 7395 9000 Email: research@analysysmason.com www.analysysmason.com/research Registered in England and Wales No. 5177472 Analysys Mason Limited 2018. All rights reserved. No part of this publication may be reproduced, stored in a retrieval system or transmitted in any form or by any means – electronic,mechanical, photocopying, recording or otherwise – without the prior written permission of the publisher.Figures and projections contained in this report are based on publicly available information only and are produced by the Research Division of Analysys Mason Limited independently of anyclient-specific work within Analysys Mason Limited. The opinions expressed are those of the stated authors only.Analysys Mason Limited recognises that many terms appearing in this report are proprietary; all such trademarks are acknowledged and every effort has been made to indicate them by thenormal UK publishing practice of capitalisation. However, the presence of a term, in whatever form, does not affect its legal status as a trademark.Analysys Mason Limited maintains that all reasonable care and skill have been used in the compilation of this publication. However, Analysys Mason Limited shall not be under any liability forloss or damage (including consequential loss) whatsoever or howsoever arising as a result of the use of this publication by the customer, his servants, agents or any third party.
An Introduction to the Analysys Mason DataHub 2 The DataHub, our database tool, enables clients to access our core data products from a single online portal Save and re-load searches On-screen definitions and update dates On-screen currency conversion Actuals and forecasts portals: over 2600 metrics in total Actuals: operator and country .